Author name / JHMTR 00 (2013) 000–000 45
1.
Introduction
Thermal photovoltaic (PV/T) is a type of solar energy
technology in which water or air is used to recover the
waste heat of PV panel. Main advantage of this system
is improvement of the photovoltaic module efficiency.
Three main PV/T types are including water cooled, air
cooled and combined air/water fluid [1]. Comparison of
performance evaluation results for four numerical
models with experimental data shows that a one
dimensional static PV/T model is good as much as three
dimensional dynamic model [2]. Parametric analysis of
different types of systems shows that the best
configuration was the spiral flow [3]. Comparison of
generated energy through PV/T system and single PV
using numerical method shows that PV/T system
generates 14% less electricity than single PV [4].
Results of evaluation for plate and tube with header and
riser and channel type configurations indicates that,
thermal and electrical efficiency for the first type was
40.7% and 11.8%, respectively. For the second type,
thermal efficiency was equal to 39.4% and electrical
efficiency was 11.5% [5]. As a result of studying effect
of glazing transmissivity and covering on rectangular
channel type modeled system, electrical efficiency was
improved by increasing the amount of glazing
transmissivity [6]. Overall efficiency was increased
with increasing of flow and collector length and it has
been reduced in higher plate temperatures. Optimum
exergy efficiency was achieved in 0.006 (kg/s) flow rate
with 2 meters collector length [7].
After simulation of header-riser and spiral PV/T systems, outer diameter of tubes, distance between tubes and absorber plate thickness have been optimized. As a result, efficiency of the spiral model was four percent more [8]. Based on results of performance evaluation for rectangular channel type PV/T system, higher electrical efficiency was achieved with lower inlet water temperature, higher flow rate and lower PV/T module number [9]. In this research, multi objective optimization of water cooled PV/T with spiral configuration of tubes has done using genetic algorithm. Mathematical function of system has been numerically solved based on a code development in MATLAB software. Afterwards, three independent variables have been selected for parametric studies including mass flow rate, tube diameter and inlet water temperature.2. Materials and Methods
For the purpose of analyzing energy balance of PV/T system, heat transfer phenomena has been applied. Figure 1 shows thermal resistance circuit of the considered model.
Energy and Exergy Optimization of Water Cooled Thermal Photovoltaic (PV/T)
System Using Genetics Algorithm
M.Shakouri
a,b*, S.Golzari
b, M.Zamen
ca
Graduate Faculty of Environment, University of Tehran, Tehran, Iran. * E-Mail: [email protected] b
Iranian Institute of Research and Development in Chemical Industries (ACECR)
cDepartment of Mechanical Engineering, Shahrood University of Technology, Shahrood, Iran Journal of Solar Energy Research Vol 1 No 1 (2016) 45-51
Journal of Solar Energy Research (JSER)
Journal homepage: jser.ut.ac.ir
A B S T R A C T
In this paper, a water cooled thermal photovoltaic (PV/T) system has been optimized by using genetics algorithm in MATLAB software. Electrical and thermal efficiencies have been defined as objective functions based on energy and exergy considerations. As a result of optimization, achieved value for each of independent variables has been optimized. Similarly, a Pareto diagram for optimum range of decision variables is illustrated for multi objective function.
© 2016 Published by University of Tehran Press. All rights reserved.
ARTICLE INFO
Received: 19 May 2016 Received in revised form: 27 Jul 2016
Accepted: 1 Aug 2016 Available online: 4 Aug 2016
Keywords
:
Water cooled thermal photovoltaic; Plate and spiral tube structure; Optimization; Genetics algorithm
46
Figure 1. Thermal resistance circuit diagram of PV/T [7]
Reference [10] is used for modeling of heat transfer. The following assumptions is considered for energy balance of PV/T system:
all processes are steady state;
fluid flow in channels is invariable and developed;
specific heat capacity of all components is neglected;
average temperature is considered for each layer;
ambient temperature is considered equal for bottom, upper and side parts of the PV/T module;
heat loss from bottom, upper and side parts of PV/T module is equal to the ambient temperature.
In the presented model, temperature distribution is completely different from one tube to the other, which is presented in Figures 2 and 3.
Figure 2. Schematic diagram of absorber plate and serpentine tube [11]
Figure 3. Temperature distribution of plate between segments i and i+1 [11]
In this research a PV/T system is consist of crystalline PV panel which is attached with high thermal conductive glue. A modeled collector is consisting of N parts in which W is the gap between tubes, L is tube length, Do and Di are outer and inner diameters, respectively. Water flow temperature from each part is equal to the inlet water temperature of the next part. It has considered that, the absorber plate temperature in connection area to the tube is Tbi and it is constant in whole length of the tube.
The temperature gradient in whole length of the tube is neglected for the absorber plate. Equations related to the absorber plate linked to the tube is considered similar to a fin. Energy balance equations for each layer of PV/T are presented in the below. An energy balance for glass glazing layer for PV module with tedlar and for the layer below the tedlar in a model with glass glazing can be written by equations 1 and 2.
1
G c c c T
t c amb T c bs el c
G G bdx
U T T U T T bdx G bdx
(1)
1 2
T c bs T bs f
T c bs p p eff tw f amb
U T T bdx h T T bdx
U T T h h G U T T
(2)
Calculation of energy balance for absorber plate is done based on reference [11]. Heat flow for the ith tube is calculated by equation 3 to 7 using finite difference numerical method.
1 cosh
2
i i i
q n i N (3)
1
κ cosh 1 1
i i i
q n i N (4)
1 κ 11 cosh
q n (5)
κ 1 cosh
N N
q n (6)
i i i
q qq (7)
2 2/ ,
κ k / , /
i bi amb abs L
abs L L o abs
T T S U
L U sinhn n U W D kL
(8)
In equation 8, Tbi is the base temperature of upper part of each tube and Sabs is the heat rate per area unit which is received by absorber plate. Fluid useful energy in length unit in ith tube can be calculated using equation 9. Also, useful thermal energy from absorber to fluid can be calculated by equation 10.
ui i o L i
q q D U (9)
/ ui bi fiq T T R (10)
A term “-DoULθi” is the collected energy in length unit in ith tube. Using equations 7, 9 and 11, a matrix based equation 12 will result.
i fi Rqui
(11)
1κ
u f
q R (12)
1 1 1 ,
2 / κ
ij i iN ij ij ij
o L
coshn D U
(13)
For the purpose of fluid energy balance calculation in ith tube, Tfi is calculated using differential equation 14.
1i 0fi
pw ui
dT
mC q
dy (14)
Considering equations 12 and 14 with matrix format as well as using boundary condition within equation 15 to 18, temperature distribution in each tube is extracted.
10 tu
p L d
R
d mc
ٍ
(15)
1
0 Φ 1
at (16)
1
0 Φi Φ i
1
1 Φi Φ i
at iodd (18)
1/
0, / ,
1i fi y Ltu ij ij
ٍ (19)
W
exp 1 o L p L D U mc RDU
(20)
Using equation 15, the useful absorbed heat will be calculated. This equation is similar to Hottel-Whillier-Bliss Equation in solar collector.
, ,
1 2 ,
u pw f out f in
R c p p eff L f in amb
Q mC T T
F A h h G U T T
(21)
A term “FR” is the heat removal factor which is a design critical parameter and will be calculated using above equations. For calculation of equations 1 to 21 references [2, 7 and 11] have been applied. The fluid flow in spiral model tubes is “m”. For the purpose of friction coefficient calculation within circular pipes considering developed laminar flow, equation 22 can be applied.
64 /
f Re (22)
Friction factor in turbulent flow by consideration of slick area can be calculated using Blasius equation 23.
0.25
0.3164
f Re (23)
Pressure drop can be calculated using equation 24, if entrance of water to PV/T system is from bottom.
2 2
2 loss 2
o
f LV V
P g NW sin K
D
(24)
In this equation, V, ρ, φ and Kloss are fluid average velocity, fluid density, PV/T system slope and minor loss coefficient, respectively. The reviewed parameters for energy analysis are including thermal efficiency, electrical efficiency and total efficiency. Thermal efficiency can be applied using equation 25, which is the ratio of absorbed useful heat by fluid to received energy from solar irradiation by PV/T.
,
1 2L f in amb u
th R p p eff
c
U T T
Q
F h h
A G G
(25)
Electrical efficiency can be calculated based on PV temperature using equation 26 [2 and 4], in which the value of a term “ηel,ref” is 0.12 considering reference temperature equal to 25 degree Celsius. Temperature efficiency factor of the solar cell is “β” which is equal to 0.0045 for crystalline cells and calculated using empirical methods.
, 1
el el ref Tc Tref
(26)
Total efficiency of the system is defined based on aggregation of thermal and electrical efficiencies (equation 27) [6 and 12].
ov th el
(27)
According to the second law of thermodynamics, exergy or available energy related to the environment is the maximum useful work in a process. Electrical energy is more qualitative in compare to the thermal energy. Quality of the thermal energy depends on temperature in which heat is available. Two equations have been defined for thermal exergy of PV/T system:
1 0/
th pw out in out
Ex mC T T T T (28)
0. ln( / )th pw out in out in
Ex mC T T T T T (29)
In these equations, T0 is the reference temperature in which the thermal exergy is zero. In equation 28 a term “1-T0/Tout” is the Carnot factor. This equation was used in references [1 and 12]. Equation 29 is developed based on the theory of Gouy-Stodola and by using this equation; the amount of increased exergy can be calculated for temperature change from Tin to Tout. This equation
was used in reference [13]. Based on equation 30, by using average thermodynamics temperature, the equation 29 can be written as equation 28.
ln /
out in out in m
out in out in
h h T T
T
s s T T
(30)
The final equation for thermal exergy is shown in the below (equation 31).
1 0/
th pw out in m
Ex mC T T T T (31)
Electrical exergy is the same with electrical energy, which can be applied using equation 32.
el el el c
Ex P GA (32)
Reference temperature is considered equal to 20 degree Celsius. Solar exergy is considered as the input exergy and output exergy of PV/T system is thermal and electrical exergies. The solar exergy can be driven using Petela formula [14].
40 0
4 1
1 / /
3 3
sol sol sol c
Ex T T T T GA
(33)
By calculation of input exergy, thermal and electrical efficiencies of second law can be applied by equations 34 and 35. Total exergy efficiency formula is shown in equation 36.
th th sol Ex ξ Ex
(34)
el el sol Ex ξ Ex
(35)
ov th el
ξ ξ ξ (36)
Simulation model results have been evaluated and verified by the results of laboratory simulation of Zondag et al. [2]. The reference model is a combination of a polycrystalline silicon PV module with electrical efficiency amount equal to 9.7% with absorber plate and spiral tubes. For calculation of simulation parameters error value in compare to the experimental amounts, Root Mean Square of Percentage Error (RMS) for each parameter is calculated using equation 37.
2, , ,
100 Xsim i Xexp i /Xsim i
RMS
n
(37)
In this formula, “n” and “X” are number of tests and amounts of experimental or simulation parameter, respectively. During validation process some parameters including weather, performance and design parameters were used which are tabulated in Tables 1 and 2.
Table 1. Weather and operational condition for validation of developed model with reference [2]
Parameter Value
Ambient temperature (Tamb) 20 (oC)
Solar irradiation (G) 800 (W/m2)
Wind speed (Vw) 1 (m/s)
Fluid mass flow rate (m) 0.02 (kg/s)
PV/T system angle (φ) 45˚
Table 2. Design and operational condition for validation of PV/T with reference [2]
Parameter Value
Absorber area (Aabs) 1.12 (m2)
Photovoltaic area (Ac) 0.94 (m
2 ) PV efficiency in reference condition
(ηel,ref)
9.7 (%)
48
Flow channel length (L) 0.724 (m)
Emissivity of glass (εg) 0.9
Emissivity of PV (εc) 0.9
heat capacity of water(Cpw) 4200 (J/kg.K)
Thermal conductivity of air (kair)
0.025 (W/m.K) Thermal conductivity of glass (kglass) 0.9 (W/m.K) Thermal conductive of water (kwater) 0.6 (W/m.K) Cover glass thickness (Ltopglass) 0.0032 (m) PV glass thickness (LPVglass) 0.003 (m) Silicone cell thickness (Lcell) 0.00035 (m) Absorber plate thickness (Labs) 0.002 (m) Tube outer diameter (Do) 0.01 (m) Tube inner diameter (Di) 0.008 (m) Distance between tubes (W) 0.095 (m)
Air gap width (Lair) 0.02 (m)
Experimental and simulation efficiency values are shown in Figure 4. According to these graphs, there is a proper compliance between simulation and experimental results. In this step, the amount of error is 2.73 percent.
Figure 4. Comparison of experimental data of reference [2] and present study
Output of optimization model with a single objective function is an absolute minimum or maximum. However, in multi objective functions optimization, there would be a group of solutions (Pareto solutions). In this case, designer is a decision maker for selection of the proper solution. In this research, an optimization has been done by using code development in MATLAB software and application of genetics algorithm with single objective and multi objective functions. Achieved results shows an appropriate compliance with experimental data.
Weather and operational condition for the modeled system are in compliance with the data tabulated in Table 3. Defined range for each independent variable in genetics algorithm is shown in Table 4.
Table 3. Value of parameters in parametric study
Parameter Value
Ambient temperature (Tamb) 25 (oC) Solar irradiation rate (G) 1000 (W/m2)
Wind speed (Vw) 1 (m/s)
Collector area (A) 0.9 (m2)
PV efficiency in reference condition (ηel,ref)
12.4 (%)
Absorber plate thickness (Labs) 0.0015 (m)
Tube thickness 0.001 (m)
Distance between tubes (W) 0.1 (m)
Table 4. Defined range for each decision variable
Parameter Rage
Diameter of tube 4-16 (mm)
Mass flow rate 0.003 - 0.05 (kg/s)
Temperature of inlet water 15 – 45 (˚C)
3. Results & Discussion
The first objective function for PV/T system is maximizing electrical efficiency. Results of optimization for 200 initial population sample are presented in Table 5. According to the fact that electrical efficiency is reduced by increasing of inlet water temperature, the lowest temperature range is considered as proper range. The same situation is resulted for electrical exergy efficiency with the optimum amount equal to 12.7%.
Table 5. Optimization result considering electrical energy efficiency as an objective function
Parameter Optimum value
Diameter of tube 12 (mm)
Mass flow rate 0.03 (kg/s)
Temperature of inlet water 15 (˚C)
Electrical efficiency 11.84 %
Afterwards, the optimization algorithm is used for maximum total efficiency based on thermodynamics first and second laws. Optimization algorithm has been evaluated considering three independent variables including inlet water temperature, fluid flow rate and tube diameter.
By considering energy efficiency as an objective function, variation on both electrical and thermal efficiencies have the same behavior by variation of temperature. Lower temperature is resulted in higher efficiency. Higher fluid flow rates caused higher thermal and total efficiencies. Also, in lower tube diameters, pressure drop is raised up and electrical efficiency is dropped. Furthermore, the optimum diameter based on the results of an algorithm is equal to 9 millimeter. Optimization results have been tabulated in Table 6.
Table 6. Optimization result considering overall energy efficiency as an objective function
Parameter Optimum value
Diameter of tube 9 (mm)
Mass flow rate 0.05 (kg/s)
Temperature of inlet water 15 (˚C) Overall energy efficiency 68.08 %
According to the optimization results, the optimum electrical and thermal efficiencies are 11.63 and 56.44 percent, respectively. In addition, total exergy efficiency is 11.67%. Optimum values of independent variables are illustrated in Table 7 for the case in which total exergy efficiency is the objective function.
Table 7. Optimization result considering overall exergy efficiency as an objective function
Parameter Optimum value
Diameter of tube 8 (mm)
Mass flow rate 0.017 (kg/s)
According to the analysis, optimum total energy efficiency and optimum total exergy efficiency amount is equal to 68 and 13.95 %, respectively. In order to consider both energy and exergy efficiencies in an optimum amount, multi objective optimization has been applied. Since the energy and exergy efficiency trends are the same, one of them is considered for multi objective optimization. Accordingly, in multi objective optimization, total exergy efficiency and thermal energy efficiency have been considered as objective functions. Values related to both objective functions are illustrated in Figure 5.
Figure 5. Results for thermal energy efficiency and overall exergy efficiency as objective functions in Pareto area
The negative amount shows the minimum values in genetics algorithm. Thus, functions should be written in negative base for maximization. As it can be seen, there is no absolute optimum point and a group of points can be considered as a design criteria. Multi objective optimization has done using 200 initial samples.
As shown in Figure 6, maximum amount of thermal energy efficiency and total exergy efficiency are the same amounts of single objective function. Based on the results of optimization, maximum thermal energy efficiency and total exergy efficiency are equal to 55 % and 13.5 %, respectively. These amounts are very close to the results of single objective optimization results.
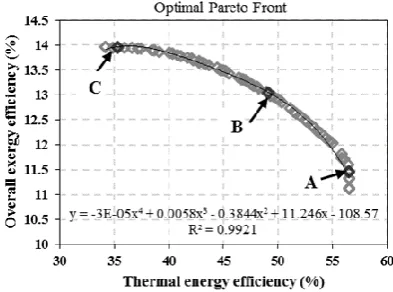
Figure 6. Pareto graph for thermal energy efficiency and overall exergy efficiency as objective functions
Optimum range for independent parameters and maximum values are shown in Table 8. As it can be seen in Pareto chart in Figure 6, increasing of one objective function caused reduction of the other one. According to this graph, a designer of a system can calculate the effect of variations.
Table 8. Optimization result considering overall exergy efficiency as an objective function
Parameter Optimum range
Diameter of tube 5.9 - 8 (mm)
Mass flow rate 0.019 – 0.047 (kg/s)
Temperature of inlet water 15 – 40 (˚C) Overall exergy efficiency 11.12 - 13.95 % Thermal energy efficiency 34.2 – 56.52 %
In Table 9, amounts of independent variables for some points of Pareto area are shown and points A, B and C referred to the Figure 6 are highlighted. Each point in is a kind of decision making vector X [(Di, m, Tin)]. All in all, a designer shall select one of the vectors in order to comply with the optimum Pareto conditions.
Table 9. Values for different selections of decision variables and objective functions
Tin (˚C) m(kg/s) Di (m) ηov,exergy (%) ηth (%)
15.01 0.0477 0.0068 11.445 56.496
17.92 0.0305 0.0079 12.375 53.128
21.88 0.0236 0.0077 12.988 49.313
33.40 0.0219 0.0077 13.872 39.149
38.19 0.0215 0.0080 13.952 35.329
In some points with low tube diameter, thermal energy efficiency in maximum and exergy efficiency is minimum. The amount of flow rate is higher in mentioned points and these phenomena will result in lower electrical exergy.
As an example, point A is complying with mentioned conditions. In the middle of the Pareto graph the exergy efficiency is grows up and thermal energy efficiency is dropped. Thermal efficiency and exergy efficiency of point B is 50 % and 13 %, respectively. Point C is in the area has the tube diameter of 8 millimeter and flow rate of 0.02 kg/s. The amount of parameters in this area resulted in reduction of thermal energy efficiency and increasing of exergy. If water flow rate and temperature reduced, thermal and electrical efficiencies will reduced and the same situation will be happened for electrical exergy. However, thermal exergy will grow up and will result in improvement of total exergy. Other dependent variables relate to the pinots A, B and C are tabulated in Table 10. For design of an energy efficient system the endpoints of the Pareto area should be selected.
Table 10. Values for decision variables, objective functions and dependent variables related to the points A, B and C of Pareto area
Parameter
A
B
C
Di (m) 0.0068 0.0077 0.0080
m (kg/s) 0.0477 0.0236 0.0215
Tin (˚C) 15.01 21.88 38.19
ηth (energy) (%) 56.496 49.313 35.329 ηov (exergy) (%) 11.445 12.988 13.952
ηel (energy) (%) 11.42 11.4 10.69
ηov (energy) (%) 67.91 60.5 46.0
ηel (exergy) (%) 12.25 12.23 11.47
ΔP (kPa) 58.51 23.96 21.39
4. Conclusions
50
efficacy objective function results in 13.95% with maximum inlet temperature. Furthermore, optimum interval for the multi objective function has been demonstrated using Pareto graph. The achieved results will facilitate the designers in order to apply it for design and construction of a system. This analysis shows that exergy and energy efficiency have adverse effects in design of the system.
Acknowledgements
Authors are acknowledged research and technology deputy of ACECR and head of IRDCI for their supports during implementation of this research.
Nomenclature
b
width of absorber plate (m)
C
pwSpecific heat capacity of water (J/kg.K)
D
Diameter (m)
Ex
Exergy rate (W)
f
Friction factor
F
RHeat removal factor
G
Solar radiation intensity (W/m
2)
h
Heat transfer coefficient (W/m
2.K)
hp1
penalty factor due to the presence of
solar cell material, glass and EVA
hp2
penalty factor due to the presence of
interface between tedlar and working
fluid
k
Thermal conductivity (W/m.K)
K
lossMinor loss coefficient
L
Thickness, length, length of PV/T
module (m)
m
![Figure 1. Thermal resistance circuit diagram of PV/T [7]](https://thumb-us.123doks.com/thumbv2/123dok_us/8945391.1854759/2.595.64.226.49.216/figure-thermal-resistance-circuit-diagram-pv-t.webp)
![Table 2. Design and operational condition for validation of PV/T with reference [2]](https://thumb-us.123doks.com/thumbv2/123dok_us/8945391.1854759/3.595.325.546.581.655/table-design-operational-condition-validation-pv-t-reference.webp)