ARTIGO ORIGINAL
AMP
STUDENT
Study on Portuguese Medical Schools’ Learning Conditions:
A National Analysis on Student Satisfaction, Student-Tutor
Ratios and Number of Admissions
Estudo sobre as Condições Pedagógicas das Escolas
Médicas Portuguesas: Uma Análise Nacional Sobre a
Satisfação Estudantil, Rácios Estudante-Tutor e Número
de Admissões
1. Grupo de Trabalho em Educação Médica. Associação Nacional de Estudantes de Medicina. Portugal. Autor correspondente: Pedro Grilo Diogo. [email protected]
Recebido: 03 de agosto de 2015 - Aceite: 28 de dezembro de 2015 | Copyright © Ordem dos Médicos 2016
Pedro Grilo DIOGO1, Afonso MOREIRA1, Ana COIMBRA1, Ana SILVA1, Artur MARTINS1, Carlos MENDONÇA1,
Constança CARVALHO1, Gonçalo ALMEIDA1, Hugo ALMEIDA1, Inês MOREIRA1, Marta RODRIGUES1, Miguel GOULÃO1,
Rafael VASCONCELOS1, Rodrigo VICENTE1, Sara MAGANO1
Acta Med Port 2016 May;29(5):301-309 ▪ http://dx.doi.org/10.20344/amp.6795
RESUMO
Introdução: Os ambientes de ensino clínico e não clínico, bem como as condições de avaliação e estudo, influenciam a satisfação estudantil com as Escolas Médicas. Os rácios estudante-tutor podem ter impacto na perceção sobre o ensino em meio clínico. Este estudo tem como objetivo analisar a satisfação dos estudantes de Medicina e os rácios estudante-tutor em relação com o número de admissões das Escolas Médicas.
Material e Métodos: Foi criado um questionário sobre os ambientes de aprendizagem, avaliação e estudo em oito Escolas Médicas, distribuído a 2037 estudantes. Calculou-se o alfa de Cronbach (consistência interna) e executou-se uma análise de componentes principais.
Resultados: Condições de avaliação obtiveram os melhores resultados de satisfação, enquanto o ensino em meio clínico revelou as menores pontuações. O rácio estudante-tutor nacional em disciplinas clínicas (7,53) traduz diferenças significativas entre Escolas.
Instituições com maior número de admissões evidenciam resultados inferiores de satisfação estudantil (r= -0,756; p < 0,05), com
redução progressiva ao longo do curso. Elevados rácios estão correlacionados com baixa satisfação com o ensino em meio clínico (r= -0,826; p < 0,05).
Discussão: O ensino em meio clínico evidencia menor satisfação estudantil, traduzindo os elevados rácios em disciplinas clínicas. Dependendo do número de admissões, existem diferenças significativas entre Escolas. A qualidade das estratégias de ensino-apren-dizagem e articulação hospitalar podem igualmente ser variáveis importantes.
Conclusão: As Escolas com maior número de admissões podem ser mais suscetíveis a baixos resultados de satisfação estudantil. Elevados rácios estudante-tutor em disciplinas clínicas podem reduzir a qualidade do ensino em meio clínico e inibir a aquisição de competências.
Palavras-chave: Alunos de Medicina; Educação Médica; Escolas Médicas; Portugal; Programas de Autoavaliação.
ABSTRACT
Introduction: Experiences of clinical and nonclinical learning environments, as well as assessment and study environments influence student satisfaction with their medical schools. Student-tutor ratios may impact on their perception of clinical learning environments. The aim of this study was to analyze medical students’ satisfaction and student-tutor ratios in relation to medical schools’ number of admissions.
Material and Methods: A questionnaire was created, regarding learning, assessment and study environments in eight medical schools. 2037 students participated in this cross-sectional study. Cronbach’s alpha (internal consistency) was calculated and principal component analysis was conducted. Pearson correlations and multiple comparisons were analyzed.
Results: Assessment environments showed the highest satisfaction scores and clinical learning environments the lowest scores. The national student-tutor ratio in clinical rotations is 7.53; there are significant differences among schools. Institutions with higher number
of admissions showed the lowest scores of overall student satisfaction (r = -0.756; p < 0.05), which decreased with progression in the
medical course. High student-tutor ratios are strongly correlated with low levels of satisfaction regarding clinical learning environments (r = -0.826; p < 0.05).
Discussion: Clinical learning environments show the lowest satisfaction scores, which may expose the effect of high ratios in clinical rotations. Depending on the number of admissions, significant differences between medical schools were found. Quality of teaching-learning strategies and articulation with hospitals might also be important variables.
Conclusion: Medical schools with more admissions might be more susceptible to lower scores of student satisfaction. High student-tutor ratios in clinical rotations may reduce the quality of learning experiences and inhibit the acquisition of competences.
ARTIGO ORIGINAL
AMP
STUDENT
INTRODUCTION
Human resource wise management in healthcare is cru-cial in international organisations, aimed to medical educa-tion - in number of professionals as in quality – and adapted to the needs of the population.1,2 The assessment of the
es-timated physician recruitment regional and national needs is required,3 as well as the assessment of medical school’s
training capacity, depending on adequacy to learning con-ditions, affected by annual student intake and by school’s financial, human and material resources (teaching staff, teaching hospitals, infrastructures, teaching materials).4
Formal student questionnaires are widely used for the assessment of learning conditions in University. Student feedback allows for important information aimed to improve training quality.5
Student-to-tutor ratios (STRs) are teaching quality indicators: low STRs are suggestive of positive learning conditions, even though they only represent part of the educational situation, depending on teaching-learning methods and on learning environment.6 In fact, medical
schools should adapt student intake to training capacity and to STR as quality indicators.4
Student intake in Portuguese medical schools has greatly increased since 1990; in relative terms, Portugal is the country within the OECD (Organisation for Economic Cooperation and Development) with the highest increase in medical student intake.7 Considering the international
recognition regarding the relevance of an integrated and sustainable planning of medical education, knowing and studying the Portuguese reality through the analysis of the correlation between training capacity of medical schools and their annual student intake.
Our study aimed to analyse two indicators of training capacity of Portuguese medical schools, namely student’s satisfaction as regards different components of the educational environment and STRs in clinical learning
environment, as well as the correlation with each school’s student intake. This was divided in two components: 1) evaluation of school’s learning conditions using satisfaction feedback questionnaires regarding school’s learning conditions and 2) evaluation of learning conditions for clinical learning environment by obtaining schools’ STR.
MATERIAL AND METHODS
Questionnaires on training conditions in Portuguese medical schools
a) Description
Questionnaires on learning conditions in medical schools involving six groups of items, namely: Evaluation Conditions, Study Environment, Theoretical Classes/ Seminars, Theoretical/Practical Classes/Case Reports/ Problem Solving/Tutorials, Practical/Laboratory Classes and Clinical Learning Environment. Each group of items included 4 to 6 paragraphs with 6-point Likert scaled response (1: completely dissatisfied; 6: fully satisfied), including “No opinion” option.
Questionnaires were applied to medical students attending each Portuguese medical school, held at the school’s facilities, during theoretical classes, over 2011/2012 (2012) and 2013/2014 (2013) academic years. In 2012, questionnaires were applied in paper format in January and in February. In 2013, these were applied both in paper and in electronic format (available through Facebook groups and mailing lists) in October and early November.
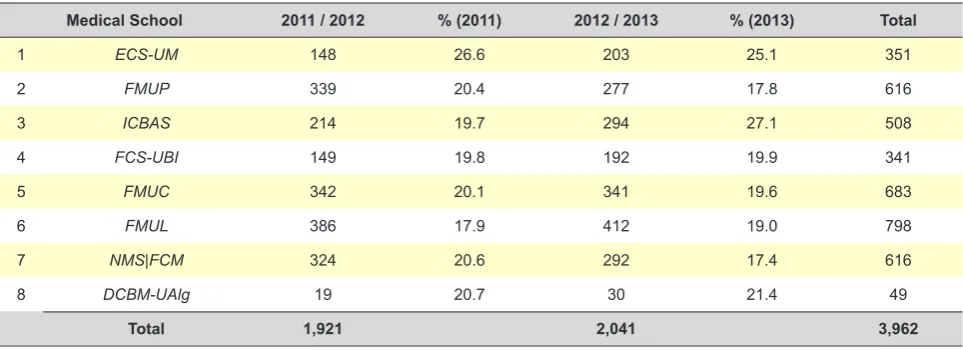
Questionnaires were applied to a random sample of approximately 20% of the total number of students attending each year of study (Table 1). All questionnaires were completed by students and accounted for statistical analysis. When comparing both groups of questionnaires (2012 and 2013 academic years), chi-square test showed an identical distribution of the number of questionnaires per
Table 1 - Number and percentage of questionnaires in relation to the total number of students per year and medical school
Medical School 2011 / 2012 % (2011) 2012 / 2013 % (2013) Total
1 ECS-UM 148 26.6 203 25.1 351
2 FMUP 339 20.4 277 17.8 616
3 ICBAS 214 19.7 294 27.1 508
4 FCS-UBI 149 19.8 192 19.9 341
5 FMUC 342 20.1 341 19.6 683
6 FMUL 386 17.9 412 19.0 798
7 NMS|FCM 324 20.6 292 17.4 616
ARTIGO ORIGINAL
AMP
STUDENT
year of study and per medical school (p > 0.05). b) Data analysis
Questionnaires have been optically read at the Centro
de Educação Médica of the Faculdade de Medicina da
Universidade do Porto (FMUP) using Fujitsu fi-5120c®
equipment. Data were transferred to IBM SPSS Statistics 19® and Microsoft Office Excel 2010® software databases.
Questionnaire reliability was evaluated by internal consistency using Cronbach’s alpha. Kaiser-Meyer-Olkin measure of sampling adequacy and Bartlett’s test of sphericity were used in principal component analysis and varimax rotation was used for the identification of the number of components suggested by data and which items belonged to each component. A correlation >0.70 between the items and principal components was considered as strong, 0.30-0.70 as moderate and <0.30 as weak. All the items showed at least a satisfactory correlation and therefore were included in principal component analysis. Items were aggregated into four components: C1 – non-clinical learning environment, C2 – clinical learning environment, C3 – evaluation conditions and C4 – training conditions. The average score of students in aggregated items was used for each school’s score in each component. Only the responses of students attending the third year or beyond were considered for the average score in C2 component.
STRs of Portuguese medical schools
STRs show the quotient between the number of students and the number of tutors in a certain Curricular Unit (CU). With the aim of simplification, STRs were represented in our study as the quotients student/tutor (for instance, five students assigned to each tutor means a ratio of five). STRs were obtained for all Portuguese medical schools (except for the Departamento de Ciências Biomédicas e
Medicina da Universidade do Algarve (DCBM-UAlg) where
data collection was not possible) regarding all CUs with a clinical component and with a tutorial system (third year and beyond), from April to December 2014. Whenever a tutor is assigned to each group of students during most of the academic year and responsible for ensuring clinical training as well as for evaluating students at his/her charge, a CU with tutorial system was considered. Data collection methods according to each Medical School were used for STR calculation, namely: 1) Data request to Academic Services/Medical Education Departments; 2) Official documents analysis, made available to students by each CU’s Chair; 3) STR data request to students from local Associations, Medical School Councils or students from each class/group/rotation. STRs were sent to Teaching Councils of medical schools for approval and this was assigned by Teaching Councils of the Escola de Ciências Médicas da Universidade do Minho (ECS-UM), Faculdade de Ciências da Saúde da Universidade da Beira Interior
(FCS-UBI) and FMUP.
RESULTS
a. Questionnaires regarding learning conditions of Portuguese medical schools
Overall analysis
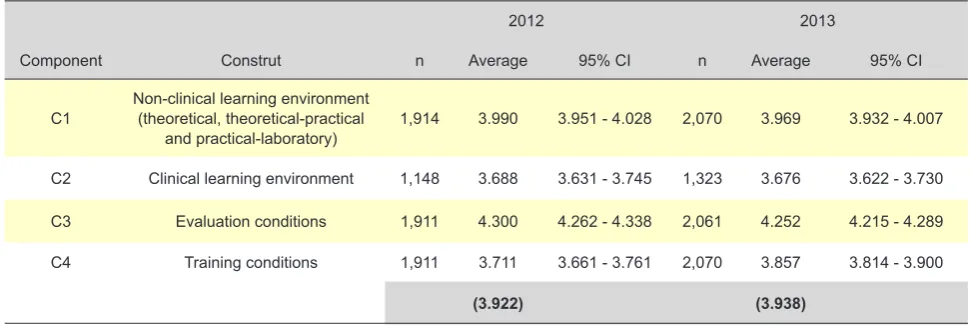
In overall analysis of 2012 and 2013 (Table 2), evaluation conditions (C3 component) obtained the highest score (4.300 and 4.252, respectively), followed by non-clinical learning environment (C1) (3.990 and 3.969), training conditions (C4) (3.711 and 3.857) and finally clinical learning environment (C2) (3.688 and 3.676). An average 3.922 (in 2012) and 3.938 (in 2013) overall score of learning conditions in medical schools was obtained.
Non-clinical learning environment
Average scores above 4.50 in C1 component were obtained by three medical schools (DCBM-UAlg, FCS-UBI Table 2 – Number of responses, annual average (in 2012 and 2013) and global average per component (C1 to C4) and construct
2012 2013
Component Construt n Average 95% CI n Average 95% CI
C1 Non-clinical learning environment (theoretical, theoretical-practical
and practical-laboratory) 1,914 3.990 3.951 - 4.028 2,070 3.969 3.932 - 4.007
C2 Clinical learning environment 1,148 3.688 3.631 - 3.745 1,323 3.676 3.622 - 3.730
C3 Evaluation conditions 1,911 4.300 4.262 - 4.338 2,061 4.252 4.215 - 4.289
C4 Training conditions 1,911 3.711 3.661 - 3.761 2,070 3.857 3.814 - 3.900
ARTIGO ORIGINAL
AMP
STUDENT
and ECS-UM), showing statistically significant differences
when compared to the remaining schools on both years (p < 0.05). FMUP, Instituto de Ciências Biomédicas Abel Salazar (ICBAS), Faculdade de Medicina da Universidade
de Lisboa (FMUL) and Nova Medical School | Faculdade de
Ciências Médicas (NMS|FCM) have obtained lower scores
(< 4.00), while the Faculdade de Medicina da Universidade
de Coimbra (FMUC) showed the worst score in both years
(3.657 in 2012; 3.281 in 2013 – the 2013 difference was statistically significant, when compared to the other medical schools).
Clinical learning environment
In overall analysis of C2 component (3rd-6th year – 2012
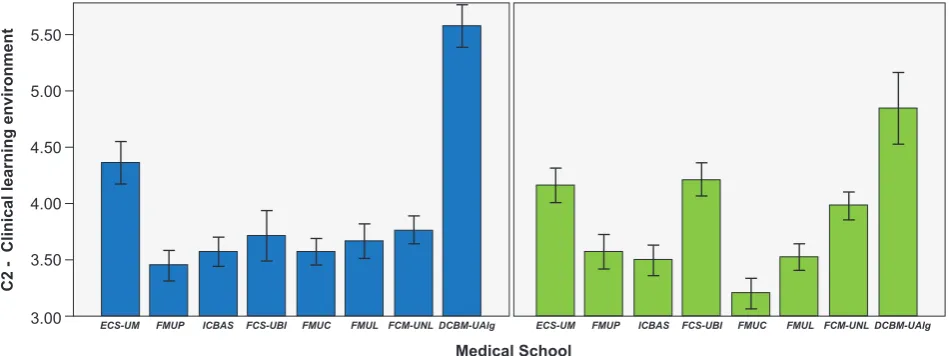
and 2013), DCBM-UAlg showed the highest average scores, followed by ECS-UM, FCS-UBI and NMS|FCM (in 2013), with statistically significant differences when compared to the remaining schools (p < 0.05, Fig. 1). FMUP showed the lowest score in 2012 (3.443) and FMUC the lowest score in 2013 (3.194), with a statistically significant difference when compared to the remaining medical schools.
Evaluation conditions
In overall analysis of C3 component (2012 and 2013), three medical schools (DCBM-UAlg, FCS-UBI and ECS-UM) showed average scores above 4.50, with statistically significant differences when compared to the remaining schools on both years (except DCBM-UAlg, in 2013) (p
< 0.05). The remaining schools, did not show statistically significant differences between them in any of the years, with similar average scores ranging between 3.90 and 4.20.
Training conditions
In overall analysis of C4 component (2012 and 2013), three medical schools (ECS-UM, FCS-UBI and
DCBM-UAlg) showed average scores above 4.50, with statistically significant differences when compared to the remaining schools on both years (except DCBM-UAlg, in 2013) (p < 0.05), followed by FMUP (4.097), with a significant difference when compared to the remaining schools, namely
FMUL, NMS|FCM, ICBAS and finally FMUC, having shown
the lowest score that year (3.517). NMS|FCM showed the lowest average score in 2012 (2.892).
Overall student satisfaction per medical school
In overall student satisfaction regarding 2013, three medical schools [DCBM-UAlg (4.633), ECS-UM (4.528)
and FCS-UBI (4.515)] obtained average scores above 4.50,
without statistically significant differences between them. This group was different (p < 0.05) from another group of medical schools (NMS|FCM, FMUP, ICBAS and FMUL) which, in turn, showed statistically significant differences when compared to FMUC, with the lowest score (3.511) (Fig. 2).
Component progression over the years
When analysing the progression of the four components throughout the Medicine course, the presence of (i) significant differences between medical schools (p < 0.05), (ii) significant differences between curriculum years (p <
0.05, except C2 component) and (iii) significant differences between schools as regards the pattern of progression of the components throughout the curriculum years (p <
0.05) were found in 2012 and 2013. An overall declining trend was found in average scores on each component throughout the curriculum years, from the first to the sixth year. Nevertheless, ECS-UM, FCS-UBI and DCBM-UAlg
showed a similar score over the curriculum years in C1, C3 and C4 components, unlike the declining trend shown by the remaining schools.
Figure 1 – Average scores in C2 component (2012 – in blue; 2013 – in green) per medical school; 95% confidence intervals. 3.00
3.50 4.00 4.50 5.00 5.50
ECS-UM FMUP ICBAS FCS-UBI FMUC FMUL FCM-UNLDCBM-UAlg ECS-UM FMUP ICBAS FCS-UBI FMUC FMUL FCM-UNLDCBM-UAlg Medical School
ARTIGO ORIGINAL
AMP
STUDENT
Overall student satisfaction per medical school and regarding student intake
A statistically significant negative correlation (p < 0.05) was found between average overall student satisfaction scores obtained by medical schools and student intakes in 2013 (Pearson’s coefficient: -0.756) (Fig. 3). Accordingly, schools with higher student intake tended to show lower overall student satisfaction scores. When dividing the chart into four quadrants, we found that: 1) DCBM-UAlg,
ECS-UM and FCS-UBI were located in the upper left quadrant,
corresponding to schools with lower intake and higher overall student satisfaction; 2) ICBAS was located in the transition between the upper and the lower left quadrants, with lower intake and lower overall student satisfaction when compared to national average; 3) NMS|FCM and
FMUP were located in the upper right quadrant, with higher intake, even though showing an overall student satisfaction over the average; 4) FMUC and FMUL (located in the transition between quadrants) were located in the lower right quadrant, with higher intake and an overall student satisfaction below the national average.
STRs of Portuguese medical schools
a) STRs per medical school
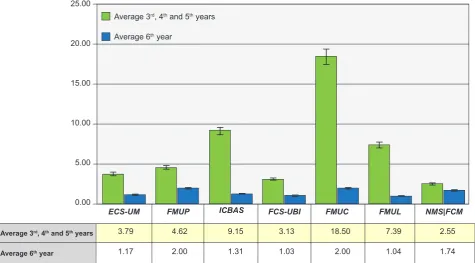
An average 7.53 student-weighted STR was found for
3rd, 4th and 5th curriculum years. Lower ratios were found for
6th year (ranging from 1.03 (FCS-UBI) to 2.00 (FMUP and
FMUC) (Fig. 4). Significant differences were found between medical schools (p < 0.05) as well as between CUs (p < 0.05) of 3rd, 4th and 5th curriculum years. We found that 57.5% of
the differences in STRs are explained by actual differences between schools. In addition, 11.9% of ratio variation are explained by specific differences between CUs. Finally,
30.7% of the variation are explained by unspecific factors, unrelated to differences between schools or between CUs.
b. Relationship between average scores in C2 component and STRs per medical school
A statistically significant negative correlation (p < 0.05) between the average score in C2 component (clinical learning environment) and the average STR of each school
in 3rd, 4th and 5th curriculum years (Pearson’s coefficient:
-0.826) (Fig. 5). Accordingly, schools with higher STRs showed lower student satisfaction scores regarding clinical learning environment. When dividing the chart into four quadrants, we found that: 1) ECS-UM, FCS-UBI
and NMS|FCM were located in the upper left quadrant,
corresponding to schools with lower STRs and higher student satisfaction; 2) FMUP and FMUL (in transition) were located in the lower left quadrant, showing a STR below the average with lower student satisfaction; 3) ICBAS and
FMUC were located in the lower right quadrant, with high STR and student satisfaction below the average.
c. Relationship between student intake and STRs per medical school
The statistical analysis of the correlation between STRs of each medical school in 3rd, 4th and 5th curriculum
years and student intake in 2013/2014 did not show any statistically significant correlation (p > 0.05). When dividing the chart into four quadrants, we found that: 1) ECS-UM
and FCS-UBI were located in the lower left quadrant,
corresponding to schools with lower STR and lower intake;
2) ICBAS was located in the upper left quadrant, showing
lower intake although with higher STR; 3) NMS|FCM,
FMUP and FMUL (in transition) were located in the lower
right quadrant, showing higher intake although with STR
Medical School
Figura 2 – Average overall satisfaction scores (with standard deviation) per medical school and intake-weighted average overall score for
all the schools; 95% confidence intervals were considered. ANOVA’s test showed differences between schools (p < 0.001). Numbers in
superscript correspond to the specific differences between schools (Bonferroni test). 3.00
3.50 4.00 4.50 5.00
ECS-UM FMUP ICBAS FCS-UBI FMUC FMUL FCM-UNL DCBM-UAlg
Overall satisfaction
School Average Standard deviation
1 ECS-UM 4.528 0.871 2,3,5,6,7
2 FMUP 4.104 0.958 1,3,4,8
3 ICBAS 3.916 0.861 1,2,4,8
4 FCS-UBI 4.515 0.831 2,3,5,6,7
5 FMUC 3.511 0.868 1,2,3,4,6,7,8
6 FMUL 3.889 0.834 1,4,5,7,8
7 NMS|FCM 4.109 0.818 1,4,5,6,8 8 DCBM-UAlg 4.633 0.964 2,3,5,6,7
ARTIGO ORIGINAL
AMP
STUDENT
below the average; 4) FMUC was located in the upper right quadrant, with higher intake and STR above the average.
DISCUSSION
This study aimed to characterise learning conditions in Portuguese medical schools, involving four components (non-clinical and clinical learning environment, evaluation and training conditions) in addition to the identification of STRs in clinical CUs. This is particularly relevant in the
Portuguese reality, due to the increased student intake over the last twenty years. In fact, a 397% increased intake in medical schools in Portugal has been found, when compared to 1995, placing Portugal with the highest percentage increase in the number of graduate students in OECD.
Overall, 1,885 students were admitted to medical schools in all access schemes in 2013/2014. An intake above the national average (226 students) was found
in FMUL, FMUC, FMUP and NMS|FCM and below that
average in ICBAS, ECS-UM, FCS-UBI and DCBM-UAlg.
Student Satisfaction
Satisfaction questionnaires implemented in 2012 and 2013 allowed for the characterisation of learning conditions in medical schools from the student’s perspective, due to a remarkable sample of each curriculum year, involving a total of 3,958 completed questionnaires. STRs allowed for the analysis of the sensitive component of clinical learning environment and obtaining conclusions on this area with crucial skill acquisition in medical training.
The highest student satisfaction was found in C3 component (evaluation conditions), while highest dissatisfaction was found in C2 component (clinical learning environment). Overall, three different realities may be found in Portuguese medical training: (i) schools with lower intake
(ECS-UM, FCS-UBI and DCBM-Ualg) showed overall the
best scores in the four components, while those with higher
Figure 3 – Interaction between average score of overall satisfac-tion and student intake in 2013/2014, per medical school. Vertical dashed line intersects x-axis at the average intake of medical scho-ols in Portugal (226) and horizontal dashed line intersects y-axis at the intake-weighted average score of overall satisfaction of medical schools (3.873).
3.60 3.80 4.00 4.20 4.40 4.60 4.80
0 100 200 300 400
Student intake (2013/2014)
Overall satisfaction
ECS-UM
FMUP
ICBAS FCS-UBI
FMUC
FMUL NMS|FCM
DCBM-UAlg
Figure 4 – Average STRs for 3rd, 4th and 5th curriculum years (shown in green) and 6th curriculum year (in blue) per medical school; 95% 0.00
10.00
5.00 20.00
15.00 25.00
ECS-UM
Average 3rd, 4th and 5th years
Average 6th year
FMUP ICBAS FCS-UBI FMUC FMUL NMS|FCM
Average 3rd, 4th and 5th years
Average 6th year
3.79
1.17
4.62
2.00
9.15
1.31
3.13
1.03
18.50
2.00
7.39
1.04
2.55
ARTIGO ORIGINAL
AMP
STUDENT
intake, namely FMUP, FMUC, ICBAS, FMUC, FMUL and
NMS|FCM showed lower scores. FMUC tended to show the
lowest satisfaction scores as regards learning conditions. It should be mentioned that DCBM-UAlg showed a different training method from the remaining medical schools, adapted to already-graduated students and these characteristics should therefore be taken into consideration. Differences between medical schools reflect the effect of multiple variables. Among these, annual intake is a relevant determinant of overall student satisfaction. Schools with higher intake have shown lower satisfaction with medical training, even though there are schools with above
(NMS|FCM and FMUP) or below (ICBAS) the national
average intake and having obtained student satisfaction above and below what was expected according to intake, respectively, showing the effect of non-assessed variables. These results showed that some schools have the capacity of adapting their learning conditions to their annual intake, eventually through the optimization of academic time layout, organizing clinical learning environment and quality or quantity of teaching staff, suggesting that schools have adaptability mechanisms to higher intake; in addition, there are schools with higher (ICBAS) or lower (NMS|FCM e FMUP) than expected STRs according to intake. In this case, the abovementioned mechanisms also depend on the articulation between schools and affiliated hospitals. Differences between schools also depend on the effect of specific variables per each component of analysis. In C2 component (clinical learning environment), where lowest scores of student satisfaction were found, there is an interaction between variables such as student-tutor interaction (depending on the quality of supervision provided by teaching physicians and on STR (see below)) and the quality of clinical learning experiences (which in turn depends on training skills of hospital departments, including wards, outpatient clinics, Emergency and operating rooms). In fact, dissatisfaction with clinical learning environment reflects a vulnerability in training capacity of medical schools and affiliated hospitals regarding this particular area. High student intake has an expectedly higher effect on clinical when compared to non-clinical learning environment, as it represents a challenge to training layout organization as well as hospital personalized training, mainly affecting schools originally designed for lower student intake, as opposed to those more recently created. This allows for the interpretation of lower student overall satisfaction in medical schools with higher intake.
The analysis of all the components showed that learning conditions deteriorate with curriculum year progression, which may be due to higher student dissatisfaction with
Figure 5 – Interaction between the average score in C2
compo-nent and average STRs for 3rd, 4th and 5th curriculum years. Vertical
dashed line intersects x-axis at the intake-weighted average STR of medical schools in Portugal and horizontal dashed line intersects y-axis at the intake-weighted average score of C2 component in medical schools.
3.00 3.20 3.40 3.60 3.80 4.00 4.20
0.00 5.00 10.00 15.00 20.00
Average student-tutor ratio (3rd, 4th and 5th years)
Clinical learning environment (C2)
ECS-UM
FMUP
ICBAS FCS-UBI
FMUC FMUL
NMS|FCM
subsequent increase in clinical learning environment activities and higher awareness as regards learning conditions of schools with subsequent demand regarding training and support infrastructures. However, among medical schools, those more recently created (
DCBM-UAlg, FCS-UBI and ECS-UM) do not show any decrease
in perceived learning conditions over the curriculum years, possibly due to an educational environment with more stable learning conditions and better adapted to student intake.
Student-tutor ratios
ARTIGO ORIGINAL
AMP
STUDENT
Statistically significant differences between medical schools and between CUs within the same school were found. When comparing the different institutions, we found that FMUC showed the highest average STR (18.50) in
3rd, 4th and 5th curriculum years, while ICBAS showed the
second highest average ratio (9.15), followed by FMUL
(7.39), FMUP (4.62), ECS-UM (3.79), FCS-UBI (3.13) and
NMS|FCM (2.55). STRs ranged from 1.03 (FCS-UBI) and
2.00 (FMUP and FMUC) in 6th curriculum year, without
significant differences between schools.
The analysis of STRs involved a set of relevant data with a contribution to either over or undervaluation of ratios. In 6th curriculum year, depending on the medical school
and the CU, students are sometimes included in medical teams (with the tutor and other registrars and junior interns), which may induce an STR overvaluation in specific CUs. However, two other factors led to STR undervaluation: 1) on one side, only students attending a CU sharing the same tutor were considered for the calculation of STRs, while postgraduate training is also considered in undergraduate training hospitals and students attending other curriculum years or even junior interns or registrars sometimes attending the same training environment and allocated to the same tutor are not considered in STRs; 2) on the other hand, affiliated teachers and voluntary teachers (non-affiliated to medical schools) are considered in STRs calculation. In addition, a high number of students per tutor may convert patient-contact classes into theoretical-practical classes with no patient-contact or reduce the time allocated to patient-contact. It should be mentioned that affiliation with other hospitals and healthcare centres is an important mechanism used by schools (with variable impact depending on the school) to fight against high STRs and to provide varied training experiences to students.
The analysis of the relation between average scores of medical schools in C2 component (clinical learning environment) and STRs (in 3rd, 4th and 5th years) showed
that schools with higher ratios obtained lower student satisfaction. Therefore, STRs are an important variable for student evaluation on clinical learning environment. In fact, Schools with high student satisfaction do not show a STR above national average, while a STR below the national average does not necessarily lead to satisfaction regarding clinical training (as shown in FMUP – Fig. 5), suggesting the relevance of other variables such as the quality of supervision provided by tutors.
CONCLUSIONS
Student satisfaction and STRs have a role as quality indicators for medical training nationwide. This
pioneer Portuguese study allowed for the identification of significant differences between different components of learning conditions: student dissatisfaction regarding clinical learning environment was found in the study, when comparing to non-clinical learning environment, evaluation and training conditions. In addition, disparities between student satisfaction and STR were found between medical schools and curricular units: schools with higher student intake obtained lower student satisfaction, even though the institutions showed different response capacity and adaptability according to intake. An average 7.53 STR was found nationwide, with statistically significant differences between schools (ranging from 18.5 in FMUC to 2.55
in NMS|FCM). A direct correlation was found between
STR and lower student satisfaction regarding clinical training. Low student satisfaction regarding clinical training associated to high STRs in some medical schools suggests a disrupted quality in clinical learning environment. Further efforts should be made aimed to in-depth analysis of the adequacy of learning conditions in medical schools, any significant disparities between institutions and the quality of medical training in Portugal.
ACKNOWLEDGMENTS
The authors wish to acknowledge the elements of the
Grupo de Trabalho em Educação Médica for 2011, 2012
and 2013,to those medical students who participated in the study, to the Medical Student Associations and local student groups and to the medical schools that supported the study. To Patrício Costa and Milton Severo for their indispensable collaboration.
HUMAN AND ANIMAL PROTECTION
The authors declare that the followed procedures were according to regulations established by the Ethics and Clinical Research Committee and according to the Helsinki Declaration of the World Medical Association.
DATA CONFIDENTIALITY
The authors declare that they have followed the protocols of their work centre on the publication of patient data.
CONFLICTS OF INTEREST
The authors declare that there were no conflicts of interest in writing this manuscript.
FINANCIAL SUPPORT
ARTIGO ORIGINAL
AMP
STUDENT
REFERENCES
1. Crisp N, Gawanas B, Sharp I; Task force for scaling up education and training for health workers. Training the health workforce: scaling up, saving lives. Lancet. 2008;371:689-91.
2. World Health Organization. Transforming and scaling up health professionals‘ education and training: World Health Organization Guidelines 2013. Geneva: WHO; 2013.
3. Review of Medical and Dental School Intakes in England. The health and education national strategic exchange (HENSE). Leeds: HENSE; 2012.
4. Basic Medical Education WFME Global Standards for Quality
Improvement, the 2012 revision. Copenhagen: World Federation for Medical Education; 2012.
5. Richardson JTE. Instruments for obtaining student feedback: a review of the literature. Assess Eval Higher Educ. 2005;30:387-415.
6. Higher Education Statistics Agency. Technical definitions: student:staff ratios (SSR) [consultado 2014 Nov 12]. Disponível em: https://www. hesa.ac.uk/component/content/article?id=2937.