DEVELOPMENT OF HPLC METHOD FOR DETERMINATION
OF TAMSULOSIN USING QUALITY BY DESIGN (QBD)
APPROACH
Jaiprakash N. Sangshetti,
[a]*Dhanashree K. Chivte,
[a]Mohammed Imran
Anees,
[a]Mallinath Langade,
[b]Faraz Khan,
[a]Rana Zainuddin,
[a]Zahid Zaheer,
[a]Paresh Mahaparale
[c]Keywords:Tamsulosin; QbD approach; RP-HPLC method; Box-Behnken model; ICH guidelines.
An HPLC method for Tamsulosin was developed by using a quality by design (QbD) novel concept. QbD has gained importance in recent times due to regulatory requirements in industrial application. Chromatographic separation of Tamsulosin was carried out by using C8
column, and mobile phase used was methanol and distilled water (40:60 v/v) for proper separation process. Separation by using water as a solvent is beneficial as it is cost effective process and industrially applicable. In the development of the HPLC method, factors like injection volume, conc. of methanol, the column vent temperature is critical in maintaining. Hence the Box-Behnken optimization model was applied for the main, interaction and quadratic effects of these three factors on the selected response. The effect of these parameters was studied on the tailing factor (resolution). Results were analysed during a surface diagram. Verification of the software-generated result was done by taking six replicates of the run. Finally, the method was validated according to ICH guidelines.
* Corresponding Authors
E-Mail: [email protected]
[a] Y. B.Chavan College of Pharmacy, Dr. Rafiq Zakaria Campus, Rauza Baugh, Aurangabad-(MS) India. [b] Jawahar Arts, Science and Commerce College, Anadur,
Osmanabad (MS) India.
[c] Government College of Pharmacy, Aurangabad (MS) India.
INTRODUCTION
Tamsulosin (5-[(2R)-2-{[2-(2-ethoxyphenoxy)ethyl]-amino}propyl]-2-methoxybenzene-1-sulfonamide) acts as adrenergic α-antagonists and is maximally used to treat symptomatic benign prostatic hyperplasia (BPH), which will help with the passage of kidney stones, and also for urinary retention. Tamsulosin acts as a selective antagonist at α1A
and α1B-adrenoceptors in the prostate, prostatic capsule,
prostatic urethra, and bladder neck. The three discrete α1
-adrenoceptor subtypes such as α1A, α1B and α1D were also
identified and their distribution differs between human organs and other tissue. It was noted that there are approximately 70% of the α1-receptors in the human
prostate, which were of the α1A subtype. The blockage in
these types of receptors will cause relaxation of smooth muscles in the bladder neck and prostate, and which thus decreases urinary outflow resistance in males. 1
To the best of our knowledge HPLC method using a simple UV detector by applying the QbD approach is not available. As per International Conference on Harmonization (ICH) guidance on pharmaceutical development, "QbD is a systematic approach to development that begins with predefined objectives and emphasizes product and process control and which is dependent on quality risk management and its related science.2 QbD has gained special attention in current times
due to regulatory requirements in the research work.
US-FDA has accelerated QbD drive to encourage the risk-based approach and thorough understanding of processes, which is ultimately going to help the regulatory bodies in the review process.
The basic foundation behind QbD is that quality is 'designed' into the process at the onset to the establishment of the method by a thorough understanding of the effect of the various system parameters are studied. Effects are analyzed for their influence on the quality of the product that is desired. This is nothing but ultimately to establish the design space for the method. Design space is defined as a "multidimensional combination and interaction of input variables that have been demonstrated to assure quality."3Some of the methods have been reported for the
development of the HPLC method for Tamsulosin.4-14
MATERIALS AND METHODS
Tamsulosin standard active pharmaceutical ingredient (API) was procured from Hetero Drugs Limited (Hyderabad) and solvents were supplied from Dodal Enterprises and Badar chemicals, Aurangabad. Distilled HPLC grade water was prepared in the quality assurance lab of Y. B. Chavan College of Pharmacy, Aurangabad. The instrument used for HPLC analysis work was performed by using a Shimadzu LC20 model with C8 column of
4.6×150mm; 5µmplates
Tamsulosin sample preparation
Analytical targetprofile
Quality by design approach acts as systematic approach particularly used for research in the product, process design and its development. Hence its preliminary work deals with the determination of goal or method intent. This emphasis is given on the product and process understanding.15 Here
method intent was to develop the RP-HPLC method of Tamsulosin, which is robust, accurate, precise and USP tailing factor less than 2, and analysis time, i.e., less than 10 min as per QbD norms a robust method should be developed with the help of visualized a design space.
Instrument qualification
The protocols and analytical procedures used in the pharmaceutical analysis are subjected to highly formalized validation procedures to demonstrate that they are suitable for the intended use or not. As a consequence, prior to method validation, it is essential to get assure that the equipment or analytical test system itself is adequately designed, maintained, calibrated as well as tested. These tests are called as analytical instrument qualification (AQI) which involves following qualification parameters such as
Design qualification Installation qualification Operational qualification Performance qualification
In the HPLC system, it involves equipment, design qualification. Installation qualification establishes that the instrument is received as designed and that it is properly installed. As far as practical experimentation is considered, the only operational qualification and performance qualification combine parameters were done, as reported by L. K. Kaminskiet al.16
The precision of injection volume
It was determined by comparing the peak area received with fixed 20 µL injections and calibrated dosage loop tolerance limit set was <1 % RSD.
Injection carryover
Injection carryover was determined by running a new test directly after an analysis process and measuring possible absorption. In this, there should not be any peak from the previous analysis.
Flow rate accuracy
It was determined by measuring the volumetric flow rate of mobile phase (methanol-water 40:60 proportion) through the column over a previously set period of time such as 1.0 mL min-1 for 10 min, 2.0 mL min-1 for 5 min, 2.5 mL min-1
for 10 min respectively and in this the relative standard deviation (RSD) should be less than 1 %.
Flow rate precision
A flow rate precision was determined by measuring the
Wavelength accuracy
It was done by scanning the compound with known specific maxima. The tolerance limit is specific maxima ±2 nm.
The linearity of the detector
The linearity of the detector was determined by injecting an increasing concentration of the substance and the tolerance limit set was R2≥ 0.999.
Risk assessment
Risk assessment deals with increase quality of method or its process management system. It also determines the various effect of its input variable on the applied method and its process. From risk assessment, one can identify with critical attributes that are going to affect the quality of the final product. A risk assessment parameter is applicable for effective communication between FDA, industries, research/development, manufacturing and multiple manufacturing sites within the company. Various tools for risk assessment are as given below:17
Ishikawa or fishbone diagram,
Failure model effect analysis(FMEA),
Pareto analysis.
Method design
i) Screening Method: The screening was doneby Placket-Burman Design using Design Expert 11 software.
Five factors were selected which were as follows:
1. Flow rate.
2. Injection volume.
3. Column oven temperature.
4. The concentration of methanol.
5. Detection wavelength.
The total runs obtained were 12 in number, the response for the design was tailing factor studied for the drug. The results were then put in the design to optimize the method further and chromatographic factors and response variable and Plackett-Burman design were given in Tables 1 and 2.
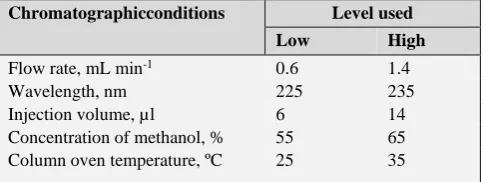
Table 1.Chromatographicfactors and response variable forPlackett-Burmann experimental design.
Chromatographicconditions Level used
Low High
Flow rate, mL min-1 0.6 1.4
Table 2.Plackett-Burman experimental design for Tamsulosin
Run Factor 1 Factor 2 Factor 3 Factor 4 Factor 5 Response
A: Flow rate, ml min-1
B: Detector wavelength, nm
C: Injection volume, µL
D: Methanol concentration, %
E: Column
oven temperature, ºC
Tailing factor
1 1.4 225 14 45 25 1.3
2 1.4 235 14 35 25 1.29
3 0.6 235 6 45 35 1.1
4 0.6 225 14 35 35 1.2
5 1.4 225 14 45 35 1.22
6 0.6 225 6 35 25 1.26
7 0.6 235 14 35 35 1.37
8 1.4 235 6 35 25 1.3
9 1.4 225 6 35 35 1.19
10 0.6 235 14 45 25 1.26
11 0.6 225 6 45 25 1.14
12 1.4 235 6 45 35 1.07
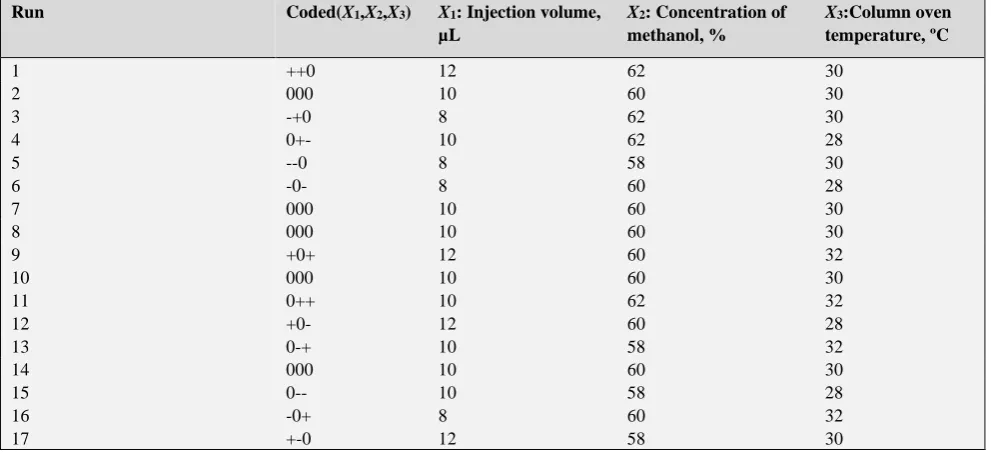
Optimization was done by response surface methodology and then by applying a three-level Box-Behnken design with three center points as shown in Table 3. Three factors selected were injection volume, the concentration of methanol, column oven temperature in the mobile phase. Evaluation of the mainfactor, the interaction and quadric effect on peak USP tailingfactorswere also been done. The flow rate selected for obtaining accurate results was 1ml per minute and detector wavelength was kept as 230nm as its effect on thetailingfactor was lesssignificant. Experiments were conducted by making triplicate injections (total 17 runs) of standard Tamsulosin solution as shown in Table 4. The averageof USP tailingfactor was analyzed using Design Expert 11 software.
The application of multivariate regression analysis output in a fitted full quadrate model for the average responses for peak USP tailing is accessible by the given equation
Y=ß0+ ß1X1+ ß2X2+ ß3X3+ ß11X12+ ß22X22+ ß33X32+
+ ß12X1X2+ ß13X1X3+ ß23X2X3
where
Y is the response,
ß0 is the arithmetic meanresponse,
ß1, ß2, ß3 are regressioncoefficientsofthefactorX1, X2, X3
respectively,
ß11, ß22, ß33 are squaredcoefficients and ß12, ß13, ß23 are
interaction coefficients.18
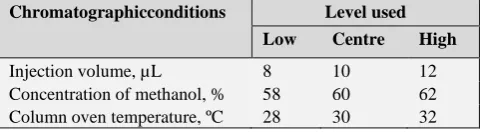
Table 3. Chromatographic factors and response variables for Box-Behnken experimental design
Chromatographicconditions Level used
Low Centre High
Injection volume, µL 8 10 12 Concentration of methanol, % 58 60 62 Column oven temperature, ºC 28 30 32
Critical quality attributes (CQA)
From the software-generated result, the critical factors which affect the tailing factor were determined. Factor such as flow rate, wavelength and methanol concentration in the mobile phase were found to be critical. The selection of the stationary phase was also a critical parameter. The nature of the drug is more retentive on C8 than C18.
Method validation
The chromatographic method, which was optimized and validated were according to the International Conference on Harmonization (ICH)19 Q2 (R1) guidelines for linearity,
range, precision and robustness. For the process of system suitability, a standard solution of 10µgmL-1 of Tamsulosin
was prepared by diluting and mixing the drug with a proportion of methanol: distilled water (60:40 v/v).
A set of six replicate injection of the system standard solution was also analysed before sample analysis. The acceptance criteria for Tamsulosin were less than 2% relative standard deviation (RSD) for peak area, retention time.
Linearity
As per ICH guidelines, the linearity of an analytical procedure is defined as is its ability (within in a given range) to obtain test results that are directly proportional to the concentration (amount) of analyte in the sample. Standard calibration curves were prepared with five different concentrations by making serial volume to volume dilution of stock solution with methanol: distilled water (60:40 v/v) over the range of 10, 20, 30, 40 and 50 µg mL-1.
Table4. Box-Behnken methodusedfor Tamsulosin optimization
Run Coded(X1,X2,X3) X1: Injection volume,
µL
X2: Concentration of
methanol, %
X3:Column oven
temperature, ºC
1 ++0 12 62 30
2 000 10 60 30
3 -+0 8 62 30
4 0+- 10 62 28
5 --0 8 58 30
6 -0- 8 60 28
7 000 10 60 30
8 000 10 60 30
9 +0+ 12 60 32
10 000 10 60 30
11 0++ 10 62 32
12 +0- 12 60 28
13 0-+ 10 58 32
14 000 10 60 30
15 0-- 10 58 28
16 -0+ 8 60 32
17 +-0 12 58 30
Table 5.Regression coefficients and associated probability values (p-values) for USP tailing factor of Tamsulosin (Plackett-Burman design)
Source Sum level used
Sum of squares Mean square F-value P-value Significance
Model 0.077233333 0.019308333 12.91322 0.0023974
Significant Injection volume 0.028033333 0.028033333 18.74841 0.0034381
Concentration of methanol
0.022533333 0.022533333 15.07006 0.0060372 Column temperature 0.013333333 0.013333333 8.917197 0.0203364 Residual 0.010166667 0.001495238 8.917197 0.0203364
Robustness
The robustness is defined as a measure of its capacity to remain unaffected by the small, but a deliberate change in method parameter will indicate its reliability during normal usage. There should be the reliability of the analysis with respect to deliberate variation in method parameters such as flow rate (± 0.1 mL min-1), pH (±0.1 units) and mobile
phase preparation.
RESULT AND DISCUSSION
Chromatographic separation was done on C-8 column (4.6×150mm, 5µm particle size) with a mobile phase of methanol and distilled water (60:40 v/v) degassed in a sonicator for 10 min and filtered through 0.2 µ membrane filter before use. Peak was obtained at 5.37 min with a flow rate of 1 mL min-1, column temperature 30 ºC. Prior to the
injection of drug solution, the column was equilibrated with mobile phase flowing through the system. Detection was done using a UV detector at 230nm. Further changes were made according to the optimization model and graph peak of drug is given supplementary material in.
Plackett-Burman Design
Figure 1. Pareto chart
Box-Behnken Design
Figure 2. Tailing factor
Figure 3. Response surface (3D) and contour plot showing the effect of injection volume and flow rate on USP tailing factor of Tamsulosin (Plackett-Burman Design)
Factors that were considered here were injection volumes, the concentration of methanol, column oven temperature. The regression coefficient and P-values derived from the software-generated report are given in Table 6. Analysis of variance (ANOVA) which was performed for study the significance of the factors and interaction terms on the response i.e. USP tailing factor of the peak, P-value simply provide the cut-off beyond which we assert that the findings are ‘statistically significant’ by convention, it is P ˂0.05.20
A value of probe F was found to be less than 0.05, hence model was found to be significant for prediction of response. The model found was of modified quadratic model. Entire model was fitted well for optimization process and significant factors were also found which were related to Injection volume as given in Figure 1.
Response surface and contour plot were studied to visualize effect of factor and their interactions so as to develop design space for robust method and 3D graph are given in Figure 2 and 3.
Figure 4. Response surface (3D) and contour plot showing the effects of concentration of methanol and injection volume on USP tailing factor of Tamsulosin (Box-Behnken Design)
For optimized condition, mobile phase was using in ratio of methanol: distilled water (61:39 v/v) at 230 nm wavelength having flow rate of 1 mL min-1 and injection
volume was 10 µg mL and column temperature was set as 30 ˚C.
Method of validation
Linearity and repeatability
A set of solutions of Tamsulosin at a concentration ranging from 10 µg mL-1 was prepared.
Table 6. Regression coefficients and associated probability values (P-values) for USP tailing factor of Tamsulosin (Box-Behnken design)
Source Sum of squares Mean square F-value P-value(prob˃F)
Model 1.766988 0.441747 3.958307 0.028344 Significant A-Injection
volume
0.09245 0.09245 0.828405 0.030653
B-Concentrati on of methanol
0.001512 0.001512 0.013553 0.909248
AB 0.378225 0.378225 3.389113 0.90474 BA2 1.294801 1.294801 11.60216 0.00521
Each sample was analyzed in triplicate, and the calibration curve was constructed by plotting the peak areas versus the concentration using linear regression analysis and repeatability was determined by running six replicates of samples and evaluating the average and %RSD for each sample by comparing peak area and repeatability results are given in Table 7.
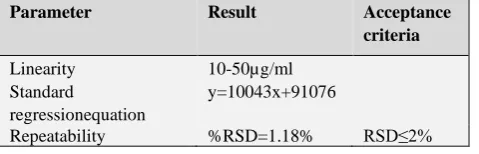
Table 7.Linearity and Repeatability of Tamsulosin
CONCLUSION
The quality by design approach has been successfully used to develop the HPLC method for Tamsulosin API. All critical aspects of QbD were tried to be implemented in this research study. A Systematic approach was utilized for the development of an efficient and robust method, which includes beginning with the determination of target profile characteristics, instrument qualification, risk assessment and design of the experiment. Important three factors were determined to significantly affect the peaks, which were analyzed to determine their interactions and quadratic effects with the least possible runs by using the Box-Behnken model in conjunction with response surface methodology.
Response surface diagram and contour plots were studied by which conclusions arise about which factor is affecting response with limits, which are then recorded. A desirable function was applied for the determination of optimum conditions within the parameters. Optimum conditions were obtained for the QbD approach. The one with higher desirability was selected. Replicates of the run having optimized conditions were taken to confirm the predicted response with the actual response.
ACKNOWLEDGMENTS
The authors are thankful to Honourable chairman Mrs. Fatima Rafiq Zakaria, Maulana Azad Educational Trust Dr. Rafiq Zakaria campus Chairman Aurangabad, and Principal, Y.B. Chavan College of Pharmacy, Dr. Rafiq Zakaria Campus, Aurangabad 431 001 (M.S.), India for providing all the necessary laboratory facility.
REFERENCES
1Q8 (R1): Pharmaceutical Development, Revision 1, ICH
Harmonized Tripartite Guidelines, International Conference on Harmonization of Technical Requirements
2Yu, L.X., Pharmaceutical Quality by design: Product and
process development, Understanding and control, Pharm. Res., 2008,25,781-791. http://dx.doi.org/10.1007/s11095-007-9511-1.
3Sudha, T., Dhomane, J., A validated RP-HPLC method for the
determination of impurities in Tamsulosin.HCl, Int. J. Chem. Res., 2011, 2(4),29-33.
4Hassan, Y., Aboul-Enein, H. Y., Hussein, R. F., Radwan, M. A.,
Yusuf, A., Al-Ahmadi, W., Al-Rawithi, S., Tamsulosin Dissolution from Pharmaceutical Dosage Forms Using an Automated HPLC System, J. Liq. Chromy. Rel. Technol.,
2011, 1109-1116, http://dx.doi.org/10.1081/JLC-120020097
5Bari, S. B., Bakhshi, A. R., Jain, P. S. and Surana, S. J.,
Development and validation of stability indicating HPTLC determination of Tamsulosin in bulk a d pharmaceutical dosage form, Chrom. Res. Int., 2011, Article ID 893260 http:// dx.doi.org/10.4061/2011/893260.
6Israel, D. S., Krishnachaitanya, K., Sankar, D. G., RP-HPLC
method for the estimation of Tamsulosin and Solifenacin in bulk and its dosage form, Int. J. Pharm. Sci. Res.,2013,
4(11), 4343-50. http://dx.doi.org/10.13040/IJPSR.0975-8232.4(11).4343-50
7Kumar, G. S. and Kumar, S. P. B., Stability-indicating
RP-HPLC Method for Determination of Tamsulosin.HCl in Pharmaceutical Dosage Form, J. Basic Clin. Pharm., 2012, 256-260. http:// dx.doi.org/ 10.4103/0976-0105.103817
8 Din, L., Li, L., Tao P., Zhang, Z., Quantitation of Tamsulosin in
human plasma by liquid chromatography-electrospray ionization mass spectrometry, J. Chrom., B., Anal. Technol. Biomed. Life Sci., 2002, 7667(1), 75-81. http://dx.doi.org/10.1016/s0378-4347(01)00546-1.
9Rao, R. N., Talluri, M. V. N. K., Raju, A. N., Shinde, D. D.,
RAmanjaneyulu, G. S., Development of a validated RP-LC/ESI-MS-MS method for separation ,identification and determination of related substances of Tamsulosin in bulk drug and formulations, J. Pharm. Biomed. Anal., 2008,
46(1), 94-103. http://dx.doi.org/10.1016/j.jpba.2007.09.009
10Zhang, Z., Yang, G., Liang, G., Liu, H., Chen, Y., Chiral
Seperation of Tamsulosin isomers by HPLC using cellulose tris as a chiral stationary phase, J. Pharm. Biomed. Anal.,
2004, 34(3), 689-93. http://dx.doi.org/10.1016/s0731-7085(03)0555-7.
11ICH Harmonized tripartite guideline pharmaceutical
development Q8 (R2). d.o.i: www.ich.org.
12Dalal, A., Anees, M. I., Khan, F., Langade, M., Khan, F. A. K.,
Chabukshwar, A., Sangshetti, J. N., HPLC method development for determination of Pyrazinamide and related substances by using QbD approach, Eur. Chem. Bull.,
2019, 8(10), 328-334. http:// dx.doi.org/10.17628/ecb.2019.8.328-334.
Received: 13.10.2019.
Parameter Result Acceptance
criteria
Linearity 10-50µg/ml Standard
regressionequation
y=10043x+91076