PRESENTED BY:
NORC at the
University of Chicago
Larry L. Bye
Senior Fellow
601 Montgomery Street
San Francisco, CA 94111
(415) 315-2005
SEPTEMBER, 2013Covered California
Consumer Market
Baseline/Segmentation Study
PRESENTED TO:
Covered California
560 J Street
Sacramento, CA 95814
Table of Contents
Executive Summary ... 1
Study Background and Objectives ... 7
Study Methodology ... 9
Study Population ... 9
Study/Sample Design ... 9
Survey Questionnaire Development ... 10
Data Collection ... 10
Response Rates ... 11
Data Validation ... 11
Weighting ... 11
Analysis of Baseline Data on Awareness, Knowledge, Attitudes and Intentions ... 13
Segmentation Analysis ... 14
The Analytic Method: NeuroClustersm ... 14
An Overview of Variables Used in the NeuroClustersm Analysis ... 15
Psychographic Measures ... 15
Study Team ... 17
Baseline Findings: Consumer Awareness, Knowledge, Attitudes and
Intentions ... 18
Awareness and Stance toward the Affordable Care Act (ACA) ... 18
Covered California Awareness ... 20
Knowledge about Covered California ... 21
Important Factors in Consumer Decision Making ... 23
Purchase Intent ... 25
Covered California Access Preferences ... 28
Segmentation Analysis ... 30
Overview of the Segments of Uninsured Californians ... 30
Overview of Factors That Differentiate the Segments ... 31
Non-English-Speaking Families/Seldom Online ... 31
Mostly Hispanic/Seldom Online ... 31
At Risk and Denied Insurance ... 32
Realistic and Motivated ... 32
Self-Sufficient but Open to Change ... 33
Who They Are: Income, Family Size, Gender and Education ... 36
All Eligibles ... 36
The Segments ... 36
Who They Are Race: Ethnicity and Language Skills ... 37
All Eligibles ... 37
The Segments ... 37
Segment Profiles: Race/Ethnicity ... 39
All Eligibles ... 39
Use of the Internet ... 40
All Eligibles ... 40
The Segments ... 40
Ownership of a Checking Account ... 41
All Eligibles ... 41
The Segments ... 42
Reasons Given for Being Uninsured ... 42
All Eligibles ... 42
The Segments ... 42
Perceived Risks of Being Uninsured ... 43
All Eligibles ... 43
The Segments ... 44
Psychographic Profiles ... 45
All Eligibles ... 45
The Segments ... 47
The Primary Value of Health Insurance ... 50
All Eligibles ... 50
The Segments ... 51
Awareness of the ACA ... 51
All Eligibles ... 51
The Segments ... 51
Attitudes toward the Affordable Care Act ... 52
All Eligibles ... 52
The Segments ... 52
Awareness of Covered California ... 53
Knowledge about Covered California ... 54
All Eligibles ... 54
The Segments ... 54
Resonance: The Importance of Facts about Covered California ... 56
All Eligibles ... 56
The Segments ... 56
The Knowledge and Resonance Indices ... 57
Most Likely Access Modes for Shopping for Health Insurance ... 58
All Eligibles ... 58
The Segments ... 58
Purchase Intent ... 59
The Segments ... 59
What Motivates the Commitment to Enroll? ... 60
All Committed Eligibles ... 60
The Segments ... 60
What Creates Resistance to Enrolling? ... 61
All Resistant Eligibles ... 61
The Segments ... 61
Locating the Segments Geographically ... 62
Conclusions and Recommendations ... 65
Appendix A: Questionnaire (English language) ... 69
Appendix B: Questionnaire (Spanish language) ... 105
Appendix C: Areas and Counties in California ... 142
List of Exhibits
Exhibit 1. Segments of Uninsured Eligibles (n=742) ... 30
Exhibit 2. Race/Ethnicity by Segment (n=742) ... 38
Exhibit 3. Self-Reported English-Speaking Ability by Segment (n=742) ... 39
Exhibit 4. Segments by Race Ethnicity(n=742) ... 40
Exhibit 5. The Primary Value of Health Insurance by Segment (n=742)... 51
Exhibit 6. Awareness of the Affordable Care Act (n=742) ... 52
Exhibit 7. How They Expect the Affordable Care Act to Affect Them by Segment (n=742) ... 53
Exhibit 8. Knowledge and Resonance Indices by Segment (n=742) ... 57
Exhibit 9. Preferred Mode of Access for Shopping for Health Insurance (n=742) ... 58
Exhibit 10. Purchase Intent by Segment (n=742) ... 60
Exhibit 11. Geographical Area by Segment (n=727) ... 63
List of Tables
Table 1. Un-weighted and Weighted Totals for Raking Variables ... 12
Table 2. Percent Heard, Seen, or Read Anything about the Affordable Care Act by Insurance Status (n=2,658) ... 19
Table 3. Among Those Who Have Heard of the ACA, Percent Who Think The Affordable Care Act Will Be Good, Bad or Will Have No Impact by Insurance Status (n=2,262) ... 19
Table 4. Percent Able to Specify the Organization Where ACA Coverage Can Be Obtained by Insurance Status (n=2,658) ... 20
Table 5. Percent That Demonstrated Aided Awareness, Unaided Awareness, or No Awareness of Covered California by Insurance Status (n=2,658) ... 21
Table 6. Overall Knowledge of Covered California - Percent Correct by Item and Insurance Status (n=2,658) ... 22
Table 7. Important Factors in Consumer Decision Making by Insurance Status (n=2,658) ... 24
Table 8. Among Respondents Who Heard Monthly Premium Cost, Likelihood of Purchasing Insurance through Covered California by Insurance Status (n=2,592) ... 26
Table 9. Purchase Motivators among the Committed, by Insurance Status (n=605)... 27
Table 10. Purchase Barriers among the Resistant, by Insurance Status (n=724) ... 27
Table 11. Covered California Access Preference by Insurance Status (n=2,658) ... 28
Table 12. Covered California Access Preference by Internet Usage (n=2,494) and English Proficiency (n=2,756)... 29
Table 13. Health Status and Age by Segment (n=742) ... 35
Table 14. Income, Family Size, Gender and Education by Segment (n=742) ... 36
Table 15. Internet Use by Segment (n=742) ... 41
Table 16. Reasons for Being Uninsured by Segment (n=742) ... 42
Table 17. Perceived Risks of Being Uninsured by Segment (n=742) ... 44
Table 18. Overall Ratings of Agreement with Psychographic Items (n=742) ... 46
Table 19. Psychographics Related to Risks, Financial Consequences, Money Problems and the Value of Insurance by Segment (n=742) ... 49
Table 20. Psychographics Related to General Orientations and Lifestyles (n=742) ... 50
Table 21. Awareness of Covered California by Segment (n=742) ... 54
Table 22. Percentage of Correct True/False Answers to Knowledge Questions (n=742) ... 55
Table 23. Mean Ratings of Importance of Facts about Covered California (0-10 Scale) (n=742) ... 56
Table 24. Reasons for Planning to Buy Health Insurance through Covered California (Open-Ended Question) (n=209) ... 61
Table 25. Reasons for Not Planning to Buy Health Insurance through Covered California (Open-Ended Question) (n=112) ... 62
Executive Summary
A baseline survey of approximately 2700 uninsured and privately insured Californians was conducted in order to inform the development of the Covered California marketing/outreach campaign. The survey collected data on consumer awareness, knowledge, attitudes and purchase intentions prior to the launch of the campaign. The study also explored market segmentation issues. Data were collected by telephone in multiple languages from May 15-June, 22, 2013.
Major findings from the study are summarized below.
Aided Awareness of the Affordable Care Act (ACA)
Aided awareness of the Affordable Care Act (ACA) is quite high among uninsured and privately insured Californians. Seventy-nine percent said they had heard or read about the law that was passed by Congress and signed by President Obama in 2010. Among the uninsured subsidy- eligible, 75% were aware of the ACA.
Basic Stance toward the ACA
Forty-five percent of uninsured and privately insured Californians believe that the ACA will be good for them, twice as many as the 23% who believe that it will be bad for them. Seventeen percent believe that it will have no effect. Fifteen percent are undecided. Among the subsidy-eligible, opinions are more
positive: 53% believe that the ACA will be good for them compared with 18% who say it will be bad. Eleven percent said it will be bad. Eighteen percent are undecided.
Attitudes toward the ACA will undoubtedly improve as consumers become more informed about the benefits of the law, a major goal of the marketing/outreach campaign.
Awareness of Covered California
Not surprisingly, unaided awareness of Covered California is very low at baseline, only 3%. Aided awareness of Covered California (unaided + aided) is 12%. Among the subsidy-eligible, unaided awareness is only 1%. Aided awareness is 9%.
Knowledge about Covered California
Study respondents were asked a series of questions to elicit their level of knowledge about Covered California and what it will offer beginning in the fall. Each question addresses some fact about Covered California that is basic to understanding what it will offer and how it will operate. Overall, baseline levels of knowledge are low. Changing them is a critical priority for the campaign about to be launched.
Consumers are most knowledgeable about the availability of coverage for people with pre-existing conditions. Fifty-nine percent were able to answer this question correctly in the survey. Almost all the rest said that they were unsure. On this, and all the other items, the proportion of consumers giving the
incorrect answer was greatly exceeded by those giving the unsure response, indicating that the challenge going forward is not to correct consumer misconceptions but instead to initially define Covered California for consumers.
About half of study respondents knew that “they could get information, compare plans and get insurance by going to a Covered California website” (54%), that there was a penalty for not enrolling in an
insurance plan (53%) and that people with lower incomes will pay lower out-of -pocket costs when they use health care under the new plans (48%).
Fewer knew that people with low and moderate incomes will receive tax credits to reduce monthly premiums (38%), that private plans will compete for their business (37%) and that Covered California is not a welfare program (28%). Only 23% knew that Covered California is the only place low and moderate income people can get tax credits to help to reduce their costs and that the plans were comparable in quality to those available elsewhere. About the same proportion knew that Covered California will not offer only government health insurance plans (27%) and will not be operated by the insurance industry (22%).
Among the uninsured with incomes in the subsidy-eligible range, the findings were similar.
Importance of Facts about Covered California
During the interview, respondents were presented with eight facts about Covered California and asked to rate each in terms of its importance in their decision-making about whether to purchase a plan from Covered California. The facts mirror many of the knowledge items included in the survey. Each is essentially a reason or argument for purchasing health insurance at Covered California.
The following were rated as very important to consumers (about 8 or higher on a 10 point scale): no one will be denied coverage, ease of plan comparison and selection, and the screening of plans for quality. Three others ranked as somewhat less important (7 on the scale): the choice of private plans available, limits for some on out of pocket costs and that availability of premium assistance. Two were rated as not important (6 or lower): state government operation of Covered California and individual mandate/penalty.
Purchase Intent
Twenty-two percent of consumers are committed to purchasing a plan from Covered California with an additional 47% saying they are receptive to doing so. This is after exposing them to what the approximate price would be based on their age, income and family composition as well as important facts about Covered California. Twenty-nine percent are resistant to purchasing a plan from Covered California. Only 3% are undecided. These are very positive data and indicate that Covered California is likely to be successful in enrolling large numbers of consumers in new health plans.
Among the subsidy-eligible, there is greater interest in purchasing a plan. One quarter (26%) are committed and an additional 56% are receptive. Seventeen percent are resistant to plan purchase. Only 1% is unsure.
Purchase Motivations
Three motivations were most often cited by those committed to purchasing a plan: a desire to take advantage of the good prices that will be available, the security and peace-of-mind that comes from being insured and a simple need for coverage/care. These data were the same for the sample as a whole as well as the subsidy-eligible.
Barriers to Purchase
High prices were by far the most commonly mentioned barrier among those who said they would not purchase a plan. A much smaller group said that they did not need insurance because they were in good health or could get care without insurance. Opposition to the ACA and concern about the quality of the plans were only infrequently mentioned.
Among the subsidy-eligible, the findings were similar although opposition to the ACA was mentioned slightly more often.
Modes of Shopping/Enrollment
Six-in-ten (63%) say they will most likely to go online to shop for health insurance at Covered California. Nineteen percent say they will make use of a neighborhood counselor. Fifteen percent will make use of the telephone service center. Among subsidy-eligible customers, more will make use of a counselor (26%) although the majority (57%) will go online. As with consumers in general, 17% will make use of the telephone service center.
Customers using the online enrollment portal are likely to be younger, more Internet comfortable and more proficient in English. The other two portals, particularly the counselors, will be important for those who are older and less comfortable with the Internet and English.
Attitudes of the Uninsured Subsidy-Eligible
The study uncovered the following important attitudinal characteristics of the uninsured subsidy-eligible group, the primary market for Covered California:
■ Importance of health information. The group believes that it is very important to be informed about health matters and many report recently seeking information on health topics.
■ Worry about money. The group worries about money a lot as well as their ability to take on another financial obligation right now.
■ Strong concern about ability to pay for care. They are concerned about their ability to pay for care and strongly believe that major illness would be a financial disaster for them.
■ Despite this, some ambivalence about the risk of being uninsured. One the one hand, many worry about their health and/or that of a family member and reject the idea that “health insurance is for sick people.” On the other hand, many also reported in the survey that they aren’t sure about whether they want to “spend money insuring against things that probably won’t happen.” They were also divided on whether they “know how to get along without a doctor” if they get sick and on whether they need to worry about health care since they “take good care of themselves.”
■ Conflict about the value of insurance. They strongly believe that it is smart to get insurance. They’re also willing to make financial sacrifices in order to have the peace-of-mind it would bring. However, at the same time, they are not sure about whether you can insure against life risks, whether insurance costs more than paying for care, and whether overall it’s worth the money it costs.
■ Primary value of insurance viewed as the protection against catastrophic costs. When asked to identify the main value of health insurance, protection against catastrophic bills was believed to be more important than minimizing day-to-day costs of care and even peace-of- mind. In fact, peace-of-mind seems to be defined by consumers as relief from the fear of adverse financial consequences associated with the serious illness or injury.
■ Undecided about the complexity of getting insurance. The subsidy-eligible are divided about how complex it is to get insurance. This suggests that complexity may not be a barrier for as many consumers as we have feared.
■ Conflicted normative influences. The subsidy-eligible are conflicted about the social acceptability of getting insured. They don’t see themselves as “the type of person who has health insurance” but also believe that people who care about them want them to become insured.
Seven Segments of the Subsidy-Eligible
Seven segments of the subsidy-eligible uninsured emerged from the segmentation analysis that was performed as part of the study. The analysis has broad implications for campaign strategic planning efforts.
Three of the segments are mostly composed of older Californians:
■ Non-English-Speaking Families/Seldom Online (23%): The largest single segment is composed primarily of non-English-speaking Hispanics. These Californians don’t speak or read English well and seldom use the Internet. Two-thirds have incomes in the 139-199% FPL income range and hence will qualify for significant assistance. This is the segment most likely to be committed or receptive to plan purchase. About one-third (32%) are committed and 58% are receptive. Eight-in-ten believe the ACA good for them, the highest proportion of any group.
■ Mostly Hispanic/Seldom Online (11%): This segment is also predominantly Hispanic but much more English proficient than the Non-English-Speaking Families/Seldom Online segment. They speak and read English well. Most do not use the Internet or are infrequent users. Thirty percent are committed to purchasing a plan and 51% are receptive. Almost six-in-ten (57%) believe that ACA will be good for them. They often have family members with fair to poor health and are concerned about being denied for insurance because of a pre-existing condition. Despite their interest in purchasing a plan, they are very conflicted about the value of insurance.
■ At Risk and Denied Insurance (6%): This small segment is the most likely to report a chronic condition, a disability and having been denied health insurance because of a pre-existing health condition. They are most likely to be in the 55-64 year old group that is likely to have difficulty getting insurance regardless of health status. The majority of this group is non-Hispanic White. Surprisingly, only 40% believe that the ACA good for them; 34% say it will be bad. Despite this ACA stance, about one-in-five (21%) is committed to plan purchase and six-in-ten (59%) are receptive.
Four segments are mostly composed of young people:
■ Realistic and Motivated (12%): This segment is well educated, majority-female and Internet savvy. Hispanics are the largest ethnic group. Unlike many other younger Californians, they have positive attitudes toward health insurance. Six-in-ten (62%) say ACA will be good for them. Nearly half will be eligible for the most generous Federal subsidies. Nearly half will be eligible for the most generous Federal subsidies. Twenty-seven percent are committed to purchasing a health plan from Covered California and an additional 61% are receptive.
■ Self-Sufficient and Open to Change (15%): There are more Hispanics than any other
race/ethnicity in this group, which has slightly higher incomes than the Realistic and Motivated
segment. They also report better health and less worry about both health and money problems. As a result they are more conflicted about the value of insurance. Nevertheless, 36% are committed to purchasing a plan, the largest proportion of any segment. Fifty-three percent are receptive. The majority, 56%, say that the ACA will be good for them. They are very frequent Internet users.
■ Risk Takers (16%): The majority of this segment is White. They are well educated, have
relatively high incomes and are frequent Internet users. The segment is divided on the ACA: 38% say it will be good for them but 31% say it will be bad. The youngest of the youth segments, this group does not feel a need for insurance because they are in good health and have learned to live without it. Only 9% are committed to purchasing a plan but, surprisingly, 66% say they are receptive, suggesting a high level of ambiguity about whether they will respond to the campaign or not.
■ Risk Deniers (16%): This segment is mixed in terms of race/ethnicity. Along with the Risk Takers, it is the youngest of the four youth segments. Like the Risk Takers, they are well
educated, have relatively high incomes and are frequent Internet users. Also like the Risk Takers, they do not feel the need for insurance but, unlike their counterparts, this segment more clearly denies the risk that exists. They are most likely to hold a negative view of the ACA and are most resistant to enrolling in Covered California; 35% say they will not enroll in a plan. This is the only segment where more say that the ACA will be bad (32%) than say it will be good (26%) for them.
Study Background and Objectives
Covered California is about to launch a large-scale marketing and outreach campaign in order to promote the purchase of health insurance under the provisions of the Patient Protection and Affordable Care Act. The goal of the campaign is reach millions of uninsured and privately insured Californians with
information about what will be available to them commencing in January of 2014. In order to plan the campaign, NORC has completed a series of studies for Covered California. The earlier studies, all qualitative in nature, have assessed knowledge and attitudes toward the coming changes to the health insurance system, interest in using Covered California to shop for insurance as well as motivations and barriers related to purchasing a plan. These studies have been exploratory in nature. While they have generated valuable planning information the qualitative methods make it difficult to draw definitive conclusions about optimal marketing/outreach campaign strategies.
There were three main goals in undertaking this study. First, we are seeking to validate the insights developed from the previous qualitative efforts, insights that have been guiding planning efforts to date. A second goal is to understand how the market can best be segmented for planning and campaign
implementation purposes. Segmentation is a powerful tool that can contribute greatly to the effectiveness of marketing campaigns. It requires the use of sophisticated methods and large survey samples. The third goal is to provide a baseline assessment of consumer awareness, knowledge, attitudes and intentions prior to the launch of the campaign so the progress over time can be measured and the effectiveness of the campaign can be assessed.
The specific objectives of this study were to assess:
■ The baseline level of awareness and knowledge concerning the changes coming to health care/insurance system,
■ The baseline level of awareness of Covered California as well as knowledge about how to enroll in a plan,
■ The ability to enroll online without assistance and, if assistance is needed, consumer needs and preferences in this area,
■ Drivers of interest in enrollment, and barriers to enrollment, including expected positive and negative outcomes, the perceived risk of being uninsured, economic constraints and general attitudes toward the health industry and government,
■ Differences in the above based on race/ethnicity, geography and other important demographic characteristics,
■ The number of ready enrollees, who will likely enroll as soon as open enrollment begins in the fall of 2013; the receptive, who are receptive but not yet ready to enroll; and the resistant, who do not intend to enroll in a plan,
■ How to define market segments based on factors that illuminate the reasons for their interest, receptivity or resistance including expected positive and negative outcomes, perceptions about health risks, and other facilitators and barriers to enrollment as well as lifestyles, economic constraints, social influences and demographics, and,
■ How the segmentation varies across four main race/ethnicity groups—Hispanics, African Americans, Asian/Pacific Islanders and Non-Hispanic Whites.
Study Methodology
This section of the report describes the methods used to complete the study.
Study Population
The study included two main populations: uninsured and individually, or privately, insured Californians. Uninsured Californians are those who are not currently covered by any health insurance including insurance obtained through an employer, purchased directly or a government program. Individually insured Californians are those who purchase private insurance without any assistance from an employer or the government.
In addition, qualified respondents had to meet the following selection criteria:
■ 18 – 64 years of age
■ Legal resident of California
■ Makes decisions about healthcare for themselves or family
■ Total family income above 100% Federal Poverty Level (FPL)
Study/Sample Design
In order to sample the study populations, we developed a statewide sample of the general household population as well as targeted samples of two groups that would not be captured in large enough numbers in the statewide sample—African Americans and Asian/Pacific Islanders. The general population sample included both a landline and cell telephone random digit dial component. The two race/ethnic over-samples included households randomly selected from a list of state households thought to be made up of populations of interest. This list was developed by Marketing Systems Group (MSG), a leading supplier of high quality survey samples, using a variety of databases containing information on the demographic characteristics of U.S. households. In some cases, the use of data on ethnic surnames is also incorporated into the database development process. It is important to recognize that, since not all California Asian Pacific Islander and African American households are represented in these databases it is possible that the households captured in our samples are not fully representative of the two race/ethnic groups.
Nevertheless, this approach is a cost-effective one that is often used to ensure sufficient diversity in survey samples.
Survey Questionnaire Development
In conjunction with Covered California and Ogilvy West, an advertising contractor to Covered California, the NORC study team developed the survey questionnaire. The final questionnaire included eleven main sections devoted to the following topics:
■ Overall satisfaction with current health insurance plan (if already insured)
■ Reasons for being uninsured along with perceived risks
■ Psychographics, including orientations to planning, risk and finance as well as health/health care and insurance
■ Awareness and basic attitudinal stance toward the ACA
■ Knowledge about where to get insurance in 2014 including awareness of Covered California
■ Knowledge about shopping for insurance at Covered California
■ Decision making importance of key facts about shopping for insurance at Covered California
■ Purchase intentions along with related motivations
■ Cell phone and Internet usage
■ Checking account access
■ Classification variables (e.g., zip code, age, health status)
Data Collection
Data were collected using NORC’s computer-assisted telephone interviewing (CATI) system. This system supports industry-standard dialing procedures and allows for online audio and visual monitoring and audio recording to guarantee high data quality. Data collection began on May 16, 2013 and continued through June 22, 2013. Interviews were conducted in English and Spanish with live real time translation services available for those respondents who wanted to complete the interview in another language.
The number of calls placed to get an interview with each sampled household varied based on a number of factors, including the history of previous attempts to contact the household and sample type. In general, we attempted to make at least 8 calls to non-responding households at different times of day and on different days of the week over at least a two-week period. Except in cases where a household request to be taken off our calling list or where a respondent was hostile, we attempt at least one refusal conversion attempt. There were no financial incentives offered for participation in the study.
A total of 2,756 interviews were completed. Approximately 64% (n=1,773) of all completes came from the base sample. An additional 983 additional interviews were completed; 629 with African Americans and 354 with Asian/Pacific Islanders.
Response Rates
Response rates were calculated using AAPOR standards for RR3. The final response rate was 24.8%
Data Validation
On an ongoing basis throughout the data collection period, NORC reviewed CATI data and other quality indicators to ensure that data were collected according to the study protocol. After all of the editing and validation work was completed, the open-ended responses were coded and the data sets were prepared for weighting and analysis.
Weighting
In order to maximize efficiency, most of the general population interviews were conducted on landline telephones. Landline interviews are less labor intensive to complete which reduces study costs. However, the large number of landline interviews resulted in the completion of too few interviews with Hispanics, Non-English-speakers and uninsured individuals, populations more likely to be cell phone users. In addition, the use of the telephone mode of data collection made it a challenge to capture young people, particularly young men, in large numbers since they are difficult to reach in surveys conducted by the telephone.
As a result of the imbalances the distribution of the interviews, prior to beginning analysis, the data were weighted to population control totals. The population control totals were derived from the CalSIMS data supplied to Covered California by the University of California-Berkeley. In addition to adjusting the sample to known population totals, the purpose of the weighting was to adjust for the complex sample design (i.e. within-household selection and the inclusion of landline, cell, and listed samples). These adjustments allow unbiased inferences to be made from the sample to the population of interest.
Weighting involved four main steps:
■ Create a baseweight: Due to the complex nature of the sample design, each sample case was given a baseweight of 1.
■ Adjustment for multiple chance of selection: Most households that own at least one cell phone are more likely to have multiple cell phones associated with the household, as a cell phone is
considered more a personal device. Therefore, households from the cell phone frame are adjusted to account for multiple chances of selection in the cell phone frame. Since a large majority of households only have one landline number, this adjustment was not needed on the landline frames.
■ Adjustment for overlap between the cell phone and landline frames: Cases that were deemed eligible from both the landline and cell phone frames were adjusted to account for the multiple chance of selection. These cases had their weights adjusted in half to account for this overlap in frames.
■ Raking to Population Control Totals: The adjusted weights are raked to known population control totals. The control total variable used for raking were age, sex, insurance status,
race/ethnicity, household poverty level, English proficiency, and telephone status. This allows for subgroups within the sample to sum to known subgroup totals within the target population. These raked weights are the final weight that was used in analyses.
Table 1 presents the impact of weighting on the sample demographics. It displays the un-weighted and weighted totals for variables used in the raking.
Table 1.
Un-weighted and Weighted Totals for Raking Variables
Un-weighted Weighted
Control totals Privately
insured Uninsured All
Privately
insured Uninsured All
Insurance Status 1,474 1,282 2,756 1,505,391 3,042,277 4,547,668 4,547,668
Uninsured NA 100% 47% NA 100% 67% 67%
Insured 100% NA 53% 100% NA 33% 33%
Household Poverty Level 1,474 1,282 2,756 1,505,391 3,042,277 4,547,668 4,547,668
100%-138% FPL 9% 26% 17% 4% 16% 12% 12%
139%-299% FPL 28% 53% 40% 18% 55% 43% 43%
300%-399% FPL 22% 10% 16% 15% 11% 12% 12%
Un-weighted Weighted
Control totals Privately
insured Uninsured All
Privately
insured Uninsured All
Age 1,439 1,274 2,713 1,485,066 3,017,788 4,502,854 4,547,668 18-34 11% 22% 16% 34% 49% 44% 44% 35-54 40% 45% 42% 38% 35% 36% 36% 55-64 50% 33% 42% 28% 16% 20% 20% Race 1,474 1,282 2,756 1,505,391 3,042,277 4,547,668 4,547,668 Hispanic 11% 28% 19% 31% 49% 43% 43% Asian 14% 14% 14% 16% 12% 13% 14% Black 12% 13% 12% 5% 4% 4% 4% White /other 64% 45% 55% 48% 35% 39% 39% Gender 1,474 1,282 2,756 1,505,391 3,042,277 4,547,668 4,547,668 Male 41% 47% 43% 45% 54% 51% 51% Female 59% 53% 57% 55% 46% 49% 49% Primary Language 1,474 1,282 2,756 1,505,391 3,042,277 4,547,668 4,547,668 English 95% 80% 88% 95% 78% 84% 47% Spanish 1% 12% 6% 2% 18% 13% 38% Other 4% 7% 5% 3% 4% 4% 15% English Proficiency 1,474 1,282 2,756 1,505,391 3,042,277 4,547,668 4,547,668 Speak English Very Well 81% 66% 74% 78% 62% 67% 67% Speak English Less Than Very Well 19% 34% 26% 22% 38% 33% 33% Note: The FPL categories used for weighting differ from those used in the analysis of the study. For the latter, we broke the uninsured into the following FPL groups: 100%-138%, 139%-199%, 200%-399%, and 400% and above.
Analysis of Baseline Data on Awareness, Knowledge, Attitudes and
Intentions
One main focus of data analysis work was the assessment at baseline of the following:
■ Awareness of and stance toward the Affordable Care Act (ACA),
■ Aided and unaided awareness of Covered California,
■ Knowledge about Covered California,
■ Importance of key facts about Covered California in consumer decision making about insurance,
■ Purchase intent, motivations, and barriers, and
■ Covered California access preferences
For the measures in each of these areas, descriptive analyses were conducted for each demographic category of interest: insurance status/income level, race/ethnicity, geographic region and age) and the selected substantive variables. With regard to region, the state was divided into five areas: Los Angeles County, Other Southern California, Central Valley, San Francisco Bay Area and Other Northern California. See Appendix for a list of the counties included in each area.
The Chi-Square test was used to assess the statistical significance of any differences that were observed.
Segmentation Analysis
The second main focus was the market segmentation analysis which was focused on the uninsured subsidy-eligible part of the consumer market.
The overall purpose of the segmentation analysis is to identify meaningful segments of uninsured “eligibles,” that is uninsured Californians eligible for federal subsidies to reduce the cost of their
premiums. By meaningful, we mean segments that provide insights on targeting through owned, paid and earned media, as well as other channels of communication; messaging strategies for each segment; and strategies to facilitate enrollment of segments with special needs, such as personal and/or in-language assistance.
Eligibles include those who total household incomes are between 139% and 399% of the Federal Poverty Level (FPL). Eligibles whose incomes are between 139% and 199% of the FPL will receive a
considerably larger segment than will those whose incomes are between 200% and 399%.
We describe the segments in terms of the psychological, sociological, cultural and economic factors that could affect enrollment in Covered California, including:
■ Contextual factors, such as demographics, race/ethnicity, health status, Internet use, access to a checking account, and other variables that reflect the person’s life situation.
■ Psychographics, such as orientations to planning, risk and finance; health and health care; and health insurance.
■ Reasons for being uninsured ■ Perceived risks of being uninsured
■ Knowledge of and importance of facts about Covered California ■ Motivators and barriers to enrollment
The Analytic Method: NeuroClustersm
NeuroClustersm is a powerful high-resolution clustering method that allows segments to be defined
empirically rather than a priori, providing an entirely data driven solution. 1This robust method analyzes a large number of variables and classifies respondents into relatively homogenous segments. Based on neural network technology, NeuroClustersm mimics human pattern recognition by finding the variables
that best differentiate between the segments. The analyst then defines and describes each segment according to the variables that make it unique.
Neural network technology is a proven method has been used in automatic steering and targeting (by the military), control of robots and automated production equipment, de-coding, recognition of subversive or criminal activities filmed by surveillance cameras, business process improvements, and intelligence gathering by national security agencies, as well as marketing and social research.
An Overview of Variables Used in the NeuroClustersm Analysis
The cluster algorithm included variables that are relatively enduring characteristics of the individual, including:
■ Psychographics, e.g., orientations to risk-taking, finances, health and health insurance
■ Race/ethnicity and English language skills
■ Reasons for being uninsured
■ Perceived risks of being uninsured
■ Motivators and barriers to enrolling via Covered California
■ Internet use
■ Access to a checking account
■ Health status
■ Selected demographics, e.g., income as a percentage of the federal poverty level (FPL), age, gender
The cluster algorithm did not include more ephemeral characteristics that could change as the campaign progresses, such as purchase intent, the Knowledge Index (based on the accuracy of perceptions about Covered California) and the Resonance Index (based on the perceived importance of facts about Covered California). However, since these more ephemeral variables predict and explain enrollment, they are included in the segment descriptions.
Psychographic Measures
Psychographics measure attitudes, values, lifestyles and opinions. These are central to good segmentation analyses. NORC developed a custom psychographic inventory for this study. The items comprising this inventory are listed below grouped by the major concepts they are intended to measure. Please note that the text of some of the longer items will be shortened in the tables and charts included in segmentation chapter of the report.
Complexity
Getting health insurance is too complicated
Denial/Acceptance of Risk
I don’t worry about health care because I take good care of myself.
(I am/all the people in my immediate family are) healthy and unlikely to need much medical care in the foreseeable future. I am worried about (my health/my health or the health of someone in my immediate family).
I know how to get along without going to a doctor if I get sick. Health insurance is for sick people.
Don’t want to spend money insuring against problems that probably won’t happen.
Early Adoption
I’m usually among the first to try new things.
Fear of Financial Consequences
A major illness or injury would be a financial disaster for me. I’m concerned about not being able to pay for health care.
Value of Health Information
It’s very important for me to be informed how to best take care of my health. I have looked for information on health topics recently.
Value of Insurance
Life is full of risks that you can’t plan for or insure against. You just have to take your chances. I focus on the challenges I face today, not the ones I might face in the future.
It’s smart to get insurance in case you get sick in the future. Health insurance can cost more than paying for health care. Health insurance is well worth the money it costs
I am willing to sacrifice now to have peace-of-mind about the future.
Just Starting Out
I am just starting out in life.
Money Problems
I worry about money a lot.
There is no way that I could take on another financial burden right now. It is a challenge for me to pay my bills every month.
Primary Decision-Maker Status
Someone else takes care of my health care so I really don’t need to think about health insurance.
Reliance on Others
I have other people I can turn to if I need help.
Social Norms
A lot of people who didn’t have health insurance before are getting it now because it is the right thing to do. The people I care most about want me to get health insurance.
Study Team
Larry L. Bye, NORC Senior Fellow, headed the study team. Along with Dr. Rebecca Quarles, of QSA Analytics, he designed the survey questionnaire and actively participated in data analysis and report writing work. In addition to assisting with questionnaire development, Dr. Quarles and Robert W. Schnurr of QSA led the segmentation analytical efforts. Senior Survey Director Margrethe Montgomery provided project support and monitored costs. Martin Barron, Senior Research Scientist provided methodological support and oversight of many aspects of the data analysis effort. Kim Williams, Survey Director II, managed data collection and participated in data analysis efforts. Hildie Cohen, Survey Director I, provided additional project and analytic support.
Baseline Findings: Consumer Awareness, Knowledge,
Attitudes and Intentions
This section of the report presents study findings related to consumer awareness, knowledge, attitudes and intentions. Findings are presented for each of the insurance status groups in the sample. Tables presenting subgroup differences (defined by race/ethnicity, age and region of the state) appear in the report appendix.
The segmentation findings follow in the next chapter of the report.
Awareness and Stance toward the Affordable Care Act (ACA)
A variety of survey items assessed consumers’ awareness and perception of the ACA. Over three-quarters (79%) of all consumers reported that they had seen, heard or read about the ACA (see Table 2). Age, race/ethnicity, geographic area and insurance status were significantly related to awareness (age race/ethnicity, and geography tables are included in Appendix C). The privately insured and those at 400%+ FPL reported the highest percentage of awareness with the ACA. Awareness declined as
household income declined (that is, respondents in households with income 100% - 138% FPL had lower awareness than those in households with income 139% - 199% FPL, and so on) However, the majority of consumers in each insurance status reported awareness with ACA. In terms of age, over three-quarters of respondents in each age category expressed awareness with the ACA. By race/ethnicity, two-thirds of respondents in each category were aware of the ACA; the White and “other” groups reported the highest percentages of awareness at 89% and 88% respectively. Geographically, respondents in Southern California (including LA County) indicate the lowest awareness of the ACA (76-77%) while the Central Valley and Other Northern California areas reported the highest awareness (85-86%). As noted at the beginning of this chapter, tables displaying the age, race/ethnic and geographic differences appear in the report appendix.
Table 2.
Percent Heard, Seen, or Read Anything about the Affordable Care Act by
Insurance Status (n=2,658)
Insurance Status Privately insured Uninsured All 100%-138% FPL 139%-199% FPL 200%-399% FPL 400%+ Yes 89% 66% 68% 82% 89% 79% No 10% 32% 30% 18% 11% 19% Don't know 1% 2% 2% 0% 0% 1%Among those who were aware of the ACA, 45% believed it would have a positive impact on their lives, 23% anticipated a negative impact and 17% predicted no impact (see Table 3). Age, race/ethnicity, geographic area and insurance status were significantly related to consumers’ stance toward the ACA. The majority of uninsured consumers at 100-138% FPL, 139-199% FPL and 200-399% FPL believed that the ACA would have a positive impact on their lives. Nearly one-third of the privately insured and
uninsured consumers at 400%+ FPL believed that ACA would have a negative impact. Over 40% of consumers in each age category anticipated a positive impact. Hispanic and African American respondents were the most optimistic about the impact of the Affordable Care Act with 52% and 57% respectively reporting the ACA will have a positive impact. Northern Californian respondents are most negative on the ACA, with 45% reporting that it will be bad for them. In contrast, only 14% of those in the San Francisco Bay Area and 16% of those in LA County view the ACA as being bad for them.
Table 3.
Among Those Who Have Heard of the ACA, Percent Who Think The
Affordable Care Act Will Be Good, Bad or Will Have No Impact by Insurance Status
(n=2,262)
Insurance Status Privately insured Uninsured All 100%-138% FPL 139%-199% FPL 200%-399% FPL 400%+ Good 35% 60% 62% 46% 41% 45% Bad 27% 18% 13% 22% 29% 23% No impact 24% 8% 9% 12% 18% 17% Don't know/refused 13% 15% 16% 20% 11% 15%Covered California Awareness
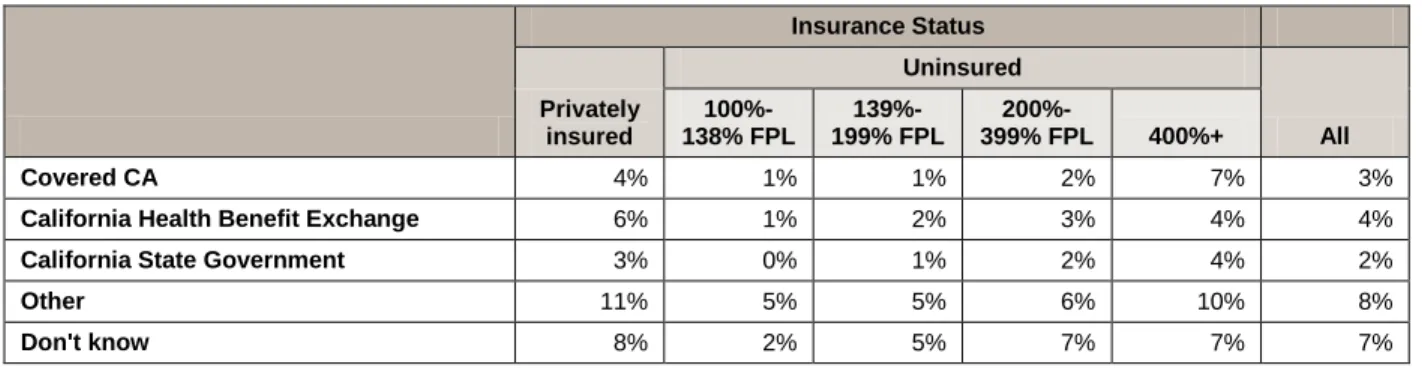
Before any mention of Covered California, respondents were asked to indicate where Californians could go to get health insurance under the ACA. Only 3% of consumers reported that they could go to Covered California to purchase insurance (see Table 4). Race and insurance status were significantly related to awareness of Covered California; however, age and geographic area were not. The uninsured at 400%+ FPL reported the highest percentage of awareness of Covered California of any insurance category (7%) whereas the privately insured reported the highest percentage of awareness of the California Health Benefit Exchange (6%). The age group 18-25 reported the lowest percentage of awareness for Covered California while 45-54 year olds reported the highest (1%). White and “other” racial categories reported the highest percentages of awareness of Covered California and the California Health Benefit Exchange (4-7%). Respondents in the San Francisco Bay Area were most likely (5%) to be able to name Covered California.
Table 4.
Percent Able to Specify the Organization Where ACA Coverage Can Be
Obtained by Insurance Status (n=2,658)
Insurance Status Privately insured Uninsured All 100%-138% FPL 139%-199% FPL 200%-399% FPL 400%+ Covered CA 4% 1% 1% 2% 7% 3%
California Health Benefit Exchange 6% 1% 2% 3% 4% 4%
California State Government 3% 0% 1% 2% 4% 2%
Other 11% 5% 5% 6% 10% 8%
Don't know 8% 2% 5% 7% 7% 7%
Table 5 summarizes the overall awareness of Covered California, combining both unaided and aided awareness. Very few people (3%) expressed an unaided awareness of Covered California. Slightly more (9%) expressed an aided awareness. However, the vast majority of respondents (88%) expressed neither aided nor unaided awareness of Covered California. Overall awareness (unaided + aided awareness) was significantly associated with insurance status, age, race/ethnicity, and geography. Overall, awareness, increased with household income (from 4% among those 100%-138% FPL to 16% among those 400%+ FPL) and age (from 3% among 18-25 year olds to 21% among those 55-64. Asian and Hispanic
Table 5.
Percent That Demonstrated Aided Awareness, Unaided Awareness, or No
Awareness of Covered California by Insurance Status (n=2,658)
Insurance Status Privately insured Uninsured All 100%-138% FPL 139%-199% FPL 200%-399% FPL 400%+ Aided awareness 14% 2% 9% 8% 10% 9% Unaided awareness 4% 1% 1% 2% 7% 3% Aided + unaided 18% 4% 9% 10% 16% 12% Not aware 82% 96% 91% 90% 84% 88%
Knowledge about Covered California
The survey assessed consumers’ knowledge of Covered California with a series of statements about the new marketplace (see Table 6 for the 11 items); consumers were asked to state whether these statements were true or false. Each statement addressed some fact about Covered California that is basic to
understanding what it will offer and how it will operate. In order to evaluate overall knowledge, a composite score based on correct responses to these 11 true/false items was calculated.
In Table 6 we display consumer knowledge on each of the 11 items by insurance status. As anticipated, knowledge levels are low at baseline. Overwhelmingly, those not giving correct answers were unsure as opposed to incorrect in the answers they gave. Therefore, the challenge going forward is not to correct misconceptions but to define for the first time what Covered California is. The items with the highest proportion of incorrect (as opposed to unsure) responses were those having to do with Covered California as a welfare program (20% giving the actual incorrect response), the relatively poor quality of the plans being offered (27% incorrect) and the idea that the insurance industry runs Covered California (22% incorrect).
Knowledge levels are consistently low across all the insurance categories with a few notable exceptions. Generally, those privately insured or uninsured with income 400%+FPL were more likely give correct answers than the lower income groups. However in some circumstances this was reversed. Most notably, those earning 100%-138% FPL were more likely to correctly state that Covered California would provide a means of comparing plans and acquiring coverage.
Several questions consistently showed large sub-group differences in responses. Large differences between insurance groups, age groups, race/ethnicities, and regions were particularly apparent when
respondents were asked if Covered California was a welfare program and whether not acquiring insurance would result in a penalty.
Table 6.
Overall Knowledge of Covered California - Percent Correct by Item and
Insurance Status (n=2,658)
Insurance Status Privately insured Uninsured All 100%-138% FPL 139%-199% FPL 200%-399% FPL 400%+ You will be able to get health insurance throughCovered California even if you have a pre-existing condition. (True)
68% 50% 52% 55% 67% 59%
You can get information, compare plans and get health insurance by simply going online to the Covered California website. (True)
54% 65% 55% 45% 58% 54%
Most people who don’t get health insurance will have
to pay a penalty. (True) 55% 44% 48% 53% 66% 53%
People with lower incomes will pay less for
out-of-pocket costs when they use health care. (True) 53% 55% 42% 48% 48% 48% People with low and moderate incomes will receive a
tax credit to reduce their monthly cost or premium. (True)
40% 33% 39% 36% 41% 38%
Covered California will offer private health insurance
plans that will compete for your business. (True) 41% 27% 35% 35% 44% 37% Covered California is a welfare program. (False) 44% 20% 25% 32% 51% 34% Covered California will offer only government health
insurance plans. (False) 39% 23% 16% 22% 29% 27%
The health plans will meet people’s basic needs but generally won’t be as good as the plans sold elsewhere. (False)
27% 23% 20% 19% 28% 23%
Covered California is the only place low- and
moderate-income people can get tax credits to help to reduce the cost of a health plan. (True)
20% 28% 26% 23% 23% 23%
Covered California will be operated by the health
insurance industry. (False) 29% 22% 14% 21% 26% 22%
For each respondent, a Knowledge Index was calculated as the proportion of the 11 knowledge questions answered correctly. On average, respondents answered 3.8 questions correctly. Among age groups, the highest average knowledge score was found among those ages 55-64. Knowledge did not increase linearly with age, however. Instead, high knowledge scores were found among both the young and the old while the lowest knowledge scores were found among those ages 35-44. Among racial subgroups, Whites, African Americans, and Asians all scored relatively highly (with average correct scores ranges from 4.0-4.2) while Hispanics and Other races/ethnicities showed relatively low knowledge scores (3.4
Both the privately uninsured and the uninsured earning 400%+ FPL demonstrated relatively high knowledge scores (4.3 and 4.4, respectively) while the remaining lower income uninsured had lower relative knowledge scores (3.4-3.6). Little variation in knowledge scores existed geographically with the exception of the San Francisco Bay Area, which scored relatively highly (4.4).
Important Factors in Consumer Decision Making
Consumers were presented with a series of eight facts about Covered California and asked to rate how important these facts would be to them in their decision about whether or not to shop for health insurance at Covered California. The facts are similar to those presented in the knowledge questions discussed above. Essentially, each represents a different reason to purchase health insurance at Covered California. The rating scale ranged from 0 to 10 with 0 indicating not important at all and 10 indicating an extremely important factor in the decision to shop.
Table 7 shows the mean importance rating for each of the eight important factors by insurance status. The most important factor in decision-making across all groups was the new coverage of pre-existing
conditions (an average importance of 8.4). Consumers also reported that the screening of plans for quality 8.2) and the ease of comparing plans (7.9) were very important. Three others ranked as somewhat less important: the choice of private plans available, limits on out of pocket costs and the availability of premium assistance. The least important factor in decision-making was the penalty for those who do not get health insurance (5.8).With minor exceptions, this pattern was seen across all insurance statuses, age, and race/ethnicity, and geographic subgroups.
Table 7.
Important Factors in Consumer Decision Making by Insurance Status
(n=2,658)
Insurance Status Privately insured Uninsured All 100%-138% FPL 139%-199% FPL 200%-399% FPL 400%+ You cannot be denied because of apre-existing condition. 8.7 8.6 8.2 8.2 8.5 8.4
All plans will be screened to make sure they offer the services people need, including preventive care.
8.2 8.8 8.5 7.8 8.2 8.2
It will be easy to compare insurance plans
and select the one that is best for you. 8.0 8.1 7.8 7.9 8.3 7.9 People with lower incomes will also pay
less for out-of-pocket costs when they use health care.
6.6 8.2 8.2 7.4 7.0 7.3
People with low and moderate incomes will receive a tax credit to reduce their monthly cost or premium.
6.5 7.8 8.1 7.3 7.0 7.2
Covered California will offer a number of
private health insurance plans. 7.2 7.5 7.2 7.1 7.3 7.2 The California State Government will
operate Covered California. 5.9 7.5 6.8 6.7 5.9 6.4 Most people who don’t get health insurance
will have to pay a penalty. 5.7 6.2 6.3 5.9 5.2 5.8
A Resonance Index, was computed for all respondents as a measure of how well all the important reasons or arguments resonate with California consumers. The Resonance Indexis the average importance ratings of the eight facts about Covered California.
Overall, the average resonance score was 7.3 (that is, respondents, on average, gave a response of 7.3 to the eight items shown in Table 7). This indicates that the group of reasons or arguments resonates reasonably well with consumers. Little variation was seen in the resonance scores given by different age groups (ranging from 7.2 for those ages 45-54 to 7.5 for those ages 35-44). Slightly more variation was seen by race/ethnicity, insurance status, and region. Hispanics had the highest resonance score (7.6) while Whites and other races/ethnicities had the lowest (6.9). When examined by insurance status, the poorest uninsured had the highest resonance score (7.8) while the privately insured and those earning 200% FPL or more had the lowest resonance score (7.1-7.3). The Los Angeles County region had the highest resonance score (7.5) while the Northern California region had the lowest (6.9).
Purchase Intent
Using details provided by the respondent—in particular their age, income, and the number of people who would covered by their insurance—an estimated monthly premium cost was calculated and presented the respondent2
. After consumers heard the monthly premium cost of obtaining health insurance through Covered California, they were asked about their intent to enroll. This question was asked well into the interview after respondents had learned the facts about Covered California. Based on their responses, we classified consumers into three main categories: committed consumers, who will get health insurance through Covered California as soon as possible, receptive consumers who may get insurance through Covered California, and resistant consumers, who will not get health insurance through Covered California.
Table 8 displays the results. Two-thirds of all consumers were receptive or committed to obtaining health insurance through Covered California. Only 29% were resistant. These data are very positive and suggest that Covered California will be successful in its efforts to enroll consumers in new health plans. Insurance status, age, geographic area and race/ethnicity were each significantly related to purchase intent.
Resistance increased with income with the most resistant respondents being uninsured with 400%+FPL or privately insured (47% and 46% respectively).
By age, the 18 to 25 year old group was the most committed with 33% electing to purchase. Consumers above age 45 were the most resistant with 33% in the 45 to 54 age group and 35% in the 55 to 64 age group refusing to purchase. Hispanic consumers were the most committed of any racial group with 30% committing to purchase whereas White consumers were the most resistant with 39% refusing to purchase. Relatively small differences in the likelihood of purchasing insurance were observed by geographic region. The committed percentage ranged from 18% in the San Francisco Bay Area to 23% in LA County and the Other Southern California Region. Slightly more variation was observed in the percentage resistant, ranging from 25% in the San Francisco Bay Area to 39% in the Other Northern California regions.
Among the receptive, 44% were between 26 and 44 years of age and 42% were Hispanic. Half of all receptive respondents fell within 139% - 399% FPL. In terms of geographic region, 50% lived in LA County or Other Southern CA.
2
Because the premium depended upon age, income, and number household members, a respondent refusing to provide any of this information was not presented an estimated monthly premium.
Table 8.
Among Respondents Who Heard Monthly Premium Cost, Likelihood of
Purchasing Insurance through Covered California by Insurance Status (n=2,592)
Insurance Status Privately insured Uninsured All 100%-138% FPL 139%-199% FPL 200%-399% FPL 400%+ Committed 11% 60% 34% 17% 6% 22% Receptive 41% 33% 52% 60% 41% 47% Resistant 46% 3% 13% 21% 47% 29% Don't know/refused 3% 4% 1% 2% 6% 3%
Purchase Motivations and Barriers
Consumers were asked to provide up to three reasons why they would or would not purchase health insurance through Covered California. In Table 9 we present the motivations among those who are committed to purchasing health insurance by insurance status.
Committed consumers most frequently (41%) cited the money they could save (that it was a “good deal”) as the reason they would purchase health insurance through Covered California. This was the most frequently reported response across all insurance statuses; the percent of respondents who reported this reason ranged from 30% among those earning 100%-138% of the FPL to 73% among the privately insured. Taking advantage of a good deal was also cited as the most important motivator across age, race/ethnicity, and geographic subgroups.
Two other motivations were also important—the desire for the security and peace-of-mind that comes from being insured and satisfying a felt need for coverage and care.
Table 9.
Purchase Motivators among the Committed, by Insurance Status (n=605)
Insurance Status Privately insured Uninsured All 100%-138% FPL 139%-199% FPL 200%-399% FPL 400%+ Take advantage of a good deal 73% 30% 34% 41% 60% 41%Security/peace-of-mind 5% 24% 28% 33% 30% 24%
Need coverage/care 22% 18% 21% 35% 7% 22%
Family benefits 9% 23% 19% 11% 0% 16%
Preventative benefits 2% 19% 12% 14% 0% 12%
Other 17% 8% 12% 9% 9% 11%
Among those resistant to purchasing a plan, cost was by far the most frequently cited barrier (see Table 10). Almost two-thirds (63%) of resistant consumers stated that they would not purchase health insurance through Covered California because it was too expensive. This was the most often reported barrier for all insurance statuses except those earning 100-138%FPL (who would get a fully subsidized plan). Among those earning 100-138% FPL the primary barrier was that they felt they don’t need insurance and that they were concerned about the quality of the plans that would be available. Expense was the most frequently given barrier across age, race/ethnicity, and regions. Among those age 18-25 the lack of need for insurance was also given was a barrier with almost the same frequency as expense (46% and 48% respectively). Opposition to the ACA and concern about plan quality did not emerge as significant barriers within the sample as a whole.
Table 10.
Purchase Barriers among the Resistant, by Insurance Status (n=724)
Insurance Status Privately insured Uninsured All 100%-138% FPL 139%-199% FPL 200%-399% FPL 400%+ Too expensive 60% 0% 49% 77% 71% 63% Don't need it 29% 42% 37% 18% 13% 25%
Concern about quality of
plans 15% 39% 9% 1% 12% 12%
Oppose ACA 3% 4% 5% 6% 1% 3%
Other reasons 2% 1% 9% 3% 4% 3%
Don't know how to apply 1% 0% 4% 1% 0% 1%
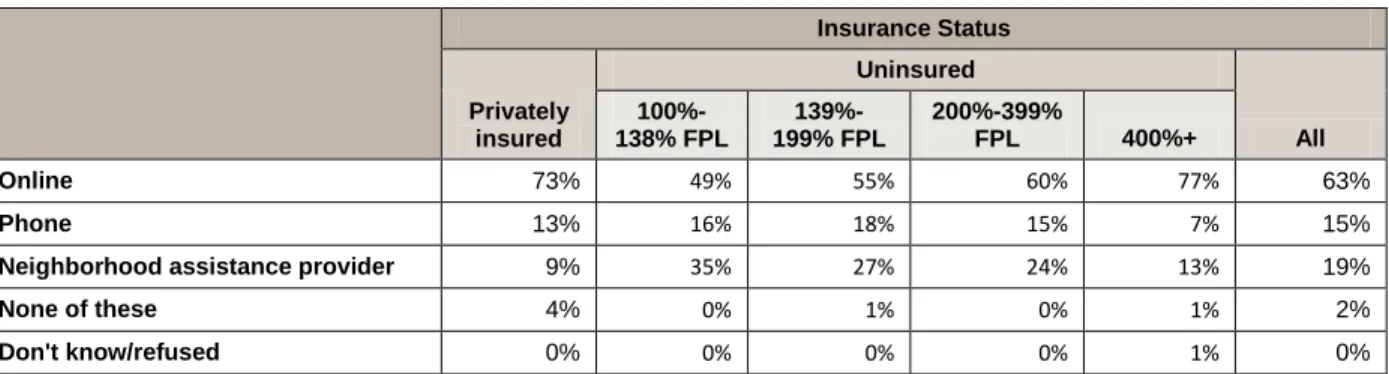
Covered California Access Preferences
Consumers were asked how they would prefer to shop for health insurance through Covered California. The majority of consumers (63%) preferred to shop online, 19% preferred to shop at a Neighborhood assistance provider and 15% preferred to shop by phone (see Table 12). Insurance status, age, geographic area and race/ethnicity were each significantly related to access preference. The percentage of
respondents preferring the Internet to access Covered California increased as income increased and decreased with age. Young consumers ages 18-25 reported the highest preference for online shopping (71%); however the majority of each age group also preferred the online option. Among race/ethnicity subgroups, Whites were most likely to want to access Covered California via the Internet (74%) while 53% of Hispanics wished to use the Internet. Little variation existed with respect to Internet preferences geographically, with 63% or more preferring to shop online in all regions.
Table 11
.
Covered California Access Preference by Insurance Status (n=2,658)
Insurance Status Privately insured Uninsured All 100%-138% FPL 139%-199% FPL 200%-399% FPL 400%+ Online 73% 49% 55% 60% 77% 63% Phone 13% 16% 18% 15% 7% 15%
Neighborhood assistance provider 9% 35% 27% 24% 13% 19%
None of these 4% 0% 1% 0% 1% 2%
Don't know/refused 0% 0% 0% 0% 1% 0%
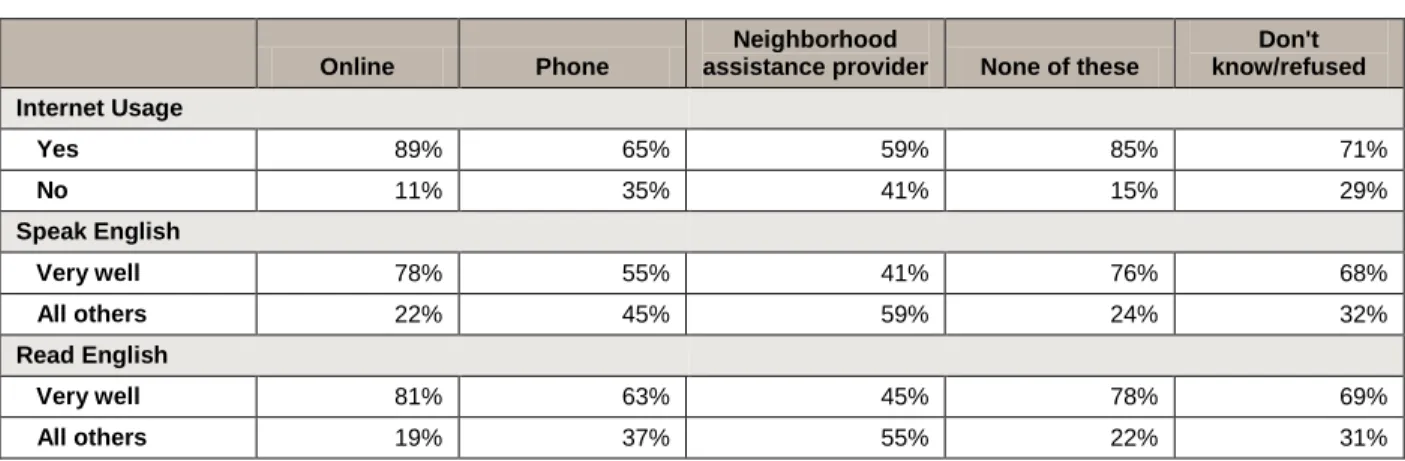
In Table 13 we show Internet usage and English fluency by the preferred mode of contact with the exchange. Internet usage, speaking and reading English were all significantly related to access preference. Of those consumers who prefer to go online to shop for health insurance, 89% also use the Internet to shop or pay bills, 78% speak English very well and 81% read English very well. Consumers who prefer to use a neighborhood assistance provider are more equally distributed across Internet usage and proficiency in speaking and reading English. These findings indicate that Internet usage and English proficiency are important factors in consumers’ preference to shop online.
Table 12.
Covered California Access Preference by Internet Usage (n=2,494) and
English Proficiency (n=2,756)
Online Phone
Neighborhood
assistance provider None of these
Don't know/refused Internet Usage Yes 89% 65% 59% 85% 71% No 11% 35% 41% 15% 29% Speak English Very well 78% 55% 41% 76% 68% All others 22% 45% 59% 24% 32% Read English Very well 81% 63% 45% 78% 69% All others 19% 37% 55% 22% 31%
Segmentation Analysis
Overview of the Segments of Uninsured Californians
The NeuroClustersm analysis identified seven segments of uninsured eligibles based on a wide array of psychographic, attitudinal and demographic variables. Uninsured eligibles represent an estimated 2,000,805 adults, or approximately 66% of all uninsured California adults and 44% of the combined market of uninsured and privately insured California adults.
Non-English-Speaking Families/Seldom Online comprise the largest single
segment of California uninsured eligibles. This segment consists primarily of non-English-speaking families who are infrequent Internet users. The Mostly Hispanic/Seldom Online are also predominately Hispanic, but they are much more proficient in English than the
Non-English-Speaking Families/Seldom Online. More fully English proficient and online active Hispanics are represented in all of the other segments, particularly the
Realistic and Motivated and the Self-Sufficient but Open to Change. These two segments, along with the At Risk and Denied Insurance, the majority of whom are over 55 years of age, comprise the three “older” segments.
The other four segments are “young,” in that majorities are under 35 years of age. The youngest segments are the Risk Takers and the Risk Deniers. These two segments do not think they need health insurance because they are healthy and self-sufficient. In this, they bear a striking resemblance to the “Young Immortals” or “Invincibles” identified in some other state studies. However, this segmentation shows one cannot equate youth with resistance to health insurance: Two of the young segments – the Realistic and Motivated and the Self-Sufficient but Open to Change – have positive attitudes toward health insurance.