CHARACTERIZATION OF THE WATER TRANSPORT PROPERTIES OF THE ACTIVE LAYERS OF POLYAMIDE REVERSE OSMOSIS AND NANOFILTRATION MEMBRANES
Lin Lin
A dissertation submitted to the faculty at the University of North Carolina at Chapel Hill in partial fulfillment of the requirements for the degree of Doctor of Philosophy in the Department
of Environmental Sciences and Engineering in the Gillings School of Global Public Health.
Chapel Hill 2015
© 2015 Lin Lin
ABSTRACT
Lin Lin: Characterization of the Water Transport Properties of the Active Layers of Polyamide Reverse Osmosis and Nanofiltration Membranes
(Under the direction of Orlando Coronell)
The overall objective of this study was to elucidate which parameter among water partitioning, water diffusion and active layer thickness accounts for the differences in water permeability among polyamide reverse osmosis (RO) and nanofiltration (NF) membranes. To achieve this overall objective, the following specific objectives were pursued: (i) to identify appropriate methods (facile and accurate) for measuring active layer thickness in RO/NF
membranes; (ii) to ascertain the existence of voids within the polyamide active layers of RO/NF membranes and develop methods to quantify void volume fraction in active layers; (iii) to measure the partition coefficient of water into membrane active layers, and calculate the diffusion coefficient of water in active layers based on measurements of membrane water permeability (A), active layer thickness (), and water partition coefficient (K); and (iv) to
correlate membrane water permeability (A) to active layer thickness (), water partition
coefficient (K) and water diffusion coefficient (D) for a group of polyamide RO/NF membranes with a broad range of performance levels.
ACKNOWLEDGEMENTS
I would like to express my deepest gratitude to my advisor, Dr. Orlando Coronell. In the past five years, Orlando has always been very supportive and helpful to me. He has provided me with so much guidance, expertise and assistance during the course of my doctoral studies. I simply cannot imagine a better advisor.
I would also like to give special thanks to Dr. Thomas Clegg, who has not only been very supportive but also has educated me so much about the Rutherford backscattering spectrometry which is a very important technique in my research, since the very first week of my Ph.D. studies.
I am also very grateful to Dr. Rene Lopez for teaching me about and helping me with ellipsometry. Rene has provided me with many valuable suggestions during our discussion about applying ellipsometry in membrane research.
I would also like to express my great appreciation to Dr. Michael Aitken, Dr. Gregory Characklis and Dr. Prasun Dewan for being part of my Ph.D. committee and for providing insightful feedback that have helped me improve my research and my dissertation. Their expertise in chemical and biological processes in the environment, management of water resource, treatment and supply, and computer science has enriched my doctoral studies.
the help from Chuan Wang, Panitan Jutaporn, Ariel Atkinson, Kasia Grzebyk, Alex Gorzalski, John Gilles, Mikayla Armstrong in the Coronell research group.
Special thanks to Dr. Carrie Donley, Wallace Ambrose, Dr. Hugon Karwowski, John Dunham, Grayson Rich, Amar Kumbhar, Dr. Yang Liu, Dr. Yingchi Liu, Dr. Robert Geil for all their generous help on the characterization techniques used in this dissertation.
TABLE OF CONTENTS
LIST OF TABLES……….xii
LIST OF FIGURES………...………...xiii
LIST OF ABBREVIATIONS………xviii
LIST OF SYMBOLS………xix
CHAPTER 1: INTRODUCTION ... 1
1.1 BACKGROUND AND MOTIVATION ... 1
1.1.1 The importance and structure of polyamide reverse osmosis and nanofiltration membranes ... 1
1.1.2. Mechanisms of water and solute permeation through TFC membranes ... 2
1.1.3 State of the art of measurements of partition and diffusion coefficients in active layers ... 5
1.1.4. State of the art of measurements of active layer thickness ... 7
1.1.5. Void and nodular structures within active layers ... 9
1.1.6 Gaps in the literature regarding the mechanisms of water transport through active layers ... 11
1.2. OBJECTIVES ... 12
1.2.1. Overall Research Goal ... 12
1.2.2. Specific Objectives ... 12
1.3 Dissertation Organization ... 12
REFERENCES ... 15
2.1 Introduction ... 18
2.2. Materials and Methods ... 23
2.2.1. Target membranes ... 23
2.2.2. Membrane sample preparation for active layer thickness measurements ... 23
2.2.3. SEM analyses ... 24
2.2.4. TEM analyses ... 25
2.2.5. AFM analyses ... 25
2.2.6. RBS analyses ... 26
2.2.7. QCM analyses ... 26
2.2.8. Profilometry analyses ... 27
2.2.9. Ellipsometry analyses ... 27
2.3. Results and Discussion ... 28
2.3.1. Thickness measurements with SEM and TEM ... 28
2.3.2. Thickness measurements with AFM and profilometry ... 33
2.3.3. Thickness measurements with RBS and QCM ... 39
2.3.4. Thickness measurements with ellipsometry ... 46
2.3.5. Comparison of thickness values obtained with different analytical techniques ... 51
2.3.6. Active layer density ... 55
2.4. Conclusions ... 58
2.5. Acknowledgments... 60
REFERENCES ... 62
CHAPTER 3: INVESTIGATING THE VOID STRUCTURE OF THE POLYAMIDE ACTIVE LAYERS OF THIN-FILM COMPOSITE MEMBRANES ... 70
3.2.2. TEM analyses ... 73
3.2.3. Scanning transmission electron microscopy-energy dispersive X-ray spectroscopy (STEM-EDS) and electron energy loss spectroscopy (STEM-EELS) analyses ... 74
3.2.4. SEM analyses ... 74
3.2.5. Active layer isolation ... 74
3.2.6. QCM analyses ... 75
3.2.7. Ellipsometry analyses ... 76
3.2.8. AFM analyses ... 76
3.3. Results and Discussion ... 77
3.3.1. Presence of globular features in active layers ... 77
3.3.2. Volume fraction of active layer accounted for by globular features from TEM image analyses ... 78
3.3.3. Void volume fraction from water uptake measurements. ... 80
3.3.4. Void fraction from refractive indices ... 86
3.3.5. Effect of membrane surface roughness and active layer thickness on void fractions estimated by water uptake and refractive index measurements ... 90
3.3.6. Size and interconnectivity of voids ... 91
3.3.7. Implications on RO/NF science and technology ... 93
3.4. Conclusion ... 94
3.5. Acknowledgments... 95
3.6. Supporting Information Available ... 96
REFERENCES ... 97
CHAPTER 4: CORRELATION OF ACTIVE LAYER THICKNESS, WATER PARTITIONING AND WATER DIFFUSIVITY TO THE WATER PERMEABILITY OF POLYAMIDE THIN-FILM COMPOSITE MEMBRANES ... 104
4.1. Introduction ... 104
4.2.1. Membranes and Sample Preparation ... 108
4.2.2. Water Permeation Tests ... 109
4.2.3. Ellipsometry Analyses ... 110
4.2.4. QCM Analyses ... 110
4.2.5. TEM Analyses ... 112
4.3. Results and Discussion ... 112
4.3.1. Correlation between water permeability and intensive and extensive properties of membrane active layer ... 112
4.3.2. Effective and Polyamide Water Partition Coefficients ... 122
4.3.3. Effective and Polyamide Water Diffusion Coefficients. ... 125
4.3.4. Correlation between water permeability (𝐴) and the water partition (𝐾) and diffusion (𝐷) coefficients in polyamide active layers ... 129
4.3.5. Correlation between void fraction (𝑓𝑣𝑜𝑖𝑑) and water permeance (𝑃), water partition coefficient (𝐾) and water diffusion coefficient (𝐷) ... 130
4.4. Conclusion ... 132
4.5. Acknowledgements ... 135
REFERENCES ... 136
CHAPTER 5: CONCLUSIONS ... 140
CHAPTER 6: FUTURE WORK ... 144
APPENDIX 1: RESULTS OF TRANSMISSION ELECTRON MICROSCOPY (TEM) ANALYSES OF ACTIVE LAYER THICKNESS ... 146
APPENDIX 2: RESULTS OF SCANNING ELECTRON MICROSCOPE (SEM) ANALYSES OF ACTIVE LAYER THICKNESS ... 155
APPENDIX 3: RESULTS OF RUTHERFORD BACKSCATTERING SPECTROMETRY (RBS) ANALYSES OF ACTIVE LAYER THICKNESS ... 164
APPENDIX 6: RESULTS OF PROFILOMETRY ANALYSES OF ACTIVE LAYER THICKNESS... 194 APPENDIX 7: RESULTS OF ELLIPSOMETRY ANALYSES OF ACTIVE LAYER THICKNESS... 212 APPENDIX 8: SUPPORTING INFORMATION FOR CHAPTER 3 ... 214 APPENDIX 9: RESULTS OF TRANSMISSION ELECTRON
MICROSCOPY (TEM) ANALYSES OF ACTIVE LAYER NODULE FRACTION ... 237 APPENDIX 10: RESULTS OF QUARTZ CRYSTAL MICROBALANCE (QCM)
LIST OF TABLES
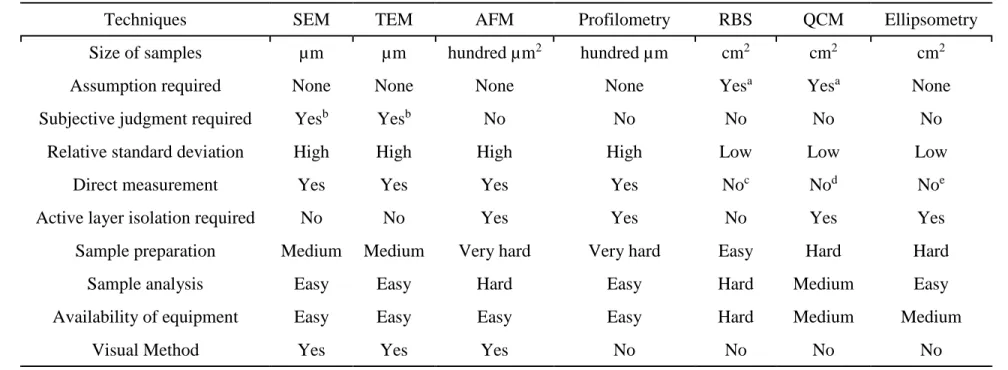
Table 2.1 - Advantages and disadvantages of SEM, TEM, AFM, profilometry, RBS, QCM and ellipsometry as analytical techniques for the measurement of active layer thickness of RO/NF membranes………...32 Table 3.1 - Polymer mass (mAL), water uptake in humidified nitrogen (mv), water
uptake in liquid water (ml), thickness (), and refractive index at 589 nm (nAL)
of membrane active layers……….83 Table 4.1 - Permeability coefficient (𝐴), active layer thickness (δAL), areal
mass of active layer (mAL), water uptake humidified (96% RH) nitrogen
gas (mv), water uptake in liquid water (ml) and volume fraction of voids (fvoid)
for five commercial polyamide RO/NF membranes………115 Table 4.2 - Active layer thickness (δAL), polymer thickness of active layer (δP),
active layer permeance (PAL), polymer permeance of active layer (PP),
effective water partition coefficient into active layer (KAL), water partition
coefficient into active layer polymer (KP), water partition coefficient into active
layer polymer ignoring voids (KP’), effective water diffusion coefficient
in active layer (DAL), water diffusion coefficient in active layer polymer (DP)
and water diffusion coefficient in active layer polymer ignoring voids (DP’)
LIST OF FIGURES
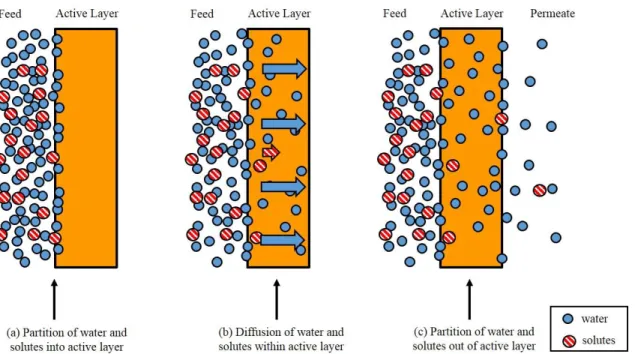
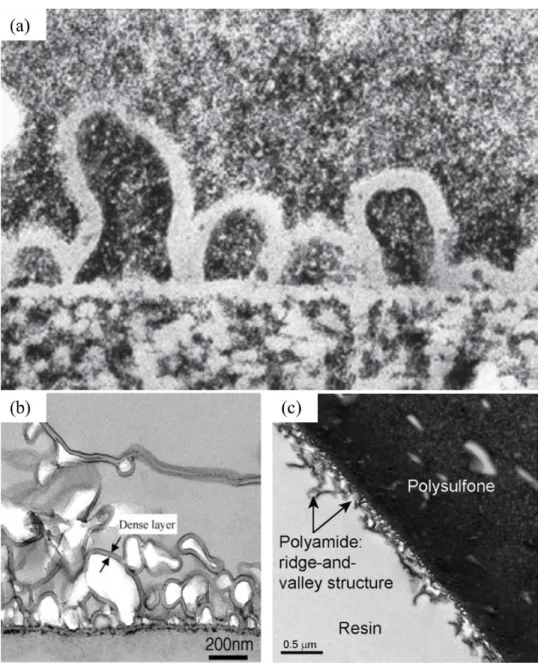
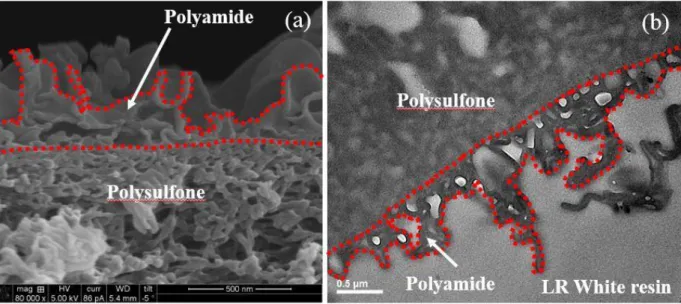
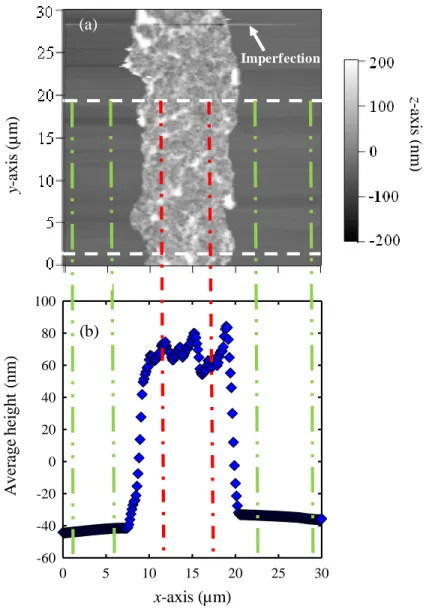
Figure 1.1 - Permeation of water and solutes through membrane active layers as described by the solution-diffusion model. The permeation process consists of three steps: water and solute molecules (a) dissolve into the active layer at the feed-membrane interface, then (b) diffuse through the active layer, and finally (c) partition out of the active layer into the permeate………4 Figure 1.2 - (a) A dark-field TEM image of a membrane cross-section that shows the protuberances of the ridge-and-valley structure and apparent voids within it. (b) A bright-field TEM image of the cross-section of a membrane prepared by interfacial polymerization that shows the apparent voids. (c) A bright-field TEM image of the cross-section of an ESPA3 membrane sample which shows the proposed nodular base of the active layer and the ridge-and-valley structure ……….10 Figure 2.1 - Representative (a) SEM and (b) bright-field TEM images of the cross section of a SWC4+ membrane sample. In both images, the active layers are outlined in red. The SEM and TEM images do not correspond to the same cross section………...30 Figure 2.2 - (a) An AFM image and (b) the corresponding average height profile of an NF90 membrane. At each specific x-axis location, the average height data in (b) was calculated as the average of height for all locations in (a) with the same x-axis value and different y-axis values between the two white dashed lines. The average height of the active layer was calculated as the mean of the height values in (b) between the two red dash-dotted lines. The average height of the silicon substrate was calculated as the mean of the height values in (b) between the two (green) long-dashed lines on the left and on the right. The active layer thickness was calculated as the difference between the average height of the active layer and the average height of the silicon substrate. The average thickness of the active layer for this sample was 110.316.3 nm. Imaging imperfections are observable discontinuities on the images caused by the high
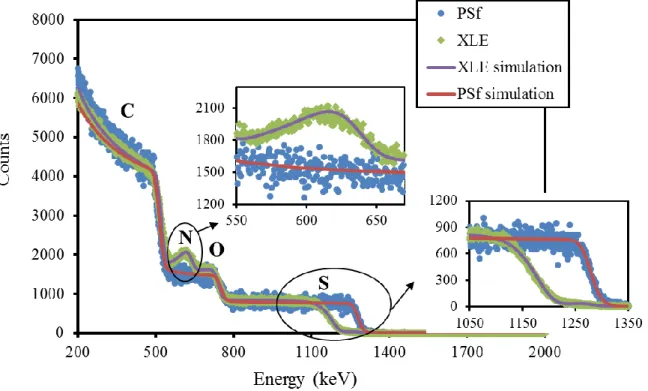
Figure 2.4 - Representative RBS experimental data (symbols) and
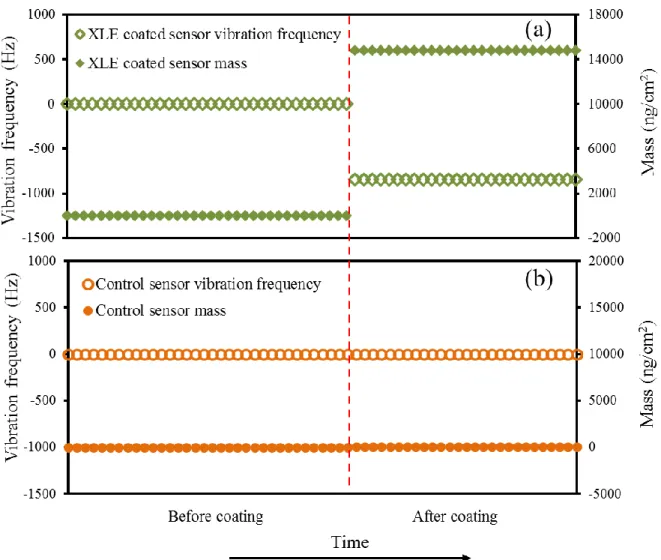
corresponding simulations (lines) for the polysulfone support (blue circles) and the XLE membrane (green diamonds). The polysulfone support contains H, C, O and S and the active layer contains H, C, N and O. The N and S signals are enlarged to show the differences between the spectrum of the support layer and the spectrum of the full polyamide membrane. The atomic areal density of the polyamide active layer obtained from the XLE spectrum in the figure is 1.15×10¹⁸ atoms·cm-2 and the corresponding thickness is 135.9 nm………41 Figure 2.5 - Representative vibration frequency and calculated areal mass change of (a) a QCM test sensor before and after coating with the active layer of a XLE membrane sample, and (a) a QCM control sensor. The vibration
frequency of the test sensor declined 843.9 Hz after coating with the XLE active layer, which indicates an addition of 14,801 ng·cm-2 to the areal mass of the sensor. The vibration frequency of the control sensor decreased 3.9 Hz in the second run compared to in the first run, which corresponds to an
estimated uncertainty of 68 ng·cm-2 (<0.5%) in the areal mass measurements. This areal mass variability is likely to be caused by minor differences in the
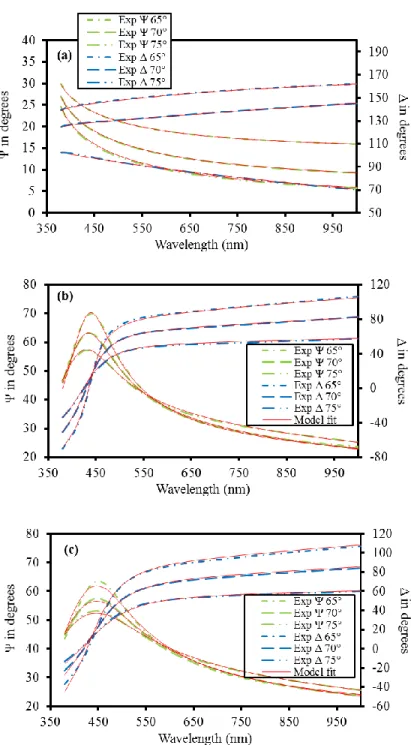
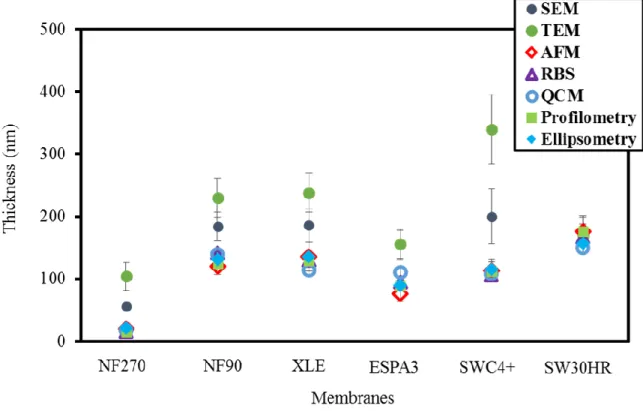
placement of the sensor in the microbalance chamber between runs………44 Figure 2.6 - Representative experimental (interrupted lines) and simulated (red continuous lines) ellipsometry spectra of isolated active layers on silicon wafers for the (a) NF270, (b) ESPA3, and (c) SWC4+ membranes. Data acquisition was conducted at incidence angles of 65°, 70° and 75°. The mean squared errors of the three fits shown are 0.91, 3.39 and 4.41, respectively. In ellipsometry analysis, mean squared errors lower than 20 are typically desired………..49 Figure 2.7 - Measured thicknesses of the active layers of the NF270, NF90, XLE, ESPA3, SWC4+ and SW30HR membranes obtained by SEM, TEM, AFM, RBS, QCM, profilometry and ellipsometry analyses. For each membrane, the reported thickness value and corresponding error represent the average and
standard deviation, respectively, for multiple samples. The thickness values obtained with the five techniques that produced consistent results among each other (i.e., AFM, RBS, QCM, profilometry and ellipsometry) ranged from
14.44.7 nm (NF270) to 176.324.5 nm (SW30HR)………54 Figure 2.8 - Mass densities of the six membranes studied calculated using the areal masses obtained from QCM analyses and thicknesses from ellipsometry analyses. The red dashed line represents the density estimate in the literature (1.24 g·cm-3) for polyamide active layers. The active layer density averaged
Figure 3.1 - Cross-sectional TEM and SEM images of samples of the (a,b) NF90, (c,d) ESPA3, and (e,f) SWC4+ membranes. For any given membrane, the TEM and SEM images do not correspond to the exact same cross section. The
perimeter of the active layers of all membranes is outlined in red dotted lines, and examples of globular features (i.e., nodules/voids) in the active layers are
indicated by arrows for the NF90 membrane. The nodules/voids are also visible
in the images of the ESPA3 and SWC4+ membranes………...79 Figure 3.2 - Feature volume fractions ( ffeaturevolume) and void volume fractions (fvoid)
in the active layers of five commercial polyamide thin-film composite
membranes. Feature volume fractions (empty bars) were obtained from analyses of TEM cross-sectional images. Void volume fractions were obtained using
(i) water uptake measurements with a QCM and Equation 3.3 (blue brick bars), and (ii) refractive index estimates by spectroscopic ellipsometry and Equations 4
(parallel model, solid red bars) and 5 (series model, cross hatched yellow bars). For each membrane, the reported values were obtained as follows. The feature
volume fraction corresponds to the average of the values obtained for triplicate images. The void volume fraction from water uptake measurements corresponds to the average of the values obtained for duplicate samples (1.54 cm2 each), where duplicate measurements were taken in each sample. The void fraction from refractive index measurements corresponds to the average of the values obtained for triplicate samples, where three locations (0.3 cm2 each) were analyzed in each sample. The error bars for the feature volume fractions represent standard
deviation. All other error bars represent the propagated error obtained in
calculations using the uncertainties in Table 3.1………...81 Figure 3.3 - Illustration of an isolated polyamide active layer when exposed to
dry nitrogen (top), water vapor via humidified nitrogen gas (bottom left) and liquid water (bottom right). When the active layer is exposed to humidified nitrogen gas, nitrogen and water partition into the polyamide phase and the voids saturate with humidified nitrogen. In contrast, when the active layer is exposed to liquid water, water partitions into the polyamide phase and bulk water, not humidified gas, fills the voids within the active layer. Any potential gaps
existing between the isolated active layers and sensor surfaces due to the roughness of the active layer were shown to not affect the active layer void fractions
estimated from QCM and ellipsometry analyses………...85 Figure 3.4 - Dark-field STEM image (left), and corresponding nitrogen and
sulfur (middle) and carbon (right) STEM-EDS mappings, of a cross section of
Figure 3.5 - Representative (a) dark-field STEM image and (b) corresponding nitrogen EELS mapping of a cross-section of the active layer of a SWC4+ RO membrane sample. The red area in the EELS mapping corresponds to regions containing nitrogen which is present in polyamide. The dark area within the red area corresponds to a localized region where nitrogen content is significantly lower (or absent) compared to the surrounding polyamide, therefore indicating
the presence of a void………89 Figure 3.6 - (a) Water uptake when the active layer is exposed to liquid water (ml)
normalized by active layer polymer mass (mAL), and (b) refractive index as a
function of root-mean-square membrane surface roughness () normalized by active layer thickness (). The calculated roughness values for the NF90, XLE, ESPA3, SWC4+, and SW30HR membranes were 104±38, 63±11, 102±6, 125±7, and 80±2, respectively. Error bars represent the propagated error obtained in calculations using the roughness uncertainties reported above and the uncertainties
for all other parameters reported in Table 3.1………92 Figure 4.1 - (a) Membrane water permeability (𝐴) as a function of thickness of
membrane active layer (effective active layer thickness 𝛿𝐴𝐿 and polymer thickness 𝛿𝑃), and (b) membrane water permeability (𝐴) as a function of permeance of active layer (effective active layer permeance 𝑃𝐴𝐿 and polymer permeance 𝑃𝑃) of five commercial polyamide RO/NF membranes. Error bars for 𝐴 and 𝛿𝐴𝐿 represent the uncertainties of the two and three measurements, respectively, for each membrane. Error bars for 𝛿𝑃, 𝑃𝐴𝐿 and 𝑃𝑃 represent propagated errors obtained in calculations using Equations 4.6, 4.3 and 4.8,
respectively, and the uncertainties in Table 4.1………...117 Figure 4.2 - Effective water permeance (PAL), water partition coefficient (KAL),
water diffusion coefficient (DAL) and thickness (δAL) of membrane active layer,
and water permeance (PP), water partition coefficient (KP), water diffusion
coefficient (DP) and thickness (δP) of active layer polymer (polyamide)………121
Figure 4.3 - (a) Active layer permeance (effective permeance 𝑃𝐴𝐿 and polymer permeance 𝑃𝑃) as a function of the water partition coefficient into the active layer (effective partition coefficient 𝐾𝐴𝐿and polymer partition coefficient 𝐾𝑃), and (b) active layer permeance (effective permeance 𝑃𝐴𝐿 and polymer
permeance 𝑃𝑃) as a function of the water diffusion coefficient in the active layer (effective diffusion coefficient 𝐷𝐴𝐿and polymer diffusion coefficient 𝐷𝑃) of five commercial polyamide RO/NF membranes. Error bars for 𝑃𝐴𝐿, 𝐾𝐴𝐿 and
𝐷𝐴𝐿 represent propagated errors obtained in calculations using Equations 4.3, 4.9 and 4.12, respectively, and the uncertainties in Tables 4.1 and 4.2. Error bars for 𝑃𝑃, 𝐾𝑃 and 𝐷𝑃 represent propagated errors obtained in calculations using
Figure 4.4 - (a) Active layer permeance (effective permeance 𝑃𝐴𝐿 and polymer permeance 𝑃𝑃) as a function of void fraction of the active layer, (b) water partition coefficient into the active layer (effective partition coefficient 𝐾𝐴𝐿and polymer partition coefficient 𝐾𝑃) as a function of void fraction of the active layer, and (c) water diffusion coefficient in the active layer (effective diffusion coefficient 𝐷𝐴𝐿and polymer diffusion coefficient 𝐷𝑃) as a function of void fraction of the active layer. Error bars for void fractions of the NF90, XLE, ESPA3 and SWC4+ membranes represent propagated
errors obtained in calculations using Equation 4.5 and uncertainties in Table 4.1. The error bar for the void fraction of the SW30HR membrane represents the
uncertainty of three measurements from TEM analyses. Error bars for permeance, water partition coefficients and water diffusion coefficients were obtained as
LIST OF ABBREVIATIONS
AFM Atomic force microscopy
NF Nanofiltration
QCM Quartz crystal microbalance
RBS Rutherford backscattering spectrometry
RH Relative humidity
RO Reverse osmosis
SEM Scanning electron microscopy
STEM-EDS Scanning transmission electron microscopy-energy dispersive X-ray spectroscopy
STEM-EELS Scanning transmission electron microscopy-electron energy loss spectroscopy
TEM Transmission electron microscopy
LIST OF SYMBOLS
A Water permeability coefficient B Solute permeability coefficient
C Water concentration
Cfeed Solute concentration in feed
Cpermeate Solute concentration in permeate
DAL Water diffusion coefficient of active layer
DP Water diffusion coefficient of active layer polymer
DP’ Water diffusion coefficient of active layer polymer ignoring voids
δAL Active layer thickness
δP Thickness of active layer polymer Δp Applied trans-membrane pressure Δπ Trans-membrane osmotic pressure fvoid Volume fraction of voids
Jsolute Solute flux
Jwater Water flux
KAL Water partition coefficient of active layer
KP Water partition coefficient of active layer polymer
KP’ Water partition coefficient of active layer polymer ignoring voids
mAL Areal mass of active layer
ml Water uptake in liquid water
mv Water uptake in humidified nitrogen
nAL Refractive index of active layer
npolymer Refractive index of active layer polymer
PAL Water permeance of active layer
PP Water permeance of active layer polymer
R Ideal gas constant
Surface roughness of membrane
T Temperature
CHAPTER 1: INTRODUCTION 1.1 BACKGROUND AND MOTIVATION
1.1.1 The importance and structure of polyamide reverse osmosis and nanofiltration membranes
Reverse osmosis (RO) and nanofiltration (NF) are pressure-driven permeation processes which remove unwanted substances (i.e., solutes) from feed solutions. The removal of the solutes is achieved with the semi-permeability of RO/NF membranes that allows preferential permeation of solvent (i.e., water for RO/NF processes) over solutes. The preferential permeation of solvent leads to dilution of the solutes on the permeate side and effectively constitutes solute removal.1 RO and NF membranes are widely used to produce drinking water from various source waters, including seawater, groundwater and recycled water.2–4 RO/NF membranes are among the most important technologies to address the rising fresh water scarcity problems around the world because they are very effective in removing a very broad range of solutes in water.1,2,5 Besides producing drinking water, RO and NF membranes have also been used for a variety of other applications including energy production, food processing,
biotechnology, beverage industry, etc.1,6
In RO and NF processes, two important aspects of membrane performance are solute rejection and solvent flux (i.e., water flux for water purification applications).5 Solute rejection is an indicator of the quality of the water produced, since higher solute rejection corresponds to lower solute concentration in the water produced. Water flux, characterized through the
increased water permeability of membranes has reduced the costs of RO/NF processes by more than 10 times.7 However, even after more than 50 years of membrane research since Loeb and Sourirajan developed the first successful RO membrane, and even with the widespread use of RO/NF membranes around the world, energy consumption still remains as a major disadvantage of RO/NF processes. 1,7–9 Therefore, comprehensive research about the factors that determine water permeability in RO/NF membranes is needed to further reduce the associated energy costs. The market of RO and NF membranes for water purification has been dominated by thin-film composite (TFC) membranes since the development of the Loeb-Sourirajan membrane in
1960.8,9 TFC membranes usually have a three-layer structure, with an ultrathin active layer (~20 – 200 nm) on top of an intermediate porous support layer (~20-50 µm) and a backing fabric layer
(~300 µm).5,7 The active layer, support layer and backing layer are commonly made of polyamide, polysulfone and polyester, respectively. The polyamide active layer controls the permeation of water and solutes through the membrane,5,10 while the other two layers mainly provide physical support to the active layer.
1.1.2. Mechanisms of water and solute permeation through TFC membranes
In RO and NF processes, the performance of the membrane in terms of water production is described by the flux of water that permeates the membrane. According to the solution-diffusion model, the water flux (𝐽𝑤𝑎𝑡𝑒𝑟) is described by 11
𝐽𝑤𝑎𝑡𝑒𝑟 = 𝐴 (∆𝑝 − ∆𝜋) , (1.1)
where 𝐴 (m·s-1·Pa-1) is the water permeability coefficient of the membrane (i.e., of the active layer), ∆𝑝 (Pa) is the applied trans-membrane pressure, and ∆𝜋 (Pa) is the trans-membrane osmotic pressure. According to Equation 1.1, a high water permeability coefficient is a desired active layer property, because a higher water permeability coefficient (𝐴) allows for achieving a higher water flux at a reduced applied pressure (∆𝑝), and thus at reduced energy costs.
The performance of the membrane in terms of solute removal is described by the solute rejection (𝑅) as calculated by
𝑅 = 1 −𝑐𝑝𝑒𝑟𝑚𝑒𝑎𝑡𝑒
𝑐𝑓𝑒𝑒𝑑 , (1.2)
where 𝑐𝑓𝑒𝑒𝑑 (mol·m-3) and 𝑐𝑝𝑒𝑟𝑚𝑒𝑎𝑡𝑒 (mol·m-3) are the solute concentrations in the feed and permeate water, respectively. The solute concentration in the permeate water is both a function of and determines the solute flux as given by11
where 𝐵 (m·s-1) is the solute permeability coefficient. From Equations 1.1-1.3, solute rejection can also be expressed as
𝑅 =𝐴 (∆𝑝− ∆𝜋)+𝐵𝐴 (∆𝑝− ∆𝜋) . (1.4)
Equation 1.4 shows that the water permeability coefficient not only determines the rate of water production, but also strongly affects the quality of the water produced. Therefore, it is very important to understand the water permeability of membrane active layers for improvement of membrane performance in terms of both quality and rate of permeate water production. According to the solution-diffusion model, the water permeability coefficient is given by11
𝐴 = 𝐷𝐾𝛿 𝐶𝐻2𝑂𝑣
𝑅𝑇 , (1.5) where 𝐾 (-) is the partition coefficient of water into the active layer, 𝐷 (m2·s-1) is the diffusion coefficient of water within the active layer, 𝛿 (nm) is the thickness of the active layer, 𝐶𝐻2𝑂
(mol·m-3) is the molar concentration of bulk water, 𝑣 (m3·mol-1) is the molar volume of liquid water, 𝑅 (m3·Pa·K-1·mol-1) is the ideal gas constant, and 𝑇 (K) is the absolute temperature. While 𝐶𝐻2𝑂, 𝑣, 𝑅 and 𝑇 are either constants or operational parameters, the properties of the
membranes that affect the water permeability are the partition coefficient, the diffusion
coefficient and the thickness of the active layer. Thus, to understand which membrane properties (𝐾, 𝐷 and/or 𝛿) should be targeted in membrane development towards the production of
improved membranes, one must understand the relative importance of 𝐾, 𝐷 and/or 𝛿 in the overall water permeability of existing membranes.
1.1.3 State of the art of measurements of partition and diffusion coefficients in active layers
membranes) have characterized water partitioning into active layers by measuring water uptake by polyamide active layers of commercial RO/NF membranes. Zhang et al.12 obtained water uptake values of 11.2 wt% and 12.8 wt% for the FT30 RO and LF10 RO membranes,
respectively, and Lee et al.13 obtained water uptake of 20.1 wt% for the SW30 RO membrane, which was approximately 57-80% higher than the water uptake obtained by Zhang et al. Both studies have focused only on RO membranes.
Zhang et al. and Lee et al. also calculated the diffusion coefficients of water within membrane active layers using Equation 1.5, and their corresponding water permeability, water uptake and active layer thickness results.12,13 While Zhang et al. reported calculated diffusion coefficients of 0.8×10⁻⁹ m2·s-1 and 1.2×10⁻⁹ m2·s-1 for the FT30 RO and LF10 RO membranes, respectively,12 Lee et al obtained a significantly lower diffusion coefficient value of 0.43×10⁻⁹ m2·s-1 for the SW30 RO membrane.13 The diffusion coefficient of water in polyamide active layer has also been studied through atomistic simulations mimicking the active layer of the FT30 RO membrane with values of 0.71-0.85 ×10⁻⁹ m2/s being reported.14 The diffusion coefficient values calculated with atomistic simulations14 were comparable to the values obtained by Zhang et al,12 but 98% higher than the value obtained by Lee et al.13 No direct measurement of the diffusion coefficient of water within polyamide active layers of RO/NF membrane has been reported in the peer-reviewed literature. All three studies discussed above focused only on RO membranes.
similarly performing membranes. Thus, there is a need for further characterization studies of water partitioning and diffusion in active layers to fully understand the range of partition and diffusion coefficients values throughout the whole spectrum of RO/NF membranes (i.e., seawater RO, brackish water RO, NF).
It is important to note that a major reason why there are so few studies of partitioning and diffusion in active layers in the peer-reviewed literature is the experimental difficulties in
characterizing material properties and phenomena occurring in the bulk region of active layers. Given that the active layers of TFC membranes have thicknesses on the nanometer scale and account for less than 0.1% of the total thickness of the membranes, nanoscale spatial resolution is required in any experimental procedure intended to probe the bulk region of the active layer. The extreme thinness of the active layers also results in an exceptionally small time scale of diffusion of water in the active layer (~10–5 s) (i.e., the average time that it takes a water molecule to diffuse through the active layer), which makes measuring water diffusion coefficients experimentally extremely difficult, and so far not possible.
1.1.4. State of the art of measurements of active layer thickness
Unfortunately, there is also a need to verify that the methods that are being used in the literature to measure active layer thickness (𝛿) provide accurate measurements. Several
techniques that have been used in the literature include scanning electron microscope (SEM),15–18 transmission electron microscopy (TEM),15,19,20 atomic force microscopy (AFM)21,22 and
Rutherford backscattering spectrometry (RBS).12,15,23–26
Thickness measurements with SEM and TEM for RO/NF membranes are based on image analysis of cross-sectional electron micrographs of the active layers.15–18 Thickness
has been used to quantify active layer thickness based on the measured atomic areal density (atoms·m-2) and elemental composition of the active layer, which can be used to calculate the mass areal density (g·m-2) of the active layer. The active layer thickness is then calculated as the ratio between the areal mass density and the volumetric mass density (g·m-3) of the polyamide material.12,15,23–26 One important drawback of quantifying thickness of active layers using SEM, TEM or AFM is that the small size (a few micrometers for SEM and TEM, and around 30×30 µm2 for AFM) of sample analysis could potentially result in thickness results unrepresentative of the active layer being studied. One important drawback of RBS analysis is the need to use an active layer volumetric mass density value in the calculation of active layer thickness. This is because the volumetric mass density of active layers in RO/NF membranes has not been measured experimentally and only corresponding educated estimates are available. Thus, the accuracy of RBS estimates of active layer thickness is limited to the accuracy of the assumption about the volumetric mass density of the active layer.
While all four methods described above have important drawbacks in measuring active layer thickness, no study in the peer-reviewed literature has compared thickness values measured with these different techniques to conclude whether there is agreement, or not, among the
1.1.5. Void and nodular structures within active layers
A new important development has recently arisen in the study of water and solute transport phenomena through active layers. Contrary to the conceptualization of the solution-diffusion model that the active layer is a continuous, dense polymer phase, recent experimental studies based on TEM imaging27–32 suggest that voids (i.e., regions without polymer) with tens of nanometers in diameter exist within the polyamide layer. Pacheco et al.33 provided a different interpretation of the features in active layers identified as voids in TEM images by other researchers27–32 proposing that they are nodules and indicating that polyamide active layers are composed of a dense ‘nodular’ base from which the ridge-and-valley structure extends outwards
(see Figure 1.2(c)). Similar features as those interpreted as nodules by Pacheco et al. and voids by others27–32 are visible in TEM images reported by other authors,34–36 although these authors did not identify them as nodules or voids. The presence of voids or nodules in the active layer disagrees with the assumption that the active layer is dense and uniform.
While it is not settled in the literature whether the features in TEM images are voids or nodules,28 it can be observed in the TEM images reported in the literature29–36 that these features are significantly lighter in shade than the rest of the active layer in bright-field TEM images. Based on the principles of TEM imaging, darker and lighter regions in bright-field TEM images are associated with higher and lower electron density regions, respectively, in the sample
Figure 1.2. (a) A dark-field TEM image of a membrane cross-section that shows the
the voids to develop improved membranes. As a result, there is a need to evaluate whether these features are in fact voids, whether they are permeable to water, and estimate how important they are in terms the volume fraction of the active layer that they account for.
1.1.6 Gaps in the literature regarding the mechanisms of water transport through active layers
1.2. OBJECTIVES
1.2.1. Overall Research Goal
Addressing the gaps in the literature identified above, the overall goal of my research is to elucidate which parameter among water partitioning, water diffusion and active layer
thickness accounts for the differences in water permeability among polyamide reverse osmosis (RO) and nanofiltration (NF) membranes.
1.2.2. Specific Objectives
To achieve my overall research goal, the following specific objectives were pursued: 1. To identify appropriate methods (facile and accurate) for measuring active layer thickness in RO/NF membranes;
2. To ascertain the existence of voids within the polyamide active layers of RO/NF membranes and develop methods to quantify void volume fraction in active layers; 3. To measure the partition coefficient of water into membrane active layers, and calculate the diffusion coefficient of water in active layers based on measurements of membrane water permeability (A), active layer thickness (), and water partition coefficient (K);
4. To correlate membrane water permeability (A) to active layer thickness (), water partition coefficient (K) and water diffusion coefficient (D) for a group of polyamide RO/NF membranes with a broad range of performance levels.
1.3 Dissertation Organization
their own introductions, materials and methods, results and discussion, conclusions, acknowledgements and references sections. Chapters 2-4 are briefly described below:
Chapter 2: The work reported in this chapter compared seven thickness
measurement techniques for active layers of TFC membranes. The seven techniques are scanning electron microscopy, transmission electron microscopy, atomic force
microscopy, Rutherford backscattering spectrometry, quartz crystal microbalance, profilometry and ellipsometry. The six TFC membranes studied were NF270, NF90, XLE, ESPA3, SWC4+ and SW30HR membranes. For each membrane, active layer thickness was measured with all seven techniques and the results were compared using statistical analyses. Advantages and disadvantages of each technique were discussed. Through comparison of thickness results and discussion of advantages and disadvantages of each technique, conclusions were drawn regarding the accuracy of the techniques and preferred techniques under specific circumstances.
Chapter 3: Studies reported in this chapter were on the features identified as
voids by some, and as nodules by others, in cross-sectional TEM images of polyamide active layers of TFC membranes. The features were studied with image analysis of TEM images of membrane cross sections supported by SEM images of membrane cross
obtained through various experimental approaches, conclusions were drawn regarding the void nature of the features and the permeability of the voids to water when membranes are immersed in water.
Chapter 4: In this chapter, I reported investigation on the reasons why TFC
membranes having active layers with the same chemistry (fully aromatic polyamide) have very different water permeabilities. The research approach consisted of measuring water permeability and the three main parameters that determine it (i.e., active layer thickness, water partition coefficient, and water diffusion coefficient) for five commercial fully aromatic polyamide TFC membranes (NF90, XLE, ESPA3, SWC4+ and SW30HR membranes). Through statistical analyses, conclusions were drawn regarding which of the three parameter accounted for the differences in water permeabilities among TFC membranes. Data analysis was performed taking into account the presence of voids in the active layers.
The appendices follow Chapter 6. The appendices include experimental data obtained for Chapter 2, Chapter 3 and Chapter 4, and the “Supporting Information” referenced in the main
REFERENCES
(1) Malaeb, L.; Ayoub, G. M. Reverse osmosis technology for water treatment: State of the art review. Desalination 2011, 267, 1–8.
(2) Greenlee, L. F.; Lawler, D. F.; Freeman, B. D.; Marrot, B.; Moulin, P. Reverse osmosis desalination: water sources, technology, and today’s challenges. Water Res. 2009, 43, 2317–2348.
(3) Jacangelo, J. G.; Trussell, R. R.; Watson, M. Role of membrane technology in drinking water treatment in the United States. Desalination 1997, 113, 119–127.
(4) Van der Bruggen, B.; Everaert, K.; Wilms, D.; Vandecasteele, C. Application of
nanofiltration for removal of pesticides, nitrate and hardness from ground water: rejection properties and economic evaluation. J. Membr. Sci. 2001, 193, 239–248.
(5) Petersen, R. J. Composite reverse osmosis and nanofiltration membranes. J. Membr. Sci. 1993, 83, 81–150.
(6) Yip, N. Y.; Tiraferri, A.; Phillip, W. A.; Schiffman, J. D.; Hoover, L. A.; Kim, Y. C.; Elimelech, M. Thin-film composite pressure retarded osmosis membranes for sustainable power generation from salinity gradients. Environ. Sci. Technol. 2011, 45, 4360–4369. (7) Lee, K. P.; Arnot, T. C.; Mattia, D. A review of reverse osmosis membrane materials for
desalination—Development to date and future potential. J. Membr. Sci. 2011, 370, 1–22. (8) Matsuura, T. Progress in membrane science and technology for seawater desalination - a
review. Desalination 2001, 134, 47–54.
(9) Loeb, S. The Loeb-Sourirajan Membrane: How It Came About. ACS Symp. Ser. 1981, 153-154, 1–9.
(10) Bellona, C.; Drewes, J. E.; Xu, P.; Amy, G. Factors affecting the rejection of organic solutes during NF/RO treatment—A literature review. Water Res. 2004, 38, 2795–2809. (11) Wijmans, J. G.; Baker, R. W. The solution-diffusion model: a review. J. Membr. Sci.
1995, 107, 1–21.
(12) Zhang, X.; Cahill, D. G.; Coronell, O.; Mariñas, B. J. Absorption of water in the active layer of reverse osmosis membranes. J. Membr. Sci. 2009, 331, 143–151.
(13) Lee, J.; Doherty, C. M.; Hill, A. J.; Kentish, S. E. Water vapor sorption and free volume in the aromatic polyamide layer of reverse osmosis membranes. J. Membr. Sci. 2013, 425-426, 217–226.
(15) Mi, B.; Coronell, O.; Mariñas, B. J.; Watanabe, F.; Cahill, D. G.; Petrov, I. Physico-chemical characterization of NF/RO membrane active layers by Rutherford backscattering spectrometry. J. Membr. Sci. 2006, 282, 71–81.
(16) Singh, P. S.; Rao, A. P.; Ray, P.; Bhattacharya, A.; Singh, K.; Saha, N. K.; Reddy, A. V. R. Techniques for characterization of polyamide thin film composite membranes.
Desalination 2011, 282, 78–86.
(17) La, Y.-H.; Sooriyakumaran, R.; Miller, D. C.; Fujiwara, M.; Terui, Y.; Yamanaka, K.; McCloskey, B. D.; Freeman, B. D.; Allen, R. D. Novel thin film composite membrane containing ionizable hydrophobes: pH-dependent reverse osmosis behavior and improved chlorine resistance. J. Mater. Chem. 2010, 20, 4615–4620.
(18) Boussu, K.; De Baerdemaeker, J.; Dauwe, C.; Weber, M.; Lynn, K. G.; Depla, D.; Aldea, S.; Vankelecom, I. F. J.; Vandecasteele, C.; Van der Bruggen, B. Physico-chemical characterization of nanofiltration membranes. ChemPhysChem 2007, 8, 370–379. (19) Freger, V.; Gilron, J.; Belfer, S. TFC polyamide membranes modified by grafting of
hydrophilic polymers: an FT-IR/AFM/TEM study. J. Membr. Sci. 2002, 209, 283–292. (20) Ghosh, A. K.; Jeong, B.-H.; Huang, X.; Hoek, E. M. V. Impacts of reaction and curing
conditions on polyamide composite reverse osmosis membrane properties. J. Membr. Sci. 2008, 311, 34–45.
(21) Freger, V. Swelling and morphology of the skin layer of polyamide composite
membranes: an atomic force microscopy study. Environ. Sci. Technol. 2004, 38, 3168– 3175.
(22) Dražević, E.; Košutić, K.; Freger, V. Permeability and selectivity of reverse osmosis membranes: Correlation to swelling revisited. Water Res. 2014, 49, 444–452.
(23) Coronell, O.; González, M. I.; Mariñas, B. J.; Cahill, D. G. Ionization behavior,
stoichiometry of association, and accessibility of functional groups in the active layers of reverse osmosis and nanofiltration membranes. Environ. Sci. Technol. 2010, 44, 6808– 6814.
(24) Coronell, O.; Mariñas, B. J.; Zhang, X.; Cahill, D. G. Quantification of functional groups and modeling of their ionization behavior in the active layer of FT30 reverse osmosis membrane. Environ. Sci. Technol. 2008, 42, 5260–5266.
(25) Jubera, A. M. S. de; Gao, Y.; Moore, J. S.; Cahill, D. G.; Mariñas, B. J. Enhancing the Performance of Nanofiltration Membranes by Modifying the Active Layer with Aramide Dendrimers. Environ. Sci. Technol. Technol. 2012, 46, 9592–9599.
(27) Kurihara, M.; Hanakawa, M. Mega-ton water system: Japanese national research and development project on seawater desalination and wastewater reclamation. Desalination 2013, 308, 131–137.
(28) Ridgway, H. F.; Gale, J. D.; Hughes, Z. E.; Stewart, M. B.; Orbell, J. D.; Gray, S. R. Molecular scale modeling of membrane water treatment processes. In Functional Nanostructured Materials and Membranes for Water Treatment; Duke, M.; Zhao, D.; Semiat, R.; Lu, M., Eds.; John Wiley & Sons, 2013; pp. 249–300.
(29) An, Q.; Hung, W.; Lo, S.; Li, Y.; Guzman, M. De; Hu, C.-C.; Lee, K.-R.; Jean, Y.-C.; Lai, J.-Y. Comparison between Free Volume Characteristics of Composite Membranes
Fabricated through Static and Dynamic Interfacial Polymerization Processes. Macromolecules 2012, 45, 3248–3435.
(30) Kong, C.; Shintani, T.; Kamada, T.; Freger, V.; Tsuru, T. Co-solvent-mediated synthesis of thin polyamide membranes. J. Membr. Sci. 2011, 384, 10–16.
(31) Kong, C.; Koushima, A.; Kamada, T.; Shintani, T.; Kanezashi, M.; Yoshioka, T.; Tsuru, T. Enhanced performance of inorganic-polyamide nanocomposite membranes prepared by metal-alkoxide-assisted interfacial polymerization. J. Membr. Sci. 2011, 366, 382–388. (32) Kong, C.; Kanezashi, M.; Yamomoto, T.; Shintani, T.; Tsuru, T. Controlled synthesis of
high performance polyamide membrane with thin dense layer for water desalination. J. Membr. Sci. 2010, 362, 76–80.
(33) Pacheco, F. A.; Pinnau, I.; Reinhard, M.; Leckie, J. O. Characterization of isolated polyamide thin films of RO and NF membranes using novel TEM techniques. J. Membr. Sci. 2010, 358, 51–59.
(34) Tang, C. Y.; Kwon, Y.-N.; Leckie, J. O. Probing the nano- and micro-scales of reverse osmosis membranes—A comprehensive characterization of physiochemical properties of uncoated and coated membranes by XPS, TEM, ATR-FTIR, and streaming potential measurements. J. Membr. Sci. 2007, 287, 146–156.
(35) Tang, C. Y.; Fu, Q. S.; Robertson, A. P.; Criddle, C. S.; Leckie, J. O. Use of reverse osmosis membranes to remove perfluorooctane sulfonate (PFOS) from semiconductor wastewater. Environ. Sci. Technol. 2006, 40, 7343–7349.
(36) Yin, J.; Kim, E.-S.; Yang, J.; Deng, B. Fabrication of a novel thin-film nanocomposite (TFN) membrane containing MCM-41 silica nanoparticles (NPs) for water purification. J. Membr. Sci. 2012, 423-424, 238–246.
CHAPTER 2: IDENTIFYING FACILE AND ACCURATE METHODS TO MEASURE THE THICKNESS OF THE ACTIVE LAYERS OF THIN-FILM COMPOSITE MEMBRANES – A COMPARISON OF SEVEN CHARACTERIZATION TECHNIQUES 2.1 Introduction
Reverse osmosis (RO) and nanofiltration (NF) membranes are widely used for water purification in a broad range of applications, including desalination, hardness removal and water reuse.1–3 The market of RO and NF membranes is dominated by thin-film composite (TFC) membranes which consist of a polyamide active layer (~20-200 nm), a porous polysulfone support (~20-50 µm) and a polyester backing fabric (~300 µm).4,5 The polyamide active layer serves the role of selective barrier determining the permeation of water and solutes through the membrane.4,6
The solution-diffusion model7 is commonly used to describe water and solute permeation through membrane active layers. The model describes the water flux (𝐽𝑤𝑎𝑡𝑒𝑟) as
𝐽𝑤𝑎𝑡𝑒𝑟 = 𝐴(∆𝑝 − ∆𝜋), (2.1)
where 𝐴 (m·s-1·Pa-1) is the water permeability coefficient of the membrane, ∆𝑝 (Pa) is the applied trans-membrane pressure and ∆𝜋 (Pa) is the trans-membrane osmotic pressure. The water permeability coefficient 𝐴 is given by
𝐴 =𝐷𝐾𝛿 𝐶𝐻2𝑂𝑣
𝑅𝑇 , (2.2)
-(m3·Pa·K-1·mol-1) is the ideal gas constant, and 𝑇 (K) is the absolute temperature. Similarly, the solution-diffusion model describes solute flux (𝐽𝑠𝑜𝑙𝑢𝑡𝑒) as
𝐽𝑠𝑜𝑙𝑢𝑡𝑒 = 𝐵(𝑐𝑓𝑒𝑒𝑑− 𝑐𝑝𝑒𝑟𝑚𝑒𝑎𝑡𝑒), (2.3)
where 𝐵 (m·s-1) is the solute permeability coefficient, 𝑐
𝑓𝑒𝑒𝑑 (mol·m-3) is the solute concentration in the feed water, and 𝑐𝑝𝑒𝑟𝑚𝑒𝑎𝑡𝑒 (mol·m-3) is the solute concentration in the permeate water. The solute permeability coefficient 𝐵 is given by
𝐵 =𝐷𝑖𝐾𝑖
𝛿 , (2.4)
where 𝐷𝑖 (m2·s-1) is the diffusion coefficient of solute i within the active layer, 𝐾𝑖 (-) is the partition coefficient of solute i into the active layer and (m) is the thickness of the active layer. Equations 2.1-2.4 show that the active layer thickness is a strong determinant of membrane performance (i.e., water flux and solute flux) through its effects on the water and solute permeability coefficients.
Current quantification methods of K and 𝐷 require the value of the active layer
thickness.8,9 For example, to obtain the water partition coefficient in RO active layers, Zhang et al.8 and Lee et al.9 calculated the concentration of water in the active layer (𝐶𝑚, molm-3) as the ratio between measurements of the areal mass of water sorbed by the active layer (𝐶𝐻2𝑂, gcm-2) and measurements of active layer thickness (, m). To obtain the corresponding water diffusion
diffusion (~10-5 s). Therefore, accurate measurements of active layer thickness are important not just in understanding the effect of thickness on membrane performance, but also in
characterizing the partitioning and diffusion coefficients of water and solutes in the active layers and their effects on performance.
The active layer thickness of RO/NF membranes has been typically measured using several microscopy techniques, including scanning electron microscopy (SEM),10 transmission electron microscopy (TEM)10–13 and atomic force microscopy (AFM).14,15 Thickness
measurements with SEM and TEM are based on image analysis (typically eyeball estimates) of cross-section images of membrane active layers, with the scale of the images being no larger than a few micrometers.10–13 AFM thickness measurements, which are much less common than SEM and TEM measurements, are obtained by analyzing topography profiles of thin strips of a membrane active layer isolated on a hard solid substrate, such as a silicon wafer.14,15 The typical size of such polyamide thin strips is on the order of 30×30 µm2.14,15 One important drawback of thickness measurements using SEM, TEM or AFM is that the small size of active layers
measured with the techniques could potentially result in thickness measurements
unrepresentative of the membranes being studied, since studies in the literature have shown significant variability of physico-chemical properties (e.g, concentration of carboxylic group) at different locations on a membrane active layer even though the values measured for the
properties were averaged on areas with size of a few square centimeters.16 Also, measuring active layer thickness with SEM or TEM typically requires subjective judgment about the
More recently, Rutherford backscattering spectrometry (RBS) has also been used to estimate active layer thickness.8,10,17–20 The typical size of samples under study in RBS analyses is on the scale of several square centimeters,8,10,17–20 which represents an improvement of several orders of magnitude over the area of analysis for SEM , TEM and AFM. In RBS, however, active layer thickness is calculated as the ratio between the active layer areal mass density (g·cm -2) obtained experimentally and literature values of active layer volumetric mass density.10,17,20 Thus, an important drawback of RBS measurements of active layer thickness is that it does not directly measure thickness, but rather uses an assumption of the active layer volumetric mass density to calculate it. Unfortunately, experimental measurement of the volumetric mass density of polyamide active layers of RO/NF membranes has not been reported in the peer-reviewed literature, so researchers have relied on corresponding educated estimates.8,21 This approach limits the accuracy of RBS estimates of active layer thickness to the accuracy of the assumption about the active layer volumetric mass density.
While these four techniques are the ones commonly found in the literature to measure thickness of the active layers of TFC membranes, and they all have significant drawbacks of different nature, no study reported in the peer-reviewed literature has compared thickness values measured with these techniques to conclude whether their measurements are in agreement or not. Therefore, there exists a need to compare thickness measurements for TFC membrane active layers with these four techniques and, if possible, to introduce new techniques as the existing methods have important drawbacks.
Three techniques that are reasonable candidates to measure active layer thickness are profilometry, ellipsometry and quartz crystal microbalance (QCM). Profilometry and
there has not been a study in the peer-reviewed literature that has used profilometry to estimate thickness of active layers for commercial RO and NF membranes. Similarly, I could find only one study26 where ellipsometry was used to measure the active layer thickness of an NF
membrane, but the same study indicated that ellipsometry could not be used with RO membranes because of their high surface roughness. While QCM has not been used to estimate active layer thickness, QCM provides the same information about the active layer (polymer areal mass, g·cm -2) that is extracted from RBS analyses to calculate active layer thickness, and therefore it should be possible to use QCM analyses to estimate active layer thickness.
Accordingly, the objectives of the work reported in this chapter were to: (i) compare various methods for measurement of active layer thickness of RO/NF membranes to identify which methods provide consistent thickness measurements, and (ii) evaluate the use of QCM, profilometry and ellipsometry as analytical techniques for measurement of the thickness of active layers of RO/NF membranes. The measurements were performed under the premise that
consistent results among different techniques working under different physical principles would suggest that the techniques provide accurate thickness measurements. Six commercially
available membranes, including NF, brackish water RO and seawater RO membranes, from two major manufacturers were studied, and seven analytical techniques, including SEM, TEM, AFM, RBS, QCM, profilometry and ellipsometry, were used. I present and compare the active layer thickness results obtained for each membrane with each analytical technique, identify which techniques provide consistent (and inconsistent) results among each other, and discuss the advantages and limitations of each method. I also present a thorough description of the
QCM, profilometry and ellipsometry methods which have not been commonly used for determining the thickness of the active layers of RO/NF membranes.
2.2. Materials and Methods 2.2.1. Target membranes
Six TFC membranes were used in this study: NF90, XLE, NF270 and SW30HR (DOW FILMTEC, Minneapolis, MN) and ESPA3 and SWC4+ (Hydranautics, Oceanside, CA). The membranes cover a broad range of performance, with NF90 and NF270 being NF membranes, XLE and ESPA3 being brackish water RO membranes, and SW30HR and SWC4+ being seawater RO membranes. Attenuated total reflectance Fourier transform infrared spectroscopy (ATR-FTIR) analyses in earlier studies27,28 indicated that the NF270 membrane has a semi-aromatic poly(piperazine amide) active layer, and the other five membranes all have
fully-aromatic polyamide active layers. The active layer of the SW30HR membrane also has a coating likely consisting of poly(vinyl alcohol).27,28 Because the membranes studied are used for a wide range of applications and contain three commonly used materials for TFC membrane active layers (i.e., fully-aromatic polyamide, semi-aromatic poly(piperazine amide), and poly(vinyl alcohol)), conclusions drawn in this study can be applied to most commercial TFC membranes. 2.2.2. Membrane sample preparation for active layer thickness measurements
Membrane coupons having a size of 2.5×5 cm2 were cut from flat sheets obtained from the manufacturers and were thoroughly rinsed with and stored in ultrapure water (>18 MΩ·cm) before further sample preparation. For SEM analyses, membrane coupons were cracked in air after immersion in liquid nitrogen and coated with a thin film (<5 nm) of Au (60%):Pd (40%). For TEM analyses, membrane coupons were dried between two filter papers by applying
with a Sorvall MT 6000 Ultramicrotome (RMC Co., Tucson, AR). For RBS analyses, membrane coupons were dried between two filter papers by applying fingertip pressure. For AFM and profilometry analyses, active layers were isolated onto silicon wafers and then gently scratched to obtain thin strips of the active layer polymer. For QCM and ellipsometry analyses, active layers were isolated onto QCM crystal sensors and silicon wafers, respectively. The active layer isolation procedure is similar to that described by Perry and Coronell.29 with slight modifications. In this study, after peeling off the polyester backing layer by hand and placing the polyamide-polysulfone composite on a silicon wafer substrate (with the active layer facing the wafer), the composite and the substrate were secured to each other using a customized stainless steel frame with an open window that allowed access to the polysulfone support. Then,
Dimethylformamide (DMF) was gently added through the open window in a dropwise manner onto the sample, the DMF-polysulfone solution was discarded after 1 min, and the cycle of addition and discarding of DMF was repeated 15 times. By then, the sample showed a smooth surface by visual inspection. To further remove any polysulfone that might have not been dissolved by that time, the sample was air dried overnight and then dipped in fresh DMF for 4 h and air dried overnight again. At last, the sample was rinsed with ultrapure water and gently dried with nitrogen gas. This active layer isolation procedure has been proven not to alter the membrane active layer physico-chemical properties and provide isolated active layers free of polysulfone.29
2.2.3. SEM analyses
SEM image was analyzed with the software ImageJ 1.47v30 to obtain the area and length of the active layer in the corresponding cross section. The typical length of active layer observed in the images obtained was in the 1.5-3 m range. The thickness was then calculated as the ratio between the area and length of the active layer cross section.
2.2.4. TEM analyses
A JEOL 100CX II TEM (JEOL USA, Peabody, MA) was used to obtain dark-field TEM images of membrane cross sections at an acceleration voltage of 80 kV. Three images were taken for each membrane at magnifications of 29,000× or 72,000× depending on the active layer thickness. Each TEM image was analyzed in the same manner as the SEM images with the software ImageJ 1.47v30 to determine the thickness of the active layer in the corresponding cross section. The typical length of active layer observed in the images obtained was in the 1.5-4 m range.
2.2.5. AFM analyses
surface roughness, membrane surface topography of each sample was obtained by scanning the AFM tip in tapping mode over the sample surface, and the root-mean-square roughness was calculated from the surface topography profile as described by Kwak et al.31 Three samples were analyzed for each membrane with a scanning size of 10×10 µm2 for each sample. 2.2.6. RBS analyses
RBS spectra were acquired with a tandem Van de Graaff accelerator (High Voltage Engineering Corporation, Burlington, MA) and the semi-automatic target system described by Attayek et al.32 A 2-MeV He2+ beam at incident, exit and scattering angles of 22.5°, 42.5° and 160°, respectively, was used. To avoid possible damage of the membranes by the helium beam, the fluence of helium ions was kept below 1×10¹⁴ He2+·cm-2.33 The commercial software SIMNRA 6.06v34 was used to simulate RBS spectra and obtain the elemental composition and atomic areal density (atoms·cm-2) of membrane active layers, which were used to calculate the thickness of the membrane active layers as described in Section 2.3.3. Two samples of each membrane, with each sample having an analysis area of 2.5×5.0 cm2, were analyzed by RBS. 2.2.7. QCM analyses
Areal mass (g·cm-2) of isolated active layers was measured with a Q-Sense E4 QCM (Biolin Scientific, Lithicum Heights, MD) in the manner described by Perry et al.29 In brief, for each sample of isolated active layer, a blank QCM sensor was tested for its vibration frequency, then coated with the isolated active layer, and tested again in QCM for its new vibration
was subtracted from the frequency change of the sample in the calculation of the areal mass of the active layer. The thickness of active layers was calculated as the ratio between the measured areal mass and an estimate of the volumetric mass density (1.24 g·cm-3) of the active layers obtained from the literature.8 Two samples, each having 1.54 cm2 in area, were tested for each membrane at a temperature of 22 ± 0.02°C.
2.2.8. Profilometry analyses
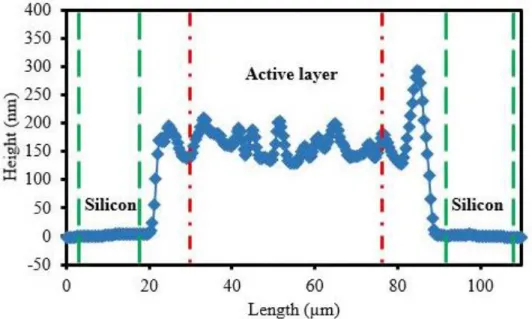
A P-6 Stylus Profiler (KLA Tencor, Milpitas, CA) was used for profilometry analyses of active layers isolated on silicon wafers. The tip of the profiler had a radius of 5 m and a cone angle of 60°. Topography profiles of thin strips of active layers were obtained at a scanning speed of 20 m·s and a force of 2 mg, and were used for the calculation of active layer thickness as the difference in the average height of the polyamide surface and the average height of the silicon wafer surface. Three samples were analyzed for each membrane, and three locations on each sample were analyzed. The typical length of active layer scanned during the experiments was in the 100-300 m range.
2.2.9. Ellipsometry analyses
Ellipsometry spectra were obtained with a J.A. Woollam variable angle spectroscopic ellipsometer (J.A. Woollam Co., Lincoln, NE) at incidence angles of 65°, 70° and 75° and wavelength range of 380-1000 nm using the AutoRetarder feature. Ellipsometry measures the phase change (Δ) and the amplitude change (Ψ) of a light beam upon reflection off the sample
nm35 and a top thin polymer layer that represents the isolated active layers of RO/NF
membranes. The Cauchy dispersion formula36 was used to describe the optical properties of the active layers. Optical constants of the silicon layer and silicon dioxide layer are available in the database of the WVASE® software (J.A. Woollam Co.) used for ellipsometry data analyses. The adjustable parameters in this study were the refractive index and the thickness37 of the Cauchy layer (active layer). The parameter values were changed until the mean squared error between simulated and experimental Δ and Ψ values was less than 20. Three samples were
analyzed for each membrane with three locations (0.3 cm2 each location) analyzed for each sample.
2.3. Results and Discussion
2.3.1. Thickness measurements with SEM and TEM
Both SEM and TEM measurements of active layer thickness are based on microscopy imaging of the cross sections of membrane active layers. Figure 2.1 shows representative SEM and TEM images of active layer cross sections of the SWC4+ membrane (polyester backing was not in the imaging field). From both images in Figure 2.1, the ridge-and-valley structure that is commonly reported4 for RO/NF membrane active layers can be observed, and was outlined in red. The images also show that the surface of the active layer has relatively high roughness, which is consistent with the roughness measurements obtained by AFM discussed later in this section and the relatively high roughness reported for polyamide active layers in the literature.38– 40 The SEM and TEM images of all other membranes showed similar ridge-and-valley structures and high roughness of active layer surface.
was determined to be the region where there seems to be a change in the morphology of the polymer layers. Similarly, from the TEM image in Figure 2.1(b), the active layer can be distinguished by a subjective judgment based on the slightly different colors of the active layer and the support layer, as the active layer appears darker than the support layer.
The software ImageJ 1.47v30 was used to obtain the area and the length of the active layer cross section in each image obtained for each membrane. The active layer thickness was then calculated as the ratio between the area and the length of the active layer. The thickness values for the active layers of NF270, NF90, XLE, ESPA3, SWC4+ and SW30HR membranes obtained from SEM analyses were 56.5±1.8 nm, 183.6±22.9 nm, 185.8±27.0 nm, 155.4±24.2 nm,
199.9±43.5 nm and 165.4±22.2 nm, respectively, and the thickness values obtained from TEM analyses were 103.9±22.6 nm, 229.9±30.8 nm, 238.3±31.1 nm, 155.4±22.9 nm, 340.0±55.4 nm and 168.9±14.3 nm, respectively. The relative standard deviations of the SEM thickness results are in the 3.2-21.8% range with an average of 13.5%, and the relative standard deviation of the TEM thickness results are in the 8.5-21.8% range with an average of 14.6%.
for sample preparation, i.e., both techniques use full membrane samples instead of isolated active layer samples for analyses. Using full membrane samples avoids any potential deterioration of the active layer that can possibly be caused by the active layer isolation process. Also, preparing the samples for SEM or TEM is a much easier procedure compared to active layer isolation, and thus, requires much less overall effort to obtain the active layer thickness. Additionally,
analyzing membrane samples in SEM or TEM is not very time consuming (1 min per sample
for SEM and 0.5 min per sample for TEM) compared to other methods. Other advantages of using SEM and TEM for measuring active layer thickness include that instruments for both techniques are readily available in many research facilities due to their wide use in other research fields, that the measurement of thickness is a direct measurement and does not require any important assumptions about the property of active layer, and that both techniques provide visual images of the active layers that show the structure of the active layer and such provide more information about the active layer than other methods that do not provide visual observations.
A major disadvantage of measuring active layer thickness using SEM or TEM is that the size of samples being analyzed is only on the micrometer scale (see Figure 2.1). This small characterization scale could potentially result in unrepresentative values of active layer thickness, especially given the rough nature of polyamide active layers. For example, the surface
roughness measured using AFM and active layer roughness-to-thickness ratio calculated using the thickness measured with TEM were 7.5±0.6 nm and 7.2±1.7% for NF270, 103.7±38.1 nm and 45.1±17.6% for NF90, 63.5±11.4 nm and 26.6±5.9% for XLE, 102.4±5.5 nm and
Table 2.1. Advantages and disadvantages of SEM, TEM, AFM, profilometry, RBS, QCM and ellipsometry as analytical techniques for the measurement of active layer thickness of RO/NF membranes.
Techniques SEM TEM AFM Profilometry RBS QCM Ellipsometry
Size of samples µm µm hundred µm2 hundred µm cm2 cm2 cm2
Assumption required None None None None Yesa Yesa None
Subjective judgment required Yesb Yesb No No No No No
Relative standard deviation High High High High Low Low Low
Direct measurement Yes Yes Yes Yes Noc Nod Noe
Active layer isolation required No No Yes Yes No Yes Yes
Sample preparation Medium Medium Very hard Very hard Easy Hard Hard
Sample analysis Easy Easy Hard Easy Hard Medium Easy
Availability of equipment Easy Easy Easy Easy Hard Medium Medium
Visual Method Yes Yes Yes No No No No
a Volumetric mass density of active layer
b Location of boundary between active layer and support layer c Measures atomic areal density
d Measures mass areal density
e Measures phase change and amplitude change of light beam