ESSAYS ON WATER AND SANITATION SERVICE DELIVERY IN SUB-SAHARAN AFRICA
David Fuente
A dissertation submitted to the faculty at the University of North Carolina at Chapel Hill in partial fulfillment of the requirements of the degree of Doctor of Philosophy in the Department
of City and Regional Planning in the College of Arts and Sciences.
Chapel Hill 2017
Approved by:
Dale Whittington
Noreen McDonald
Meenu Tewari
Céline Nauges
© 2017 David Fuente
ABSTRACT
David Fuente: Essays on Water and Sanitation Service Deliver in Sub-Saharan Africa (Under the direction of Dale Whittington)
Tariffs (i.e., user fees) will play a critical role in financing the Sustainable Development
Goals’ aspiration to ensure universal access to water and sanitation services by 2030. This
dissertation is comprised of three essays that examine the pricing of water and sanitation services
in sub-Saharan Africa, focusing specifically on the case of Nairobi, Kenya. The first essay
examines the extent to which the increasing block tariff (IBT) implemented in Nairobi
effectively targets subsidies to low-income households, one of the primary objectives of the IBT
implemented by Nairobi City Water and Sewer Company (NCWSC) and the majority of utilities
in Sub-Saharan Africa. Contrary to conventional wisdom, I find that high-income residential and
nonresidential customers receive a disproportionate share of subsidies and that subsidy targeting
is poor even among households with a private metered connection.
Subsidy incidence is, however, only one of several criteria that policy makers consider
when designing tariffs. The second essay provides a systemic review of the literature on pricing
water and sanitation services, identifying the ways in which the literature might inform tariff
design and areas for future research. I find that the literature is diverse, fragmented, and focused
primarily on industrialized countries. The majority of studies in the literature also examine two
or fewer criteria, limiting the extent to which the literature characterizes the actual tradeoffs
The third essay develops a framework for simulating the performance of water and
sanitation tariffs. I apply this framework to the case of Nairobi to examine the performance of
five alternative tariff structures relative to the IBT implemented by NCWSC. I find that tariff
alternatives with a uniform volumetric price perform equally well or better than IBT tariff
alternatives at three levels of cost recovery. These findings add to a growing body of evidence
that challenges commonly held perceptions about IBTs. These findings also underscore the
benefits of getting utilities on path to full cost recovery, an essential component of financing the
TABLE OF CONTENTS
LIST OF TABLES ... viii
LIST OF FIGURES ... ix
LIST OF ABBREVIATIONS ... x
INTRODUCTION ... 1
REFERENCES ... 6
CHAPTER 1: WATER AND SANITATION SERVICE DELIVERY, PRICING, AND THE POOR: AN EMPIRICAL ESTIMATE OF SUBSIDY INCIDENCE IN NAIROBI, KENYA ... 7
1.1 Introduction ... 7
1.2 Background and Literature Review... 9
1.3 Empirical Strategy ... 13
1.3.1 Subsidy Incidence ... 14
1.3.2 Stated Expenditure as a Proxy for Water Use ... 17
1.4 Data ... 18
1.5 Results ... 21
1.5.1 Household Survey – Subsidy Incidence ... 21
1.5.2 Household Survey – Stated Expenditure as a Proxy for Metered Water Use ... 23
1.5.3 Subsidy Incidence Among All Residential Customers... 24
1.5.4 Subsidy Incidence among all Customer Classes ... 25
1.6 Discussion and Conclusions ... 25
CHAPTER 2: ASSESSING THE PERFORMANCE OF TARIFFS FOR WATER AND
SANITATION SERVICES – A SYSTEMATIC REVIEW ... 39
2.1 Introduction ... 39
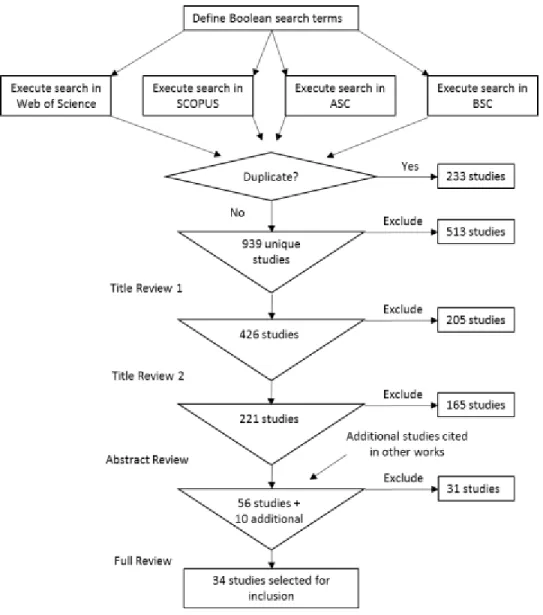
2.2 Methodology ... 41
2.3 Results ... 44
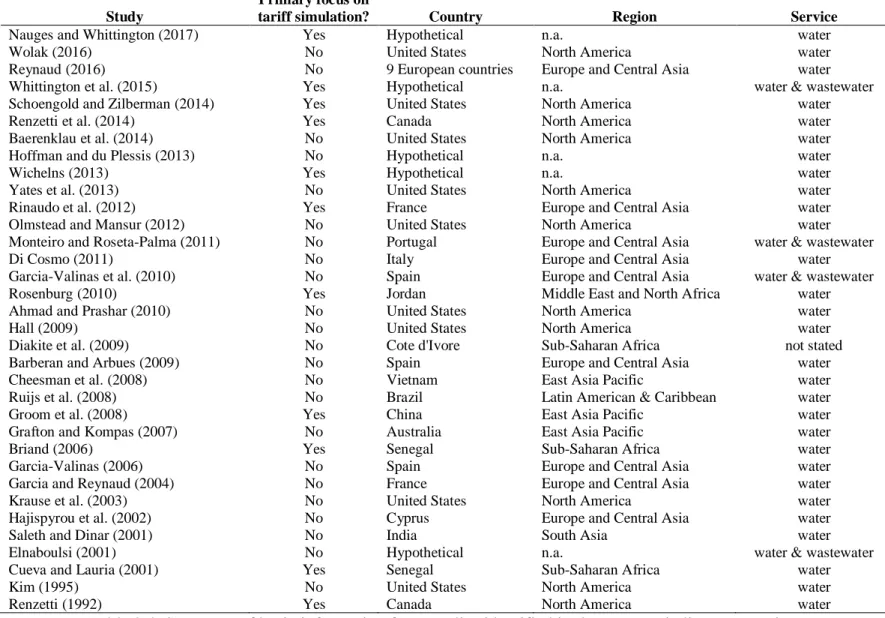
2.3.1 Primary focus, location, and service Level... 45
2.3.2 Number of tariffs compared ... 46
2.3.3 Modeling framework ... 48
2.3.4 Cost and capacity ... 50
2.3.5 Indicators of tariff performance ... 51
2.4 Discussion ... 53
2.4.1 Efficiency... 53
2.4.2 Customer heterogeneity ... 55
2.4.3 Affordability ... 57
2.4.4 Conservation ... 58
2.5 Summary and Conclusions ... 59
REFERENCES ... 64
TABLES AND FIGURES ... 68
CHAPTER 3: ASSESSING THE PERFORMANCE OF ALTERNATIVE WATER AND SANITATION TARIFFS: THE CASE OF NAIROBI, KENYA. ... 74
3.1 Introduction ... 74
3.2 Background and Literature ... 76
3.3 Empirical Strategy ... 79
3.3.1 Description of tariff simulation model ... 80
3.3.2 Performance criteria ... 85
3.5 Results ... 93
3.5.1 Status quo cost recovery (31%) ... 94
3.5.2 Intermediate cost recovery (65%)... 97
3.5.3 Full cost recovery ... 99
3.5.4 Trade-offs along the path to cost recovery ... 100
3.6 Model Extensions and Additional Considerations ... 102
3.6.1 What happens when customers respond to marginal price? ... 102
3.6.2 Reconsidering the Uniform Price with Rebate (UP+R) tariff ... 104
3.6.3 Limitations and opportunities for additional research ... 107
3.7 Summary and Conclusions ... 108
REFERENCES ... 111
TABLES AND FIGURES ... 115
CONCLUSION ... 123
APPENDIX 1-1: SUMMARY OF SUBSIDY INCIDENCE LITERATURE ... 127
APPENDIX 1-2: DISCUSSION OF STATED EXPENDITURE AS A PROXY FOR METERED WATER USE ... 130
APPENDIX 1-3: COST ESTIMATES USED IN THE LITERATURE ... 132
APPENDIX 1-4: SURVEY DESCRIPTION AND SAMPLING STRATEGY ... 134
APPENDIX 1-5. WEALTH INDEX ... 138
APPENDIX 3-1: SIMULATION MODEL PARAMETERS FOR THE BASE CASE SCENARIO... 141
APPENDIX 3-2: CALCULATION OF CONSUMER SURPLUS UNDER INCREASING BLOCK TARIFFS WHEN CUSTOMERS RESPOND TO MARGINAL PRICE... 142
LIST OF TABLES
Table 1.1. Summary of the Tariff Implemented by Nairobi City Water and
Sewerage Company. ... 33
Table 1.2. Summary of Cost Estimates Used to Calculate Subsidy Incidence ... 33
Table 1.3. Basic Characteristics of Households Surveyed ... 34
Table 1.4. Water Use, Representative Bill, and Average Price among Wealth Quintiles ... 34
Table 1.5. Summary Statistics for the Distributions of Metered and Imputed Water Use ... 34
Table 1.6. Summary of Water Use Among NCWSC Residential Customers ... 35
Table 1.7. Summary of the Share of Accounts, Water Use, Billings, and Subsidies Among Four NCWSC Customer Classes ... 35
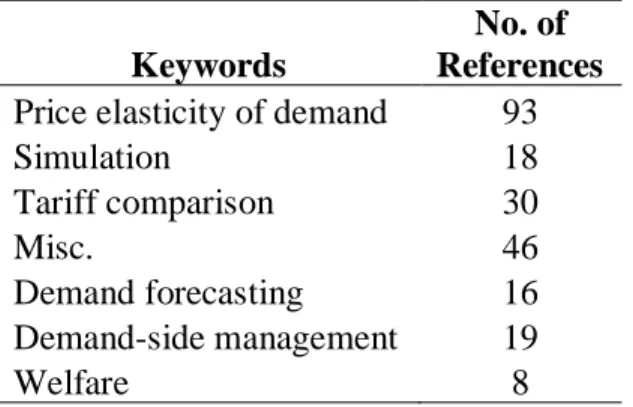
Table 2.1. Summary of Boolean search results from four academic search engines. ... 68
Table 2.2. Summary of keywords assigned after abstract review... 68
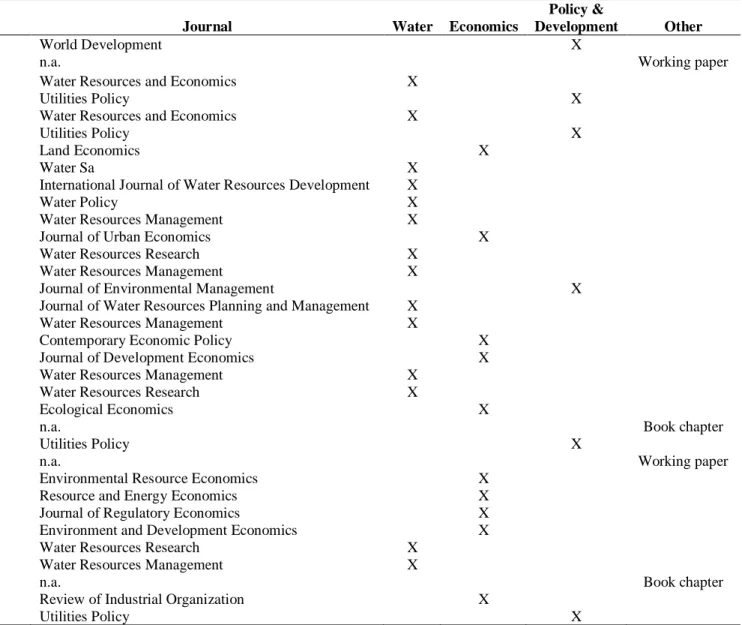
Table 2.3. Publication outlets and types of journals for studies identified in the systematic review. ... 69
Table 2.4. Summary of basic information from studies identified in the systematic literature review. ... 70
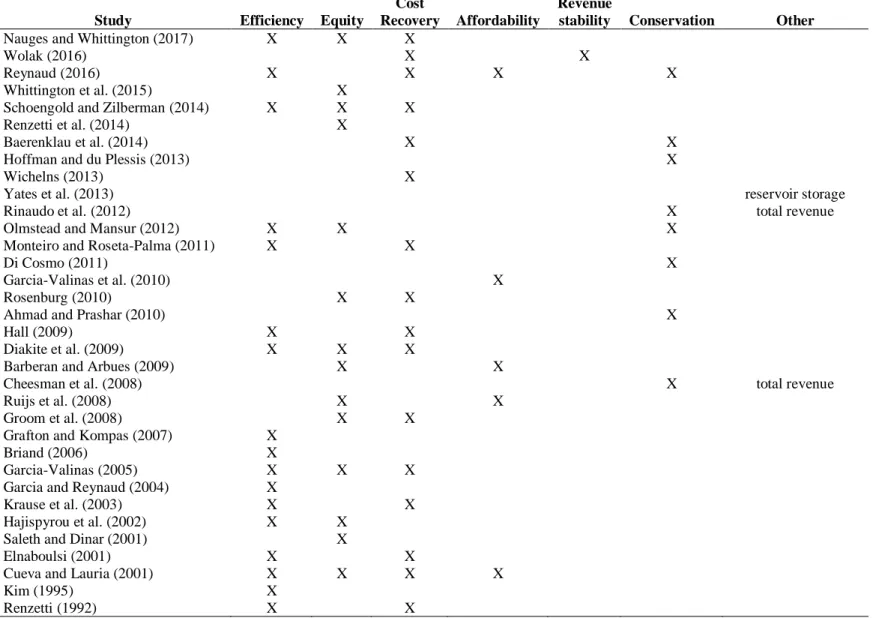
Table 2.5. Summary of policy objectives examined in studies identified in the systematic literature review. ... 71
Table 3.1. Summary of the tariff alternatives. ... 115
Table 3.2. Summary statistics from the NCWSC customer base. ... 115
Table 3.3. Summary of status quo cost recovery simulation results. ... 116
Table 3.4. Summary of tariff alternatives simulated under base case conditions (t=5). ... 117
Table 3.5. Summary of intermediate cost recovery simulation results. ... 118
Table 3.6. Summary of full cost recovery simulation results. ... 119
LIST OF FIGURES
Figure 1.1. Distribution of Water Use among Survey Sample with NCWSC Tariff Blocks ... 36
Figure 1.2. Scatter Plot of Monthly Household Water Use Versus Wealth. ... 37
Figure 1.3. Share of Subsidies Received by Each Wealth Quintile. ... 37
Figure 1.4. Imputed Versus Metered Water Use ... 38
Figure 1.5. Share of Total Residential Accounts and Subsidies Received by Accounts in Low-income and Middle/High-Low-income Areas... 38
Figure 2.1. Schematic of the systematic literature review process. ... 72
Figure 2.2. Annual distribution of publications identified in the systematic review. ... 73
LIST OF ABBREVIATIONS
ABM Agent Based Model
ASCE American Society for Civil Engineers
AWSB Athi Water Services Board CGE Computable General Equilibrium
GIS Geographic Information System
GPS Global Positioning System
GWI Global Water Intelligence IBT Increasing Block Tariff
IED Income Elasticity of Demand
KSH Kenyan Shilling
LSMS Living Standards Measurement Study
MoWI Ministry of Water and Irrigation
NCWSC Nairobi City Water and Sewer Company, Ltd. O&M Operations and Maintenance
OECD Organization of Economic Co-operation and Development PED Price Elasticity of Demand
PRISMA Preferred Reporting Items for Systematic Reviews and Meta-Analyses SDG Sustainable Development Goal
SDM System Dynamic Model
UNC University of North Carolina
USD United States Dollars WHO World Health Organization
INTRODUCTION
In September 2015, global leaders met at the United Nations Sustainable Development
Summit to adopt the Sustainable Development Goals (SDGs), an ambitious set of goals aimed at
ending poverty, improving human health and well-being, and addressing climate change. The
SDG for water and sanitation (Goals 6.1 and 6.2) seek to ensure access to safe and affordable
water and sanitation services for all by 2030. This represents a major shift in global ambition
both with respect to the scope of the goals – universal access – as well as the target level of
service. The SDGs defines “safe” services as service that is safely managed, available on
premise, when needed. The World Bank estimates that it will cost approximately 100 billion
USD per year between now and 2030 to meet the SDGs for water and sanitation (Hutton and
Varughese 2016). This estimate does not include the cost of maintaining, repairing, or replacing
countries’ existing water and sanitation infrastructure, or the cost of investing in infrastructure
that is resilience to climate change.
While many low and middle income countries face the challenge of investing in their first
generation of water and sanitation infrastructure, the water and sanitation infrastructure in many
industrialized countries is reaching, or has reached, the end of its useful life and is in many cases
failing. In the United States, the American Society of Civil Engineering have given the nation’s
water and sanitation infrastructure a D+ rating, indicating that the infrastructure is in poor
Engineers, it will cost approximately one trillion dollars to replace the United States’ water
infrastructure network and 300 billion dollars to meet the United States’ wastewater and storm
water capital requirements (ASCE 2013). These estimates also do not include the cost of
investing in climate-resilient water and sanitation infrastructure.
Financing the next generation of water and sanitation infrastructure in both developing
and industrialized countries will require the mobilization of substantial resources. There are three
general ways in which governments can finance this infrastructure transition: taxes, tariffs (i.e.,
user fees), and transfers (e.g., from international donors). Given the magnitude of the
infrastructure challenge, governments will need to deploy each of these sources of finance to
ensure their citizens have access to high quality water and sanitation services. To date, tariffs
have largely been under-utilized by governments and service providers as source of domestic
finance for water and sanitation service delivery, particularly in low and middle-income
countries. The International Monetary Fund estimated that in 2012 nearly 500 billion USD in
subsidies were delivered through water and sanitation tariffs as a result of prices that were
insufficient to cover the full cost of services (Kochar et al. 2015). This may seem
counterintuitive because tariffs – and a stable revenue stream – directly affect utilities’ ability to
attract finance from domestic and international capital markets.
This dissertation is comprised of three essays that examine water and sanitation service
delivery in sub-Saharan Africa, focusing specifically on the pricing of water and sanitation
services in one of the region’s largest cities, Nairobi, Kenya. Sub-Saharan Africa was one of only
two regions1 not to meet the Millennium Development Goal of halving the population without
access to improved water and sanitation facilities by 2015 (UNICEF and WHO 2015). It is also
the region where the investment needed to meet the SDG aspiration of ensuring universal access
to safely managed water and sanitation services is greatest.
The first and third essays in the dissertation examine issues related to the pricing of
municipal water and sanitation services using the case of Nairobi, Kenya, a city widely regarded
as the economic hub of East Africa. In particular, these essays examine the performance of the
existing increasing block tariff (IBT) implemented by the Nairobi City Water and Sewer
Company (NCWSC) and a suite of potential alternative tariffs relative to several indicators of
tariff performance. The IBT is among the most widely used tariffs by water utilities, particularly
in developing countries. According to a recent survey of water utilities across the globe, 53%
percent of utilities in the sample implement an IBT, with 74% percent of utilities in developing
countries doing so (GWI 2013).
In a traditional IBT, the marginal price for water use increases from one usage block to
the next and customers are charged the marginal price for water use in each block accordingly.
The popularity of the IBT reflects two widely held perceptions about its potential merits. First,
policy makers believe a low marginal price in the lowest usage block of an IBT, often referred to
as a “lifeline block”, will ensure that low-income households have access to a certain quantity of
water at a price deemed affordable. Second, they believe that higher prices in the upper block(s)
of the IBT can both prevent wasteful or extravagant water use and provide an opportunity to
improve cost recovery from households who use more water.
The first essay of the dissertation combines data on households’ socioeconomic status
residential customers receive a disproportionate share of subsidies and that subsidy targeting is
poor even among households with a private metered connection. I also find that stated
expenditure on water, a commonly used means of estimating water use, is a poor proxy for
metered use and that previous studies on subsidy incidence underestimate the magnitude of the
subsidy delivered through water tariffs. These findings have implications for both the design and
evaluation of water tariffs in developing countries.
Subsidy targeting is, however, only one of several criteria that policy makers might
consider when designing tariffs for water and sanitation services. Recognizing this, the second
essay of the dissertation provides a systemic review of the literature pricing water and sanitation
services, highlighting ways in which insights from the literature might inform water and
sanitation service pricing and identifying areas for future research. I find that the empirical
literature on pricing municipal water and sanitation services is diverse and fragmented. Studies
identified through this systematic review are published in a wide range of journals and vary
considerably with respect to their core aims, methods, number of tariffs examined, and the
indicators of tariff performance considered. However, the majority of studies examine two or
fewer objectives, limiting the extent to which the literature characterizes the tradeoffs policy
makers often face when setting tariffs for municipal water and sanitation services. I also find that
the majority of studies in the literature focus on water pricing in industrialized countries,
highlighting an opportunity for research on water pricing in low and middle-income countries.
Informed by the second essay, the third essay develops a framework for simulating the
performance of water and sanitation tariffs with respect to several policy-relevant criteria. I then
apply this framework to the case of Nairobi. In particular, I examine the performance of five
Sewer Company (NCWSC) at three different levels of cost recovery. I then evaluate the
performance of alternative tariffs relative to several indicators of tariff performance, including:
the overall quantity of water sold (i.e., conservation), the magnitude of the total subsidy
delivered through the tariff, subsidy incidence, and overall changes in social welfare. I also
examine how the tariff alternatives perform under uncertainty about consumer behavior.
Contrary to conventional wisdom, I find that tariff alternatives with a uniform volumetric price
perform equally well or better than IBT tariff alternatives at the three levels of cost recovery we
examine. This includes both a two-part tariff long promoted by economists (i.e., uniform price
with rebate) as well as a simple tariff with a uniform volumetric price. These findings are robust
to assumptions about whether customers respond to average or marginal price. Overall, these
findings add to a growing body of evidence that challenges commonly held perceptions about
IBTs and suggest that the attention policy makers and tariff consultants pay to selecting the size
of the lifeline block and number of blocks in an IBT is misdirected. These findings also
underscore the benefits of getting utilities on path to full cost recovery, a critically important
component of financing the global infrastructure transition required to ensure universal access to
REFERENCES
American Society for Civil Engineers (ASCE). 2013. Report Card for America’s Infrastructure. American Society for Civil Engineers: Reston, VA. Available at:
http://www.infrastructurescorecard.org.
Global Water Intelligence (GWI). 2013. Global Water Tariff Survey. Oxford, U. K. Available at http://www.globalwaterintel.com/global-water-intelligence-magazine/tariff-survey/. Hutton, G. and M. Varughese. 2016. The cost of meeting the 2030 Sustainable Development
Goals targets on drinking water, hygiene, and sanitation. Water and Sanitation Program: Technical Paper 103171.
Kochar, K., Pattillo, C., Sun, Y. Suphaphiphat, N., Swiston, A., Tchaide, R., Clements, B., Fabrizio, S., Flamini, V., Reidfer, L., and H. Finger. 2015. Is the glass empty or half full? Issues in managing water challenges and policy instruments. IMF Staff Discussion Note SDN/11/11.
CHAPTER 1: WATER AND SANITATION SERVICE DELIVERY, PRICING, AND THE POOR: AN EMPIRICAL ESTIMATE OF SUBSIDY INCIDENCE IN NAIROBI,
KENYA2
1.1 Introduction
The increasing block tariff (IBT) is among the most widely used tariffs by water utilities,
particularly in developing countries. According to a recent survey of water utilities across the
globe, 53% percent of utilities in the sample implement an IBT, with 74% percent of utilities in
developing countries doing so (GWI 2013). In a traditional IBT, the marginal price for water use
increases from one usage block to the next and customers are charged the marginal price for
water use in each block accordingly. The popularity of the IBT reflects two widely held
perceptions about its potential merits. First, policy makers believe a low marginal price in the
lowest usage block of an IBT, often referred to as a “lifeline block”, will ensure that low-income
households have access to a certain quantity of water at a price deemed affordable. Second, they
believe that higher prices in the upper block(s) of the IBT can both prevent wasteful or
extravagant water use and provide an opportunity to improve cost recovery from households who
use more water. The intuitive appeal of the IBT rests on the implicit assumptions that all
households have a private piped connection to the water network and that low-income
households use less water than high-income households.
Scholars have long questioned whether these assumptions are valid in low and
middle-income countries (Whittington 1992; Boland and Whittington 2000; Komives et al. 2005). This
has led to a body of empirical work that has challenged common intuition about the poor, access
to water and sanitation services, and the relationship between household income and water use
(e.g., Komives et al. 2006; Komives et al. 2007; Banerjee et al. 2008; Banerjee and Morella
2011; Barde and Lehman 2014). In this paper, we examine the distributional incidence of
subsidies delivered through the increasing block water tariff in Nairobi, Kenya. We combine
socioeconomic data from a household survey with household data on metered water use to
estimate the distribution of subsidies among residential customers with a private metered
connection in Nairobi. We then use a complete set of customer billing records from Nairobi City
Water and Sewer Company (NCWSC) to estimate the distribution of subsidies among all
residential customers, including those with shared connections. Finally, we expand the scope of
our analysis and examine the distribution of subsidies among residential and nonresidential
customers in Nairobi.
Our analysis departs from existing studies in the subsidy incidence literature in three
ways. First, studies in the literature typically use stated expenditure on water from household
interviews to estimate water use. To our knowledge, this study is the first to combine
household-level socioeconomic data with data on metered water use to estimate subsidy incidence in the
water sector. Second, unlike the majority of studies in the literature, we use empirical
city-specific estimates of the cost of providing water and wastewater services to estimate subsidy
incidence. Finally, all previous studies in the literature focus on the distribution of subsidies
among residential customers. Our study extends the literature by examining the distribution of
We find that the IBT implemented in Nairobi is not targeting subsidies to low-income
households effectively. Among households with a private metered connection, households in the
lowest wealth quintile receive less than 20% of the subsidies delivered to these customers.
Subsidy targeting improves slightly when we examine subsidy incidence among all residential
customers, but higher-income customers still receive a disproportionate share of subsidies. Our
analysis of subsidy incidence among all customer classes indicates that non-residential (e.g.,
commercial, industrial, bulk water, etc.) customers, who constitute 5% of customer accounts,
receive over a third of the subsidies delivered through the tariff. We also find that stated
expenditure is a poor proxy for metered water and that the magnitude of the subsidy delivered
through the water tariff is substantially larger than previous studies would suggest.
The remainder of the paper is organized as follows. The second section of the paper
discusses the issue of subsidy incidence and provides a review of the subsidy incidence literature
in the water sector. The third and fourth sections describe our empirical strategy and the data
used in our analysis, respectively. The fifth section presents our results. The final section
provides a discussion of our results and some concluding remarks.
1.2 Background and Literature Review
Despite the intuitive appeal of IBTs, there are a number of reasons why the IBT may not
effectively target subsidies to low-income households in many low- and middle-income country
contexts. For example, in order for a household to receive a subsidy that is delivered through the
water tariff, it must have a piped connection. However, poor households often lack a piped water
likely than wealthier households to have a shared connection to the piped water network (e.g., a
yard tap) and to live in multi-unit dwellings that are served by a single meter. Households that
share a connection or live in a multi-unit dwelling served by a single meter pay a higher
volumetric price for water than if they had an individual meter because the collective water use
of those who share a connection falls in the upper, more expensive, blocks of the IBT. Finally,
the extent to which household income and water use are highly correlated is an empirical
question, even among households with a private piped connection. Indeed, the limited empirical
evidence in the literature suggests that the correlation between household income and water use
is much less than commonly assumed (Whittington et al. 2015).
Concerns about the extent to which the IBT, and utility tariffs more broadly, can be used
to effectively target subsidies to low-income households has led to a body of empirical research
on subsidy incidence. (See Appendix 1-1for a summary of studies that have been published on
subsidy incidence since 2000.) To calculate the distributional incidence of subsidies delivered
through the water tariff, the analyst needs information on the magnitude of the subsidy received
by each household and the relative income or wealth of each household. The subsidy received by
each household is the difference between what it costs to provide the particular household with a
particular level of service (e.g., water or water and wastewater service) and what the household
actually pays for this service.
The cost of serving each household is a function of households’ water use, whether the
household has only water or water and wastewater service (i.e., their “level of service”), and the
unit cost of providing water and wastewater services. The amount households pay for water and
sanitation service is a function of households’ water use, their level of service, and the tariff the
analyst must have five pieces of information to estimate subsidy incidence: households’ water
use, households’ service level, the unit cost of providing water and wastewater services, the
tariff, and some measure of households’ wealth or socioeconomic status. Assembling this
information can be quite difficult in practice. (See Gomez-Lobo et al. (2000) for an overview of
information and modeling challenges associated with designing water and sanitation tariffs.)
For example, data on households’ socioeconomic status and demographics are typically
available in secondary household survey data, such as national income and expenditure surveys,
World Bank Living Standards Measurement Study (LSMS) data, and some national censuses.
However, these surveys typically do not contain information on household water use. Similarly,
utility billing records contain information on household water use, provided customers are
metered, the meters are working, and the utility regularly reads customers’ meters.Due to
confidentiality requirements, however, it is typically not possible to match household level
socioeconomic data in nationally representative household income and expenditure surveys and
customer data in utility billing records.
Because it can be difficult or not possible to obtain good measures of both socioeconomic
status and water use for the same household, studies in the literature typically use a single data
source to obtain information on both households’ socioeconomic status and water use. In
particular, most studies use households’ stated expenditure on water to estimate households’
water use. They collect this information either through primary household surveys (e.g., Foster
2004, Bardasi and Wodon 2008, and Angel-Urdinola and Wodon 2012) or from nationally
representative household budget and expenditure surveys (e.g., World Bank LSMS data). (See
Appendix 1-2 for a discussion of why stated expenditure may not be a good proxy for metered
Studies in the subsidy incidence literature (Appendix 1-1) address the issue of cost in
three general ways. (Appendix 1-3 provides a summary of cost estimates used in the literature.)
First, studies may use generic cost estimates, or international benchmarks, to calculate subsidy
incidence (e.g., Komives et al. 2005, Komives et al. 2006, Foster and Yepes 2006). Common
sources for generic cost estimates include GWI (2004) and Kingdom et al. (2004). Other studies
use empirical, site-specific cost estimates (e.g., Groom et al. 2008, Banerjee and Morella 2011,
Walker et al. 2000). However, these studies typically do not explicitly state what the cost
estimates include or precisely how they were derived. Finally, studies may make ad hoc
assumptions about the cost of providing water and wastewater services. For example, Barde and
Lehmann (2014) assume that the average tariff currently implemented in Lima, Peru
(approximately 0.64 USD/m3) represents full cost recovery.
There is broad consensus in the literature that de facto subsidies delivered through the
water tariff are poorly targeted and largely regressive (see Appendix 1-1). Indeed, many studies
find that subsidies delivered through the water tariff perform worse than if the subsidies were
equally distributed among the population. This is principally due to the fact that low-income
households are less likely to have a private connection to the piped water network and, thus, do
not receive subsidies delivered through the water tariff.
Studies that examine subsidy incidence only among households with a piped connection
also find that subsidies are poorly targeted. This is primarily because income and water use are
often not highly correlated and the tariff implemented by many utilities is not sufficient to cover
the cost of providing service. These empirical results are supported by simulations conducted by
Whittington et al. (2015) that suggest little can be done to improve subsidy targeting when tariffs
There are three main gaps in the water literature on subsidy incidence. First, studies in the
literature either focus only on subsidies associated with the delivery of piped water service or do
not explicitly state whether they include subsidies associated with wastewater service. Piped
wastewater services are usually more expensive to provide than piped water services. To the
extent that wastewater services are sold below cost and to the extent that higher-income
households are more likely to have connections to the piped wastewater network, estimates in the
literature may overestimate the performance of subsidies delivered through the tariff.
Second, nearly all of the studies in the literature use stated expenditure to estimate water
use, which may be a poor proxy for metered water use. Thus, it is unclear whether the broad
consensus in the literature is attributable to the fact that studies use the same, potentially flawed,
measure of water use.
Finally, all of the studies in Appendix 1-1 focus on subsidy incidence only among
residential customers. This is not surprising given that these studies use data from household
surveys. As a result, however, the literature ignores the distributional issues between residential
and non-residential (e.g., commercial, industrial, bulk, etc.) customers. Depending on the tariff
applied to non-residential customers, failing to include non-residential customers may over or
understate the magnitude of total subsidies delivered through the water tariff.
1.3 Empirical Strategy
This study was designed to fill these gaps in the subsidy incidence literature. Our
empirical strategy proceeds in three analytical steps. In the first step of our analysis, we combine
water use from NCWSC billing records. We use these data to: 1) estimate the distribution of
subsidies among households with a private metered connection, and 2) examine the extent to
which stated expenditure is an accurate proxy of metered water use. We focus this first step of
the analysis on households with a private metered connection to capture the relationship between
household income and water use. Households who shared a connection with another household
or family were excluded from our survey sample.
According to the most recent census, less than a quarter of households in Nairobi
reported using a private connection to the piped water network as their primary drinking source
(KNBS 2009). Approximately half of households used piped water that is not delivered into their
dwelling (e.g. a shared tap) as their primary drinking water source. Thus, in the second step of
our analysis, we examine the distribution of subsidies among all NCWSC’s residential
customers, which includes residential customers with shared connections. In the third, final, step
we expand the scope of our analysis to examine the distribution of subsidies among residential
and non-residential customers in Nairobi.
1.3.1 Subsidy Incidence
We obtained information on customer water use from 21 months of NCWSC’s billing
records. Like many utilities, NCWSC does not read each meter every month. (NCWSC reads
approximately 75% of meters each month.) To address this, we calculate monthly water use
𝑊𝑈𝑆𝐸𝑖,𝑡= [
𝑅𝐸𝐴𝐷𝐼𝑁𝐺𝑖,𝑡− 𝑅𝐸𝐴𝐷𝐼𝑁𝐺𝑖,𝑡−1 𝑅𝐷𝐴𝑇𝐸𝑖,𝑡− 𝑅𝐷𝐴𝑇𝐸𝑖,𝑡−1
] ∙ 30.5 𝑑𝑎𝑦𝑠 (1.1)
where:
• WUSEi,t is the water use for household i in month t;
• READINGi,t is the meter reading for household i in month t;
• READINGi,t-1 is the previous actual meter reading for household i;
• RDATEi,t is the date on which NCWSC read the meter for household i in month t; and
• RDATEi,t-1 is the date of the previous actual meter reading for household i.
We then use the estimates of households’ monthly water use obtained in Equation 1.1 to
calculate households’ average monthly water use over the period covered by the billing records.
We define the subsidy received by each customer as the difference between the cost to
serve each household and what the households pay for service. Our analysis of NCWSC’s billing
records confirms that the utility implements the official tariff (Table 1.1) to calculate customers’
water and sewer bills. Thus, we calculate how much a customer pays by applying NCWSC’s
official tariff to our estimates of customers’ average monthly water use. (NCWSC implements an
IBT with 4 usage blocks. In addition to the fixed charge for meter rent, NCWSC applies a
minimum charge for 10 m3/mo. Households that use less than 10 m3/mo. are charged for 10
m3/mo. NCWSC charges customers with a connection to the sewer network an additional 75% of
the volumetric portion of their water bill for wastewater service.)
𝐶𝑂𝑆𝑇𝑖 = 𝑊𝑈𝑆𝐸𝑖∙ 𝑊𝐶𝑂𝑆𝑇 + 𝐼𝑤𝑤,𝑖∙ (𝑊𝑈𝑆𝐸𝑖 ∙ 𝑊𝑊𝐶𝑂𝑆𝑇) (1.2)
where:
• COSTi is the average monthly cost of serving household i (USD/month);
• WUSEi is the average water use of household i from Equation 1.1 (m3/month);
• WCOST is the average volumetric cost of providing water service (USD/m3);
• WWCOST is the average volumetric cost of providing wastewater service (USD/m3); and
• Iww,i is an indicator variable that takes the value 1 if a household has wastewater service
and 0 otherwise.
We develop empirical estimates of the average cost of providing water and wastewater
services. Our cost estimates include both operations and maintenance as well as capital costs.
They do not include the opportunity cost of the raw water supply. We estimate subsidy shares,
the share of subsidies received by different groups of customers, to assess subsidy incidence.
(Note that we do not examine affordability because this requires making ad hoc assumptions
about what is and is not “affordable”.) Equation 1.3 defines the share of subsidies going to a
particular group of customers.
𝑆𝑗 =
∑ 𝑆𝑈𝐵𝑖 𝑛𝑗 𝑖=1
∑ ∑ 𝑆𝑈𝐵𝑖
𝑛𝑗 𝑖=1 𝐽 𝑗=1
(1.3)
where:
• Sj is the share of subsidies received by customer group j (j=1…J), and
In the first step of our analysis, j indexes the five wealth quintiles of our survey sample.
In the second step, j indexes accounts located in low income areas and accounts in non-low
income areas. In the final step of our analysis, j indexes residential, non-residential, kiosk, and
bulk customer classes.
1.3.2 Stated Expenditure as a Proxy for Water Use
We also examine whether stated expenditure is an accurate proxy for metered water use
by estimating household water use from households’ stated expenditure on water and comparing
this to their metered water use. To do this, we ask households if they can recall the amount of
their last bill from NCWSC and the number of months of service the bill covered. Equation 1.4
shows how we impute water use for customers with only piped water service. We use an
analogous approach to impute water use for customers with both water and sewer service.
𝐼𝑀𝑃𝑈𝑆𝐸𝑖 = (𝐸𝑋𝑃𝑆𝑖 − 𝑅𝐸𝑁𝑇) 𝑝1 𝑖𝑓 𝐸𝑋𝑃𝑆⁄ 𝑖 > 0 & 𝐸𝑋𝑃𝑆𝑖 ≤ 𝑏1𝑚𝑎𝑥𝑤 (1.4) = 𝑏1 + (𝐸𝑋𝑃𝑆𝑖 − 𝑏1𝑚𝑎𝑥𝑤) 𝑝2 𝑖𝑓 𝐸𝑋𝑃𝑆⁄ 𝑖 > 𝑏1𝑚𝑎𝑥𝑤 & 𝐸𝑋𝑃𝑆𝑖 ≤ 𝑏2𝑚𝑎𝑥𝑤
= 𝑏2 + (𝐸𝑋𝑃𝑆𝑖 − 𝑏2𝑚𝑎𝑥𝑤) 𝑝3 𝑖𝑓 𝐸𝑋𝑃𝑆⁄ 𝑖 > 𝑏2𝑚𝑎𝑥𝑤 & 𝐸𝑋𝑃𝑆𝑖 ≤ 𝑏3𝑚𝑎𝑥𝑤
= 𝑏3 + (𝐸𝑋𝑃𝑆𝑖 − 𝑏3𝑚𝑎𝑥𝑤) 𝑝4 𝑖𝑓 𝐸𝑋𝑃𝑆⁄ 𝑖 > 𝑏3𝑚𝑎𝑥𝑤
where:
• IMPUSEi is the imputed water use for household i (m3/mo.);
• EXPSi is the stated expenditure for household i (KSH/mo.);
• RENT is the monthly meter rent charged in the NCWSC tariff (Table 1.1);
• bX is the volumetric upper bound for the Xth block in the NCWSC tariff (Table 1.1); and
• bXmaxw is the amount a water customer would be charged for consuming the maximum
amount in the Xth block of the NCWSC tariff.
1.4 Data
The first step of our analysis examines subsidy incidence among households with a
private connection to the piped water network. For this analysis, we use data from a sample of
656 households that were randomly drawn from two of Nairobi’s six service regions, which were
purposefully selected to ensure income heterogeneity in our sample. (See Appendix 1-4 for a
detailed description of the survey and sampling strategy.) The survey was conducted between
November 2013 and January 2014 and collected a range of socioeconomic and demographic
information from households, including data on monthly income, household expenditure, and
asset ownership. Following Filmer and Pritchett (2001) and Filmer and Scott (2008), we use
principal component analysis to construct an asset index to serve as a proxy for wealth (see
Appendix 1-5). We use the asset index as our primary proxy for wealth because approximately
15% of respondents in our sample refused to provide information about their monthly household
income. (Assets included in the index include: liquid propane gas (LPG) as a main cooking fuel,
biomass or kerosene as a main cooking fuel, separate kitchen, security guard, connection to the
electricity grid, mobile phone, internet connection, TV, radio, computer, private car, washing
machine, refrigerator, borewell, and additional land in/out of Nairobi.)
We obtain information on customer water use from 21 months of NCWSC’s billing
challenge in our empirical strategy was to identify households in our survey sample in the billing
records. Like many cities in developing countries, Nairobi does not have a formal system of
addresses. Thus, it was not possible to first construct our sample from the billing records and
then locate households to conduct the household survey. To address this, we used households’
account numbers to identify households in our sample in the billing records. Because households
do not typically know their NCWSC account number, however, we obtained households’
account numbers by matching the serial number on households’ water meter with the account
number on the NCWSC marketing assistant’s itinerary. When possible we verified the the
account number with a physical copy of a household’s recent water bill. (Fifty-six percent of
households in our sample were able to show enumerators a copy of their water bill. All account
numbers matched the accounts associated with the meter serial numbers.)
We use data from five years of audited financial statements (FY 2007 to 2012) to
estimate NCWSC’s average operations and maintenance costs. We derive capital cost estimates
from data in NCWSC’s water master plan (MoWI & AWSB 2014) and interviews with senior
water and sanitation engineers at NCWSC, Athi Water Services Board, and local engineering
firms. Table 1.2 presents the cost estimates we use in our analysis. Assuming 35% non-revenue
water, we estimate the full cost (O&M plus capital costs) of water service to be 1.40 USD/m3
and 1.46 USD/m3 for wastewater service. (Non-revenue water refers to water the utility produces
but for which it does not receive revenue.) These estimates are higher than the cost estimates
used in many studies, but of similar magnitude to the cost estimates in GWI (2004) and Kingdom
et al. (2004) once non-revenue is accounted for (see Tables A1-3a and A1-3b in Appendix 1-3).
For the analysis of subsidy incidence among all residential customers and among all
residential customers from 21 months of NCWSC’s billing records. NCWSC does not have
socioeconomic or demographic information about its customers. In the absence of
household-level data on income or socioeconomic status, one could potentially use household budget and
expenditure survey data or recent census data to obtain aggregate data on household
characteristics. This is not possible in Nairobi for two reasons. First, the most recent Kenya
Integrated Household Budget and Expenditure Survey (2005-6) contains only 685 observations
from Nairobi. Second, data from the most recent census are not publicly available.
To address this, we use the geographic location of customer accounts as a proxy for
relative wealth. In particular, we use the GIS location of customer accounts to identify which
accounts are located in low-income areas. Information on the GIS location of each account was
collected by NCWSC as part of a pilot program to conduct meter reading with smartphones. As
of May 2015, approximately 85% of the 180,000 residential customer accounts were geocoded.
We obtain information on the location and extent of low-income areas in Nairobi from
the MajiData project of Kenya’s Ministry of Water and Irrigation (MoWI) and Water Services
Trust Fund (WSTF) (MoWI & WSTF 2015). The MajiData project is a multi-year effort to
create a database of information related to water and sanitation service provision in all of
Kenya’s urban low-income areas. As part of this process, the MajiData team identified and
mapped low income areas in the service area of each Water Service Provider in Kenya using
publicly available data, stakeholder consultations, and transect walks of each service area (MoWI
& WSTF 2008). MajiData’s classification of low-income areas includes informal settlements,
planned areas with planned low income housing, and informal housing in planned residential
areas. To our knowledge, this information is the most comprehensive, up to date mapping of
For our analysis of subsidy incidence among all customer classes, we obtain water use
data from the same set of NCWSC billing records described above. NCWSC billing data include
13 different customer classes. We group these customer classes into four general types:
residential, non-residential, bulk, and kiosk. Our non-residential customer type includes accounts
classified as government, community, and industrial.
1.5 Results
1.5.1 Household Survey – Subsidy Incidence
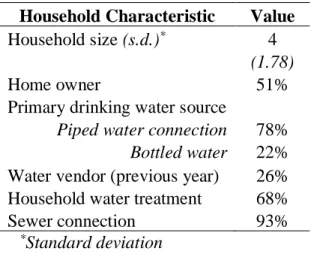
Table 1.3 presents information on selected characteristics of households in our survey
sample. The average household in our sample has four members, which is consistent with the
average household size in Nairobi from the latest census. Approximately half of the households
in our sample rent their home. Over ninety percent of households in our sample have a sewer
connection. Seventy-eight percent of households in our survey report using their piped water
connection as their primary drinking water source. The remaining 22% report using bottled water
for their primary drinking water source. Over a quarter of households in our sample report
purchasing water from a vendor in the previous year, which reflects the fact that NCWSC does
not provide customers 24x7 water service.
Mean and median water use in our survey sample are 19 m3/mo. and 13 m3/mo.,
respectively (Figure 1.1). Average water use among all residential customers in the NCWSC
billing data is 31 m3/mo. However, the mean water use of households on meter-reader itineraries
the households in the sample have water use that falls in the first two usage blocks (below 30
m3/mo.). Only 4% of the sample falls in the upper-most block of NCWSC’s tariff (>60 m3/mo.).
We find considerable heterogeneity in water use, both within and across wealth quintiles.
(This heterogeneity persists if we examine only three wealth groups.) Figure 1.2 plots household
water use versus the households’ wealth index score. The correlation between a household’s
wealth index score and water use in our sample is 0.20. Mean water use is 16 m3/hh/mo. for
households in the first (lowest) wealth quintile and 30 m3/hh/mo. for households in the fifth
(highest) wealth quintile (Table 1.4).
Table 1.4 also shows the average monthly bill for households in the five wealth quintiles.
The mean bill for households in the lowest quintile is 931 KSH/hh/mo. (approximately 10
USD/hh/mo.). The mean bill for households in the highest wealth quintile is 1509 KSH/hh/mo.
(approximately 17 USD/hh/mo.). As a point of comparison, the mean water and sewer bill for
households in the lowest quintile is only 60% of what these households report paying for
electricity. For the wealthiest households in the sample, the mean bill is less than a quarter of
what they report spending on electricity.
Table 1.4 presents the average price paid by households in each wealth quintile. For the
full sample, the mean average price ranges from 79 KSH/m3 (0.90 USD/m3) to 50 KSH/m3 (0.56
USD/m3) across wealth quintiles. The mean average price for households in the lowest wealth
quintile is 70 KSH/m3 (0.79 USD/m3) and 50 KSH/m3 (0.56 USD/m3) for households in the
highest wealth quintile. Households in the lowest quintile face a higher average price than
households in in the highest quintile because the tariff includes both a positive fixed and
average price estimates reflect the fact that over 90% of households in our sample have a sewer
connection.
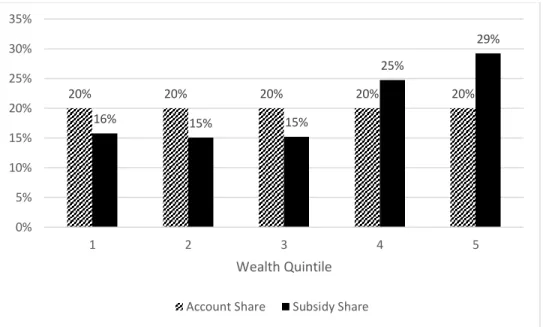
Figure 1.3 shows the distribution of subsidies across wealth quintiles. If the subsidy were
evenly, or randomly, distributed among the population, each wealth quintile would receive 20%
of the total subsidy. A well-targeted subsidy would deliver a substantial share of the total
subsidies to low-income households. In our sample, households in the lowest quintile receive
only 16% of the total subsidy. Households in the top three wealth quintiles receive nearly 70% of
the total subsidy, with households in the highest wealth quintile receiving almost 30% of the total
subsidy.
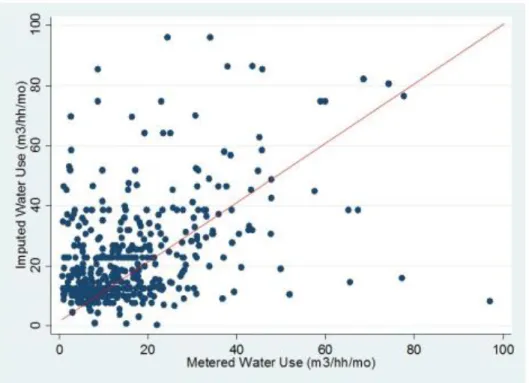
1.5.2 Household Survey – Stated Expenditure as a Proxy for Metered Water Use
During the survey, we asked households if they can recall the amount of their last bill
from NCWSC. Nearly 85% of households in our sample indicated that they could, considerably
higher than the 30% percent reported in Foster (2004). Figure 1.4 presents a scatter plot of
metered versus imputed water use for households who could recall the amount of their previous
water bill. The 45-degree line in Figure 1.4 traces a line of equality for which imputed and
metered water use would be the same for each household. The scatter plot in Figure 1.4 displays
a high degree of dispersion, indicating that stated expenditure does not provide an accurate proxy
for metered water use in our sample.
We find that stated expenditure typically overestimates households’ water use, often by a
substantial amount. This is reflected in Table 1.5, which provides summary statistics of metered
m3/mo. The average water use imputed from stated expenditure among the sample, however, was
27 m3/mo. (42% higher).
1.5.3 Subsidy Incidence Among All Residential Customers
The results presented above examine subsidy incidence among our survey sample, all of
whom had a private piped connection. In the second step of our analysis we expand the scope of
our inquiry to examine subsidy incidence among all residential customers. This analysis includes
households with a private piped connection as well as households served by a shared connection.
NCWSC does not have information on whether accounts are served by shared or individual
connections. Thus, the results below examine subsidy incidence among all residential customers
and do not directly address water use or subsidy incidence among accounts with shared and
individual connections.
Approximately 20% of residential customer accounts in NCWSCs billing records are
located in low-income areas identified in the MajiData database. Table 1.6 provides a summary
of water use among residential accounts of different income levels. The mean and median water
use in accounts located in low-income areas is 30 m3/mo. and 12 m3/mo., respectively. This is
only slightly lower than the mean (33 m3/mo.) and median (14 m3/mo.) water use of accounts
that are not located in low-income areas.
Figure 1.5 provides a summary of subsidy incidence among all NCWSC’s residential
customers. Accounts located in low-income areas constitute 19% of residential accounts and
receive 21% of the total subsidies delivered to residential customers. This is approximately the
same amount of subsidies that low-income customers would receive if the subsidy were evenly
1.5.4 Subsidy Incidence among all Customer Classes
We now turn to the results for subsidy incidence among all customer classes. Residential
accounts constitute 94% of NCWSC customers (Table 1.7). Nonresidential accounts represent
5% of NCWSC customers. The remaining 1% of accounts are official public kiosks and bulk
customers.
Despite the fact that residential accounts make up the vast majority of NCWSC
customers, they account for only 57% of the overall water use and 56% of total billings (Table
1.7). Non-residential customers, on the other hand, account for 35% of the overall water use and
41% of total billings.
We find that non-residential customers receive 31% of the total subsidy. By contrast,
residential customers receive 63% of the total subsidy delivered through the water tariff. Among
residential customers, accounts in high-income itineraries represent 21% of accounts and receive
19% of the total subsidy. Accounts in low-income itineraries represent 14% of total accounts and
receive only 9% of the total subsidies, far less than if subsidies were randomly distributed among
customers.
1.6 Discussion and Conclusions
Our analysis of subsidy incidence among a sample of 656 households in Nairobi with a
private metered connection indicates that households in the lowest wealth quintile receive only
15% of the total subsidies delivered to households in our sample. In contrast, households in the
customers with a private metered connection, the current water tariff performs worse than if the
subsidy was randomly distributed among households.
In Nairobi, the poor targeting of the subsidies even among households with a private
metered connection is driven by a combination of three factors. First, very few customers’ water
use falls in the uppermost blocks of NCWSC’s IBT (Figure 1.1). Indeed, over 80% of
households in our sample fall in the first two blocks of NCWSC’s tariff. Thus, irrespective of the
prices in each block there is not a sufficient number of customers in the upper blocks to enable a
meaningful level of cross-subsidy. Second, at current prices nearly all customers are being
subsidized. The average price paid for water and sanitation services among the wealth quintiles
in our sample ranges from 0.56 USD/m3 to 0.90 USD/m3. In contrast, we estimate the full cost of
providing water and sanitation services in Nairobi to be approximately 2.86 USD/m3. When
nearly all customers are subsidized, it is not possible for a subsidy delivered through the tariff to
effectively target subsidies to intended beneficiaries. Finally, contrary to common intuition, we
find a low correlation between our wealth proxy and water use, which is consistent with the
limited data that exist in the literature (Whittington et al. 2015).
We also find that stated expenditure is a poor proxy for metered water use. Despite the
significant measurement error associated with using stated expenditure as a proxy for water use,
we find that using stated expenditure to estimate subsidy incidence does not change the policy
implications of our results. This is true in our sample because the majority of NCWSC customers
have arrears or credits on their accounts, and we find a low correlation between income and
whether customers have arrears or credits. This may not be true in other places. Thus, our
findings suggest that researchers should exercise caution when using stated expenditure to
When we expand our analysis to the distribution of subsidies among all NCWSC’s
180,000 residential customers, we find that subsidy incidence improves very slightly. Among all
residential customers, customers located in low-income areas account for approximately 19% of
total residential accounts and receive 21% of the total subsidies delivered to residential
customers. This seemingly counterintuitive result can be explained by the fact that low-income
customers are more likely to have shared connections, which register high levels of water use,
and all water use is subsidized at current prices. While subsidy targeting among all residential
customers is slightly better than subsidy incidence among only households with a private
connection, errors of inclusion remain high and customers in low-income areas are no better off
than if subsidies were randomly distributed among residential customers.
Finally, our analysis of subsidy incidence among all customer classes indicates that
non-residential customers receive over one-third of the total subsidies delivered through NCWSC’s
tariff. Residential customers receive only 63% of the total subsidies. This is not surprising given
that all customers are subsidized at current prices and non-residential customers account for
nearly 40% of total water use. However, policy makers often implement an IBT with a lifeline
block specifically to target subsidies to low-income, residential customers. We find that this is
not occurring in Nairobi. Our results highlight the importance of examining subsidy incidence
among all customer classes, which has largely been ignored in the literature.
In addition to our findings related to subsidy incidence, our analysis raises important
issues about the magnitude of the subsidy delivered through the water tariff. Most studies on
subsidy incidence focus on subsidies associated with piped water service among only residential
customers. They do not examine subsidies associated with sewer service or subsidies delivered to
this manner would lead to a substantial underestimate of the magnitude of the subsidy delivered
through the water tariff.
In Nairobi, examining subsidies associated with piped water service among residential
customers would result in a total subsidy that is approximately 40% less than the subsidy
associated with both piped water and sanitation services for residential customers. Similarly, we
find that examining subsidies associated with both piped water and sewer services among only
residential customers would underestimate the total subsidy delivered through the water tariff by
45%. In total, focusing only on subsidies associated with providing water service to residential
customers would underestimate the magnitude of the subsidy delivered through the water tariff
by 65%. We estimate that the total subsidy delivered through the tariff is approximately one and
half times NCWSC’s total billings.
Policy makers in the water sector often express concern about the affordability of water
and wastewater services, especially for low-income households. This concern is often misplaced
because the poorest residents in cities typically rely on vended water from public kiosks or
private vendors. (For example, in Nairobi the price of vended water from public kiosks is 2
KSH/20L (1.11 USD/m3), which is closer to full cost recovery for water supply (1.40 USD/m3)
than the volumetric price for water in the tariff applied to metered residential connections.)
Nonetheless, policy makers’ concern about affordability is often the primary justification for
keeping water prices low and for implementing an IBT that includes a lifeline block. Our
findings add to a growing body of empirical literature that suggests that IBTs implemented by
many utilities do not effectively target subsidies to low-income households. In Nairobi, we find
this is particularly true when examining subsidy incidence among all customer classes, but also
given that the poorest households often lack access to piped water and sanitation services
altogether. This growing body of evidence suggests that the IBT is an ineffective and often
expensive means of delivering subsidies to low-income households. Thus, if policy makers want
to subsidize water and sanitation services for low-income households, they should explore
alternative subsidy delivery mechanisms, including both connection subsidies and means-tested
REFERENCES
Angel-Urdinola, D., and Q. Wodon. 2007. Do Utility Subsidies Reach the Poor? Framework and Evidence for Cape Verde, Sao Tome, and Rwanda. Economics Bulletin 9(4): 1-7.
Angel-Urdinola, D.F., and Q. Wodon. 2012. Does Increasing Access to Infrastructure Services Improve the Targeting Performance of Water Subsidies? Journal of International Development 24(1): 88-101.
Banerjee, S.G., and E. Morella. 2011. Africa’s Water and Sanitation Infrastructure: Access, Affordability and Alternatives. Washington, DC: World Bank.
Banerjee, S., V. Foster, Y. Ying, H. Skilling, and Q. Wodon. 2008. Cost Recovery, Equity and Efficiency in Water Tariffs: Evidence from African Utilities. World Bank Policy Research Working Paper No. 5384. Washington, DC: World Bank.
Bardasi, E., and Q. Wodon. 2008. Who Pays the Most for Water? Alternative Providers and Service Costs in Niger. Economics Bulletin 9(20): 1-10.
Barde, J.A., and P. Lehmann. 2014. Distributional Effects of Water Tariff Reforms–an Empirical Study for Lima, Peru. Water Resources and Economics. (In press).
Boland, J., and D. Whittington. 2000. “The Political Economy of Water Tariff Design in Developing Countries: IBTs versus Uniform Price with Rebate.” In The Political
Economy of Water Pricing Reforms, edited by Ariel Dinar. New York: Oxford University Press.
Diakité, D., Semenov, A. and A. Thomas. 2009. A Proposal for Social Pricing of Water Supply in Côte d'Ivoire. Journal of Development Economics 88(2): 258-268.
Fankhauser, S., and S. Tepic. 2007. Can Poor Consumers Pay for Energy and Water? An Affordability Analysis for Transition Countries. Energy Policy 35(2): 1038-1049.
Filmer, D., and L. Pritchett. 2001. Estimating Wealth Effects without Expenditure Data - or Tears: An Application to Educational Enrollments in States in India. Demography 38(1): 115-32.
Filmer, D., and K. Scott. 2008. Assessing Asset Indices. World Bank Policy Research Paper 4605. Washington, DC: World Bank.
Foster, V. 2004. Toward a Social Policy for Argentina's Infrastructure Sectors: Evaluating the Past and Exploring the Future. World Bank Policy Research Working Paper No. 3422. Washington, DC: World Bank.
Foster, V., and C. Araujo. 2004. Does Infrastructure Reform Work for the Poor? A Case Study From Guatemala. World Bank Policy Research Working Paper No. 3185. Washington, DC: World Bank.
Foster, V., and T. Yepes. 2006. Is Cost Recovery a Feasible Objective for Water and Electricity? The Latin American Experience. World Bank Policy Research Working Paper No. 3943. Washington, DC: World Bank.
García-Valinas, M.A., R. Martínez-Espineira, and F. González-Gómez. 2010. Affordability of Residential Water Tariffs: Alternative Measurement and Explanatory Factors in Southern Spain. Journal of Environmental Management 91(12): 2696-2706.
Groom, B., X. Liu, T. Swanson, and S. Zhang. 2008. “Resource Pricing and Poverty Alleviation: the Case of Block Tariffs for Water in Beijing.” In Coping with Water Deficiency 48: 213-37. Dordrecht: Springer Netherlands. doi:10.1007/978-1-4020-6615-3_9.
GWI. 2004. How Much Should Water Cost? Global Water Intelligence 5(9).
GWI. 2013. Global Water Tariff Survey. Available at: http://www.globalwaterintel.com/global-water-intelligence-magazine/tariff-survey/.
Gómez-Lobo, A., and D. Contreras. 2003. Water Subsidy Policies: A Comparison of the Chilean and Colombian Schemes. The World Bank Economic Review 17(3): 391-407.
Gómez-Lobo, A., V. Foster, and J. Halpern. 2000. Information and Modeling Issues in Designing Water and Sanitation Subsidy Schemes. World Bank Policy Research Working Paper 2345. Washington, DC: World Bank.
Kenya National Bureau of Statistics (KNBS). 2006. Kenya Integrated Household Budget and Expenditure Survey 2005/6.
Kenya National Bureau of Statistics (KNBS). 2009. Population and Housing Census 2009.
Kingdom, W., M. Van Ginneken, and C. Brocklehurst. 2004. Full Cost Recovery in the Urban Water Supply Sector: Implications for Affordability and Subsidy Design. Unpublished working paper.
Komives, K., J. Halpern, V. Foster, Q. Wodon, and R. Abdullah. 2006. The Distributional Incidence of Residential Water and Electricity Subsidies. World Bank Policy Research Paper No. 3878. Washington, DC: World Bank.
Komives, K., J. Halpern, V. Foster, Q. Wodon, and R. Abdullah. 2007. Utility Subsidies as Social Transfers: An Empirical Evaluation of Targeting Performance. Development Policy Review 25(6): 659-679.
Ministry of Water and Irrigation (MoWI) and Athi Water Services Board (AWSB). 2012. Feasibility Study and Master Plan for Nairobi and Satellite Towns. November 2012.
Ruijs, A. 2009. Welfare and Distribution Effects of Water Pricing Policies. Environmental and Resource Economics 43(2): 161-182.
Ruijs, A., A. Zimmermann, and M. van den Berg. 2008. Demand and Distributional Effects of Water Pricing Policies. Ecological Economics 66(2-3): 506-516.
Walker, I., P. Ordoñez, P. Serrano, and J. Halpern. 2000. Pricing Subsides and the Poor: Demand for Improved Water Services in Central America. World Bank Policy Research Paper No. 2468. Washington, DC: World Bank.
Whittington, D. 1992. Possible Adverse Effects of Increasing Block Water Tariffs in Developing Countries. Economic Development and Cultural Change 41(1): 75-87.
Whittington, D., and S. Pagiola. 2012. Using Contingent Valuation in the Design of Payments for Environmental Services Mechanisms: A Review and Assessment. The World Bank Research Observer 27(2): 261-287.
TABLES AND FIGURES
Table 1.1. Summary of the Tariff Implemented by Nairobi City Water and Sewerage Company.
Tariff Component
Residential, Commercial, and Industrial 0 to 10bm3/mo. 0.22 USD/m3
11 to 30 m3/mo. 0.45 USD/m3 31 to 60 m3/mo. 0.50 USD/m3 > 60 m3/mo. 0.63 USD/m3
Water Kiosk
All units 0.18 USD/m3
Bulk Supply
All units 0.31 USD/m3
Other Charges
Seweragec 75%
Meter Rent 0.59 USD/mo.
Connection Charges 29 USD
a Conversion rate = 90 KSH/USD.
b Customers charged for a minimum of 10 m3/mo. c Applied to the volumetric component of the water bill.
Table 1.2. Summary of Cost Estimates Used to Calculate Subsidy Incidence
Cost Component USD/m3 a
Water Serviceb 1.40
O&M 0.30
Capital Costsc 1.10
Wastewater Serviceb 1.46
Operations & Maintenance 0.30
Capital Costsc 1.16
a Conversion rate = 90 KSH/USD.
b Cost estimates assume 35% non-revenue water.
Table 1.3. Basic Characteristics of Households Surveyed
Household Characteristic Value
Household size (s.d.)* 4
(1.78)
Home owner 51%
Primary drinking water source Piped water connection 78%
Bottled water 22% Water vendor (previous year) 26% Household water treatment 68%
Sewer connection 93%
*Standard deviation
Table 1.4. Water Use, Representative Bill, and Average Price among Wealth Quintiles
Wealth Quintile
Unit 1 2 3 4 5 Overall
Mean water use (s.d.)* m3/hh/mo. 16 14 14 24 30 19
(30) (15) (17) (25) (32) (26) Representative water bill USD/hh/mo. 10.35 8.39 8.19 14.18 16.76 11.58
Average price USD/m3 0.79 0.90 0.83 0.62 0.56 0.74
*Standard deviation
Table 1.5. Summary Statistics for the Distributions of Metered and Imputed Water Use
Water Use Unit Mean Std. Dev. Min Max
Metered m3/mo. 19 24 0.7 292
Table 1.6. Summary of Water Use Among NCWSC Residential Customers
Residential Area
Water Use (m3/acct./mo.)
Classification Mean Median Std. Dev
Low income 33 14 220
Middle/high-income 30 12 127
All residential 31 12 194
Table 1.7. Summary of the Share of Accounts, Water Use, Billings, and Subsidies Among Four NCWSC Customer Classes
Customer Class
% Total Accounts
% Total Water
Use
% Total Billings
% Total Subsidy
Residential 94% 57% 56% 63%
Non-residential 5% 35% 41% 31%
Kiosk <1% 3% 1% 2%
Bulk <1% 4% 2% 3%
Figure 1.1. Distribution of Water Use among Survey Sample with NCWSC Tariff Blocks
0.00 0.10 0.20 0.30 0.40 0.50 0.60 0.70
0 10 20 30 40 50 60 70
0 10 20 30 40 50 60 70 80 90 100
U
SD
/m
3
N
o.
of
househol
ds
Water use (m3/hh/mo.)
Q1 Q2 Q3 Q4 Q5 Current Tariff
* Nine observations with water use above 100 m3/mo. not shown on the graph for scale purposes.
Figure 1.2. Scatter Plot of Monthly Household Water Use Versus Wealth.
Figure 1.3. Share of Subsidies Received by Each Wealth Quintile.
20% 20% 20% 20% 20%
16% 15% 15%
25%
29%
0% 5% 10% 15% 20% 25% 30% 35%
1 2 3 4 5
Wealth Quintile
Figure 1.4. Imputed Versus Metered Water Use
Figure 1.5. Share of Total Residential Accounts and Subsidies Received by Accounts in Low-income and Middle/High-Low-income Areas
19%
81%
21%
79%
0% 10% 20% 30% 40% 50% 60% 70% 80% 90%
Low income area Middle/high income areas