Developmental timing of tumor initiation determines treatment response and cellular composition of medulloblastoma
By Daniel Malawsky
Senior Honors Thesis Biostatistics
University of North Carolina at Chapel Hill
April 16th, 2020
Approved:
Professor Timothy Gershon, Thesis Advisor
Professor Yun Li, Departmental Advisor
1
Introduction
Medulloblastoma is the most common malignant pediatric brain tumor (1).
Medulloblastomas are formed in the cerebellum and have been resolved into four subtypes in humans: Sonic Hedgehog (SHH), WNT, group 3, and group 4. These designations have been developed using a variety of biological markers, including bulk transcriptomic and genetic analyses. However, within each of these 4 designations, clinical outcomes remain heterogeneous, suggesting that there are differences between tumors within a given subtype (2). Further
stratification of each subtype is necessary in order to better tailor treatments and predict clinical outcomes.
The SHH subtype of medulloblastoma is driven by the aberrant proliferation of cells via the SHH pathway. The SHH signaling pathway is essential in the development of the central nervous system (3). Canonically, the pathway is activated when the glycoprotein Shh binds the transmembrane protein Patched1 (Ptch1) (fig.1). Ptch1 binds the G-protein coupled receptor-like protein Smoothened (Smo), however, binding of Shh dissociates Ptch1 from Smo relieving inhibition. Smo then accumulates at the primary cilium and initiates the signaling cascade. The cascade results in the translocation of the Gli2 transcription factor protein into the nucleus. Gli2 upregulates the transcription of target genes including Ccnd1, Myc, and Gli1 resulting in a positive feedback loop and increased proliferation. In SHH medulloblastomas, tumor cells evade inhibition of the SHH pathway.
Cerebellar granule neuron progenitors (CGNPs) have been identified as the proximal cells of origin for medulloblastomas in genetically-engineered mice (4). However, mouse studies have shown that aberrant hyperactivation of the SHH pathway in both more primitive neural stem cells of the Gfap lineage as well as in more committed CGNPs of the Math1 lineage results in the development of SHH medulloblastomas (5,6). Pathological and bulk transcriptomic analyses show these tumors to be similar to each other, but mice with tumors initiated in neural stem cells have a shorter survival time (5,6). In humans, it has been reported that age of onset is a predictor of clinical outcomes, again suggesting a role for developmental timing of tumor
initiation in determining the malignancy of a tumor (2). These observations led us to hypothesize that the timing of tumor initiation plays a determining role in the cellular composition of
medulloblastomas resulting in differential responses to treatment.
Results
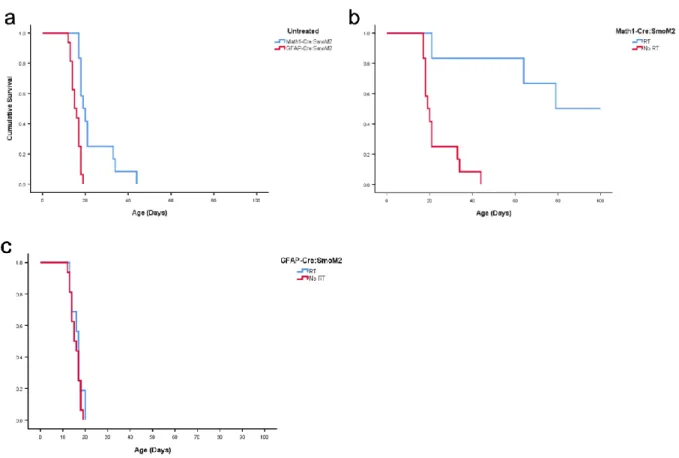
Differential survival rate and response to radiation therapy between medulloblastomas from progenitors or stem cells
To induce medulloblastoma formation, we bred SmoM2 mice, which contain a mutant Cre-dependent Smo gene that is constitutively expressed once activated (7), with Math1-Cre or hGfap-Cre mice that express Cre-recombinase in cells of the Math1 or Gfap lineage,
respectively. The mutant Smo gene is not native to mice and therefore is not inhibited by the mouse Smo inhibitor protein Ptch1, resulting in constitutive activation of the SHH pathway. As Math1 is expressed in CGNPs, the Math1-Cre/SmoM2 (M-Smo) mice develop medulloblastomas
3
Fig. 2 Survival analysis of M-Smo and G-Smo mice. a) Kaplan-Meyer curve of untreated M-Smo and G-Smo mice (p = 0.00003, log-rank test) b) Kaplan-Meyer curve of untreated M-Smo and radiation treated M-Smo mice (p =
0.001) c) Kaplan-Meyer curve of untreated G-Smo and radiation treated G-Smo mice (p=0.275). P-values determined using log-rank test.
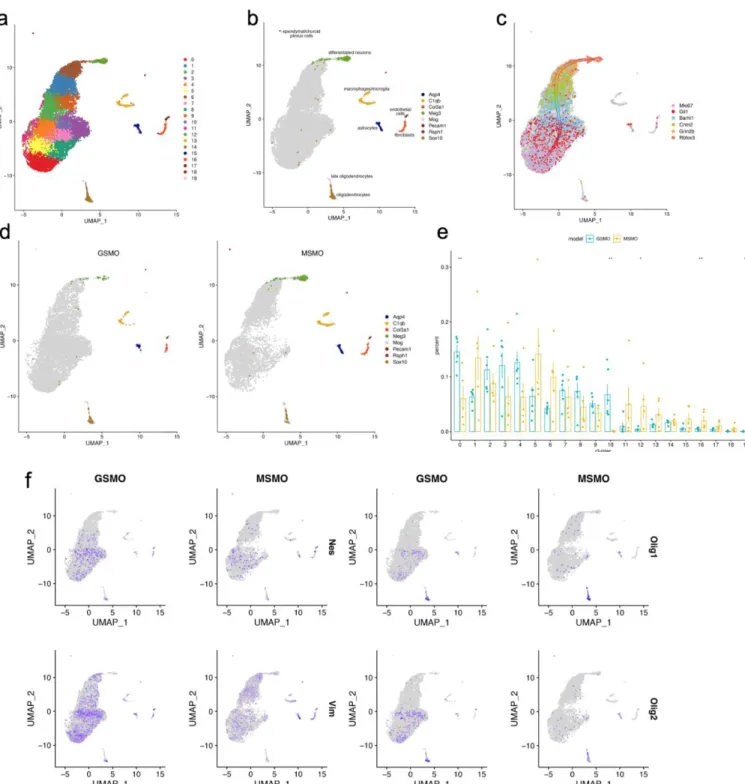
Medulloblastomas from progenitors or stem cells exhibit differential cellular compositions We used single-cell RNA sequencing to identify differences between M-Smo and G-Smo medulloblastomas. We collected tumors at P15 from 5 M-Smo mice and 6 G-Smo mice and used the Drop-seq protocol to generate single cell transcriptomic profiles, collecting ~2,600 cells from each tumor (10, 11). We subjected the 11,984 M-Smo cells and 16,489 G-Smo cells to selection criteria as described in the Methods section in order to avoid keeping cells with insufficient read depths, cells that unintentionally have transcriptomic information from more than one cell, and premature lysis. After this filtering step, 5,930 M-Smo and 8,699 G-Smo were included in the analysis. As suggested by previous studies (12), to reduce batch effects in the analysis caused by different sequencing depths we randomly downsampled the G-Smo data by 60% to equate the sequencing depth to that of the M-Smo data.
5
Fig. 3 Single-cell transcriptomic analysis of M-Smo and G-Smo tumors. a) UMAP projection of tumor cells from
M-Smo and G-Smo mice color coded by clusters. b) Feature plot of stromal and neuronal markers. c) Feature plot of markers of CGNP development with an arrow indicating the axis of differentiation. d) Feature plot of stromal and
neuronal markers separated by genotype. e) Fraction population of cells contributed by biological replicate to each
Of the 20 clusters, we identified 8 clusters that are representative of tumor stroma using marker genes previously described (11,13-14). These stroma include astrocytes,
oligodendrocytes, late oligodendrocytes, microglia/macrophages, fibroblasts, endothelial cells, neurons, and ciliated cells marked by expression of Aqp4, Sox10, Mog, C1qb, Col3a1, Pecam1, Meg3, and Rsph1, respectively (fig. 3b). The other clusters showed gene expression profiles
mirroring those of CGNP development as described in (11), noting sequential expression of Mki67, Gli1, Barhl1, Cntn2, Grin2b, and Rbfox3 representing the developmental axis from a
proliferative to a differentiated state (fig. 3c).
To better understand the differences between M-Smo and G-Smo tumor cells, we plotted M-Smo and G-Smo derived cells separately, noticing that M-Smo derived CGNP-like cells
differentially populate the differentiated end of the developmental axis while G-Smo derived cells differentially populate the proliferative end (fig. 3d). To quantify this difference, we
calculated the number of cells a biological replicate has assigned to a given cluster divided by the total number of cells of that replicate (fig. 3e). We found that cluster 0 on the proliferative end was significantly enriched for G-Smo cells (p = 0.0087, Wilcoxon rank-sum test) while cluster 12 at the differentiated end is significantly enriched for M-Smo cells (p = 0.017). Cluster 10 is almost exclusively made up of G-Smo cells (p = 0.0043). In addition, there is an increased number of fibroblasts (p = 0.0087) and late oligodendrocytes (p = 0.0043) in M-Smo tumors. Together, these results show that M-Smo and G-Smo tumors have different cellular compositions, with M-Smo tumors having more differentiating cells than G-Smo tumors.
7
phenotypes and an elevated capacity for protein synthesis while M-Smo tumors are enriched for differentiated neurons.
Stromal cell population differences between M-Smo and G-Smo tumors
a
c
e
g
b
d
9
Fig. 4 Single-cell transcriptomic analysis of of endothelial cells from M-Smo and G-Smo tumors combined with normal P7 cerebellum.
a) Feature plot of stromal and neuronal markers for M-Smo and G-Smo mice and normal P7 cerebellum. b) Fraction population of cells contributed by biological replicate to macrophage/microglia each cluster from
M-Smo and G-Smo mice and normal P7 cerebellum. * indicates p<.05 ** indicated p<.01 by Kruskal-Wallis Test. c) UMAP projection of endothelial color coded by cluster and d) by genotype. Feature plots of
e) general endothelial markers f) markers for cluster 0, and g) markers for cluster 1.
In the endothelial cell population, we identified 2 clusters (fig. 4b,c). Cluster 0 was common to both normal cerebellum and both tumor genotypes while cluster 1 was tumor-specific (fig. 4b,d). All endothelial cell clusters expressed marker genes Cldn5 and Pecam1 (fig. 4e). Cluster 0 showed upregulation of Mki67 and Apln, suggesting that these are proliferative, developing endothelial cells (22) (fig. 4f). In contrast, cluster 1 showed an upregulation of Abcb1a, Cxcl12, and Flt1, which have both been associated with medulloblastoma pathogenesis
and tumor neoangiogenesis, respectively(23-24) (fig. 4g). Thus, M-Smo and G-Smo tumors have a unique endothelial cell population that is associated with pro-tumoral properties. Collectively, these results show that M-Smo and G-Smo tumors have differential stromal population
a
c
e
g
b
d
f
11
Fig. 4 Single-cell transcriptomic analysis of of macrophage/microglia cells from M-Smo and G-Smo tumors combined with normal P7 cerebellum.
a) UMAP projection of macrophage/microglial cells color coded by cluster. b) general macrophage/microglia
marker. c) UMAP projection of macrophage/microglial cells color coded by genotype. d) Fraction population of
cells contributed by biological replicate to macrophage/microglia each cluster from M-Smo and G-Smo mice and normal P7 cerebellum. * indicates p<.05 ** indicated p<.01 by Kruskal-Wallis Test. Feature plots of markers for e)
cluster 0, f) cluster 1, g) cluster 2, and h) cluster 3.
In the macrophage/microglia population, we identified 4 clusters (fig. 5a). All macrophage/microglial clusters expressed the general marker C1qb (fig. 5b). Cluster 0 was common to both normal cerebellum and both tumor genotypes, cluster 1 was tumor-specific, and clusters 2 and 3 were common to M-Smo tumors and wildtype cerebellum (fig. 5c,d). Cluster 0 was upregulated for Cx3cr1 and Sparc, which is a gene expressed by mature microglia (18). Cluster 1 showed upregulation for Mrc1, Igf1, and Wfdc17 (fig. 5e), suggesting that the cells comprising this cluster represent a mature M2-like macrophage population, which are thought to be immunosuppressive and tumorigenic (19). Cluster 2 was marked by higher expression of Ccr2, Cd74, H2-Ea, and Il1b indicating these are proinflammatory M1-like macrophages (20).
Cluster 3 showed upregulation of Cd163 and Mrc1, suggesting these are also an M-2 like macrophage population (21). These results show that G-Smo and M-Smo tumors have a
macrophage population that is unique to tumors in comparison to wildtype cerebellum and that M-Smo tumors have a more diverse set of macrophages than G-Smo tumors.
Discussion
Our results suggest that timing of tumor initiation results in markedly different tumors with regards to their malignancy and response to therapy. This finding was reified by their differential cellular composition as shown by single-cell RNA sequencing. The G-Smo medulloblastoma tumors initiated earlier in development led to shorter survival time and increased resistance to radiation. These tumors have a larger fraction of stem-like cells and Olig2+ cells. Cancer stem cells are important drivers of tumor progression (25), and Olig2+ cells
upregulation of ribosomal protein genes and eukaryotic elongation factors, which has been implicated in promoting tumorigenesis in various cancers (15). In contrast, M-Smo
medulloblastoma tumors initiated later in development were enriched in fully differentiated neurons that are nonpropagating and are therefore not contributing to tumor growth.
In addition to differences in the main tumor population, we observed differential tumor-stromal interaction in the two tumor models as well as differences in tumor-stromal composition
between the tumors and normal P7 cerebellum. M-Smo tumors proved to have a larger fraction of late oligodendrocytes and fibroblasts and to have a more diverse set of macrophage populations that are also present in normal cerebellum. M-Smo tumors have a unique M1-like macrophage population. M1 macrophages have been shown to have antitumor effects (21), suggesting that the M-Smo-specific population could be implicated in its reduced malignancy. We found that both
tumors have a tumor-specific M2-like macrophage. As M2 macrophages are reported to have protumoral effects by suppressing the immune response (15), these macrophages may be an important population to target in the treatment of these tumors and further research should
investigate their role in tumor progression. We also found a population of endothelial cells that is enriched in tumors. This endothelial population is marked by genes associated with
medulloblastoma development and tumor growth (23). These tumor- and genotype-specific cell populations, along with the differentially enriched tumor cell populations, should be further studied with regards to their contribution to medulloblastoma growth and clinical outcomes so that targeted therapies can be developed against those populations implicated in increased tumor malignancy. Collectively, we have shown that the developmental timing of medulloblastoma initiation is an important predictor of tumor composition and clinical outcomes.
Methods
Mouse acquisition and Drop-seq protocol and data preprocessing of 5 M-Smo and 6 G-Smo tumors was conducted identically to the methods described in Ocasio et al. The code for the data analysis and visualization is available at:
13
References
1. Northcott, P.A., Robinson, G.W., Kratz, C.P. et al. Medulloblastoma. Nat Rev Dis Primers. 2019;5(11).
2. Cavalli FMG, Remke M, Rampasek L, Peacock J, Shih DJH, Luu B, et al. Intertumoral Heterogeneity within Medulloblastoma Subgroups. Cancer Cell. 2017;31(6):737-54 e6.
3. Carballo, G.B., Honorato, J.R., de Lopes, G.P. et al. A highlight on Sonic hedgehog pathway. Cell Commun Signal 2018;16(11).
4. Oliver TG, Read TA, Kessler JD, Mehmeti A, Wells JF, Huynh TTT, et al. Loss of patched and disruption of granule cell development in a pre-neoplastic stage of medulloblastoma. Development. 2005;132(10):2425-39.
5. Yang Z-J, Ellis T, Markant SL, Read T-A, Kessler JD, Bourboulas M, et al.
Medulloblastoma Can Be Initiated by Deletion of Patched in Lineage-Restricted Progenitors or Stem Cells. Cancer Cell. 2008;14(2):135-45.
6. Schüller U, Heine VM, Mao J, Kho AT, Dillon AK, Han Y-G, et al. Acquisition of Granule Neuron Precursor Identity Is a Critical Determinant of Progenitor Cell Competence to Form Shh-Induced Medulloblastoma. Cancer Cell. 2008;14(2):123-34.
7. Mao J, Ligon KL, Rakhlin EY, Thayer SP, Bronson RT, Rowitch D, et al. A Novel Somatic Mouse Model to Survey Tumorigenic Potential Applied to the Hedgehog Pathway. Cancer Research. 2006;66(20):10171-8.
8. Machold R, Fishell G. Math1 Is Expressed in Temporally Discrete Pools of Cerebellar Rhombic-Lip Neural Progenitors. Neuron. 2005;48(1):17-24.
9. Zhuo L, Theis M, Alvarez-Maya I, Brenner M, Willecke K, Messing A. hGFAP-cre transgenic mice for manipulation of glial and neuronal function in vivo. genesis. 2001;31(2):85-94.
10. Macosko, E. Z. et al. Highly parallel genome-wide expression profiling of individual cells using nanoliter droplets. Cell. 2015;161(5):1202–1214.
12. Luecken MD, Theis FJ. Current best practices in single-cell RNA-seq analysis: a tutorial. Mol Syst Biol. 2019;15(6):e8746.
13. Scolding NJ, Firth S, Linington C, et al. Myelin-oligodendrocyte glycoprotein (MOG) is a surface marker of oligodendrocyte maturation. J Neuroimmunol 1989;22(3):169-76.
14. Knowles M, Ostrowski L, Leigh M, et al. Mutations in RSPH1 Cause Primary Ciliary Dyskinesia with a Unique Clinical and Ciliary Phenotype. Am J Resp Crit Care.2014;189(6). 15. Ruggero, D., Pandolfi, P. Does the ribosome translate cancer?. Nat Rev Cancer 2003;3:179–192.
16. Wang W, Stock R, Gronostajki R, et al. A Role for Nuclear Factor I in the Intrinsic Control of Cerebellar Granule Neuron Gene Expression. J Bio Chem. 2004;279(51):53491-7. 17. Korsunsky I, Millard N, Fan J, Slowikowski K, Zhang F, Wei K, et al. Fast, sensitive and accurate integration of single-cell data with Harmony. Nat Methods. 2019;16(12):1289-96. 18. Vincent AJ, Lau PW, Roskams AJ. SPARC is expressed by macroglia and microglia in the developing and mature nervous system. Dev Dyn. 2008;237(5):1449-62.
19. Arlauckas S, Garren S, Garris C, Kohler R, Oh J, et al. Arg1 expression defines
immunosuppressive subsets of tumor-associated macrophages. Theranostics. 2018;8(21):5842– 54.
20. Avila M, Berasain C. Targeting CCL2/CCR2 in Tumor-Infiltrating Macrophages: A Tool Emerging Out of the Box Against Hepatocellular Carcinoma. Cell Mol Gast Hep. 2019;7(2):293-4.
21. Martinez F, Gordon S. The M1 and M2 paradigm of macrophage activation: time for reassessment. F1000Prime Rep. 2014;6(13).
22. Liu Q, Hu T, He L, Huang X, Tian X, et al. Genetic targeting of sprouting angiogenesis using Apln-CreER. Nat Comm. 2015;6(6020).
23. Ozawa PM, Ariza CB, Ishibashi CM, Fujita TC, et al. Role of CXCL12 and CXCR4 in normal cerebellar development and medulloblastoma. Int J Cancer. 2016;38(1):10-3.
24. Slongo M, Molena B, Brunati A, Frasson M, et al. Functional VEGF and VEGF receptors are expressed in human medulloblastomas. Neuro Oncol. 2007;9(4):384–92.
15