Genome-wide association study of red blood
cell traits in Hispanics/Latinos: The Hispanic
Community Health Study/Study of Latinos
Chani J. Hodonsky1☯, Deepti Jain2☯, Ursula M. Schick3,4,5☯, Jean V. Morrison2,
Lisa Brown2, Caitlin P. McHugh2,6, Claudia Schurmann3,4, Diane D. Chen7, Yong Mei Liu8, Paul L. Auer9, Cecilia A. Laurie2, Kent D. Taylor10,11, Brian L. Browning12, Yun Li13,14,15, George Papanicolaou16, Jerome I. Rotter10,11, Ryo Kurita17, Yukio Nakamura18,19, Sharon R. Browning2, Ruth J. F. Loos3,4,20, Kari E. North1,13, Cathy C. Laurie2, Timothy
A. Thornton2, Nathan Pankratz21, Daniel E. Bauer7,22,23, Tamar Sofer2☯, Alex P. Reiner5☯*
1 Department of Epidemiology, University of North Carolina Gillings School of Public Health, Chapel Hill, NC, United States of America, 2 Department of Biostatistics, University of Washington, Seattle, WA, United States of America, 3 The Charles Bronfman Institute for Personalized Medicine, Icahn School of Medicine at Mount Sinai, New York, New York, United States of America, 4 The Genetics of Obesity and Related Metabolic Traits Program, The Icahn School of Medicine at Mount Sinai, New York, New York, United States of America, 5 Division of Public Health Sciences, Fred Hutchinson Cancer Research Center, Seattle, WA, United States of America, 6 New York Genome Center, New York, NY, United States of America, 7 Division of Hematology/Oncology, Boston Children’s Hospital, Boston, MA, United States of America, 8 School of Medicine, Wake Forest University, Winston-Salem, NC, United States of America, 9 Joseph J. Zilber School of Public Health, University of Wisconsin Milwaukee, Milwaukee, WI, United States of America, 10 Institute for Translational Genomics and Population Sciences, Los Angeles Biomedical Research Institute at Harbor-UCLA Medical Center, Torrance, CA United States of America, 11 Department of Pediatrics, Los Angeles Biomedical Research Institute at Harbor-UCLA Medical Center, Torrance, CA United States of America, 12 Department of Medicine, University of Washington, Seattle, WA United States of America, 13 Department of Genetics, University of North Carolina, Chapel Hill, NC, United States of America, 14 Department of Biostatistics, University of North Carolina, Chapel Hill, NC, United States of America, 15 Department of Computer Science, University of North Carolina, Chapel Hill, NC, United States of America, 16 Division of Cardiovascular Sciences, National Heart, Lung, and Blood Institute, Bethesda, MD, United States of America, 17 Research and Development Department, Central Blood Institute, Blood Service Headquarters, Japanese Red Cross Society, Tokyo, Japan, 18 Cell Engineering Division, RIKEN BioResource Center, Tsukuba, Ibaraki, Japan, 19 Comprehensive Human Sciences, Tsukuba University, Tsukuba, Ibaraki, Japan, 20 The Mindich Child Health and Development Institute, Icahn School of Medicine at Mount Sinai, New York, New York, United States of America, 21 Division of Laboratory Medicine & Pathology, University of Minnesota, Minneapolis, MN, United States of America, 22 Department of Pediatric Oncology, Dana-Farber Cancer Institute, Boston, MA, United States of America, 23 Department of Pediatrics, Harvard Medical School and Harvard Stem Cell Institute, Harvard University, Boston, MA, United States of America
☯These authors contributed equally to this work. *[email protected]
Abstract
Prior GWAS have identified loci associated with red blood cell (RBC) traits in populations of European, African, and Asian ancestry. These studies have not included individuals with an Amerindian ancestral background, such as Hispanics/Latinos, nor evaluated the full spec-trum of genomic variation beyond single nucleotide variants. Using a custom genotyping array enriched for Amerindian ancestral content and 1000 Genomes imputation, we per-formed GWAS in 12,502 participants of Hispanic Community Health Study and Study of Latinos (HCHS/SOL) for hematocrit, hemoglobin, RBC count, RBC distribution width (RDW), and RBC indices. Approximately 60% of previously reported RBC trait loci a1111111111
a1111111111 a1111111111 a1111111111 a1111111111
OPEN ACCESS
Citation: Hodonsky CJ, Jain D, Schick UM,
Morrison JV, Brown L, McHugh CP, et al. (2017) Genome-wide association study of red blood cell traits in Hispanics/Latinos: The Hispanic Community Health Study/Study of Latinos. PLoS Genet 13(4): e1006760.https://doi.org/10.1371/ journal.pgen.1006760
Editor: Scott M. Williams, Case Western Reserve
University School of Medicine, UNITED STATES
Received: September 15, 2016 Accepted: April 12, 2017 Published: April 28, 2017
Copyright: This is an open access article, free of all
copyright, and may be freely reproduced, distributed, transmitted, modified, built upon, or otherwise used by anyone for any lawful purpose. The work is made available under theCreative Commons CC0public domain dedication.
Data Availability Statement: The HCHS/SOL
phenotype and genotype data are publically deposited and available through dbGaP (phs000810 and phs000880, respectively).
Funding: The baseline examination of HCHS/SOL
generalized to HCHS/SOL Hispanics/Latinos, including African ancestral alpha- and beta-globin gene variants. In addition to the known 3.8kb alpha-beta-globin copy number variant, we identified an Amerindian ancestral association in an alpha-globin regulatory region on chro-mosome 16p13.3 for mean corpuscular volume and mean corpuscular hemoglobin. We also discovered and replicated three genome-wide significant variants in previously unre-ported loci for RDW (SLC12A2 rs17764730, PSMB5 rs941718), and hematocrit (PROX1 rs3754140). Among the proxy variants at the SLC12A2 locus we identified rs3812049, located in a bi-directional promoter between SLC12A2 (which encodes a red cell membrane ion-transport protein) and an upstream anti-sense long-noncoding RNA, LINC01184, as the likely causal variant. We further demonstrate that disruption of the regulatory element har-boring rs3812049 affects transcription of SLC12A2 and LINC01184 in human erythroid pro-genitor cells. Together, these results reinforce the importance of genetic study of diverse ancestral populations, in particular Hispanics/Latinos.
Author summary
Red blood cells (RBC) are important for transport of oxygen to tissues throughout the body. Distribution of RBC traits differs by ethnicity and gender, and both genetic and acquired factors likely contribute to these differences. Prior genetic studies have identified physical regions of the genome associated with RBC traits in populations with European, African, and Asian ancestry. These studies have not included individuals with ancestry from the American continents (Amerindian ancestry), such as Hispanics/Latinos. In an analysis of RBC traits in up to 19,608 Hispanics/Latinos, we identified an Amerindian-ancestry genetic association in a known alpha-globin regulatory region. We also identified three new RBC trait associations, including a regulatory variant ofSLC12A2that encodes a RBC membrane ion-transport protein. Experimental disruption of this regulatory ele-ment led to reduced expression of bothSLC12A2and an adjacent long non-coding RNA in human erythroid progenitor cells. These results contribute to understanding the physi-ology of red blood cells and reinforce the importance of genetic study of diverse ancestry populations, in particular Hispanics/Latinos.
Introduction
Red blood cell (RBC) development and maintenance are critical for transport of oxygen to tissues throughout the body. Several parameters commonly measured in clinical blood count evaluations are used to characterize RBC: hematocrit (HCT), hemoglobin (HGB), RBC count, mean corpuscular hemoglobin (MCH), mean corpuscular hemoglobin concentration (MCHC), mean corpuscular volume (MCV), and red cell distribution width (RDW) (detailed trait description provided inS1 Table). RBC traits differ by self-reported ancestry, and both genetic (e.g., inherited hemoglobin variants) and acquired (e.g., iron deficiency, kidney dis-ease) factors contribute to these ethnic differences[1,2]. Quantitative RBC parameters are also polygenic traits that exhibit moderate to high heritability (trait-specific h2between 40% and 90%)[3–5]. Over 80 genomic regions have been associated with one or more RBC traits through genome-wide association studies (GWAS), performed primarily in European- and, to a lesser extent, Asian- and African-descent populations[6–14].
Medicine (N01-HC65235), Northwestern University (N01-HC65236), and San Diego State University (N01-HC65237). The Genetic Analysis Center at Washington University was supported by NHLBI and NIDCR contracts (HHSN268201300005C AM03 and MOD03). Additional analysis support was provided by 1R01DK101855-01 and 13GRNT16490017. Genotyping efforts were supported by NHLBI HSN 26220/20054C, NCATS CTSI grant UL1TR000123, and NIDDK Diabetes Research Center (DRC) grant DK063491. This research was supported in part by the SOL (Study of Latinos) Grant—a sub-award issued under the Prime Contract No. HHSB268201200054C between HHS, NIH, National Heart, Lung and Blood Institute and Illumina, Inc. The provision of genotyping data was supported in part by the National Center for Advancing Translational Sciences, CTSI grant UL1TR000124, and the National Institute of Diabetes and Digestive and Kidney Disease Diabetes Research Center (DRC) grant DK063491 to the Southern California Diabetes Endocrinology Research Center. SRB was supported by R01-GM110068. The Mount Sinai BioMe Biobank Program is supported by The Andrea and Charles Bronfman Philanthropies. Analyses of BioMe data was supported in part through the computational resources and staff expertise provided by Scientific Computing at the Icahn School of Medicine at Mount Sinai. DEB is supported by NIDDK (K08DK093705) and the Doris Duke Charitable Foundation, Charles H. Hood Foundation, American Society of Hematology, Burroughs Wellcome Fund, and Cooley’s Anemia Foundation. The funders had no role in study design, data collection and analysis, decision to publish, or preparation of the manuscript.
Competing interests: The authors have declared
Hispanics/Latinos are ethnically heterogeneous, with admixture of European, West African, and Amerindian ancestral populations. In general, RBC trait values among Hispanics/Latinos have been reported to be similar to those among non-Hispanic whites, though certain types of congenital and acquired anemias are more common among Hispanics/Latinos[15–19]. As with most complex traits, GWAS for discovery or generalization of RBC trait loci has yet to be performed in Hispanics/Latinos or other populations with Amerindian ancestry. In the cur-rent study, we performed genome-wide association analysis of seven quantitative RBC traits in 12,502 participants ascertained by the Hispanic Community Health Study/Study of Latinos (HCHS/SOL) and replicated any new association findings discovered in HCHS/SOL in three independent samples of Hispanic/Latino Americans.
Results
The demographic characteristics and RBC trait distributions of the 12,502 Hispanic/Latino HCHS/SOL participants are summarized inS2 Table. Genomic inflation factors for the seven RBC traits ranged from 1.015 (MCHC) to 1.054 (RDW), indicating adequate control of popu-lation stratification (S1 Table). Overall, 24 loci were significantly associated with one or more RBC traits in HCHS/SOL (Table 1andS1andS2Figs). The number of distinct genomic
regions associated with each trait were 4 loci for HCT, 4 for HGB, 6 for RBC count, 8 for RDW, 9 for MCH, 5 for MCHC, and 9 for MCV. Association results and allele frequencies of lead SNPs for each genome-wide-significant trait-locus association are presented for six genetic subgroups comprising the HCHS/SOL study population inS3 Table.
Genomic loci previously known to be associated with RBC traits and
generalization to Hispanics/Latinos
Of the 24 genomic regions harboring variants that reach genome-wide significance for associa-tion with RBC traits in HCHS/SOL, 17 have been previously found to associate with RBC traits either through GWAS and/or Mendelian RBC disorders. Genomic regions and variants previ-ously implicated in Mendelian RBC disorders include the African ancestral alleles for sickle cell trait/anemia or hemoglobin S (HBBrs334); hemoglobin C (HBBrs33930165); the common African form of G6PD A- deficiency (rs1050828); the 3.8kb alpha-globin gene deletion respon-sible for alpha-thalassemia trait (esv2676630); and a proxy SNP (rs2032451) for the European hereditary hemochromatosis (HFE) p.H63D allele.
Table 1. Genetic variants significantly associated with red blood cell traits in HCHS/SOL Hispanics/Latinos.
Trait Status Annotated Gene(s) (annotation)
rsID/CNV chr: position CA oevar CAF Beta (SE) p-value 1000 Genomes Allele Frequencies
AFR AMR EAS SAS EUR
HCT Novel PROX1 (intronic) rs3754140 chr1: 214003037
T 1.03 0.61 -0.24 (0.05) 5.7x10⁻⁸ 0.71 0.55 0.69 0.83 0.73
Known PRKCE (intronic) rs17034641 chr2: 46372644 G 1.00 0.86 0.36 (0.06) 2.6x10⁻⁹ 0.79 0.87 0.94 0.79 0.85
Known HBB (missense) rs334 chr11: 5248232 T 0.86 0.99 1.32 (0.20) 1.3x10⁻¹⁰ 0.90 >0.99 1.00 1.00 1.00 Known TMPRSS6 (missense) rs855791 chr22:
37462936
A 1.03 0.44 -0.38 (0.04) 1.1x10⁻¹⁰ 0.10 0.51 0.57 0.54 0.39
HGB Known PRKCE (intronic) rs17034641 chr2: 46372644 G 1.00 0.86 0.12 (0.02) 3.2x10⁻⁸ 0.79 0.87 0.94 0.79 0.85
Known HFE (intronic) rs2032451 chr6: 26092170 G 1.01 0.88 -0.12 (0.02) 3.1x10⁻⁸ 0.99 0.88 0.97 0.93 0.83
Known HBA1 / HBA2 (intergenic) 3.8kb deld chr16: 223447 3.8kb
del
NA 0.04 -0.46 (0.04) 1x10-32 0.16 0.02 0.02 0.02 0.004
Known TMPRSS6 (missense) rs855791 chr22: 37462936
A 1.03 0.44 -0.15 (0.02) 6.0 x10⁻²³ 0.10 0.51 0.57 0.54 0.39
RBC Count
Known KIT (intergenic) rs218265 chr4: 55408999 T 1.07 0.67 0.033
(0.01)
3.6x10⁻¹⁰ 0.75 0.66 0.65 0.73 0.85
Known HBS1L/MYB (intergenic) rs34164109 chr6: 135100038
C 1.00 0.84 0.054
(0.01)
3.6x10⁻¹⁷ 0.86 0.84 0.76 0.89 0.74
Known TFR2 (intronic) rs2075672 chr7:
100642673
A 1.03 0.30 0.028
(0.01)
1.4x10⁻⁸ 0.34 0.29 0.23 0.33 0.38
Known HBA1 / HBA2 (intergenic) 3.8kb deld chr16: 223447 3.8kb
del
NA 0.04 0.29 (0.01) 4.4x10-136 0.16 0.02 0.02 0.02 0.004
Novel RBFOX3 (intronic) rs76539504 chr17: 79139365
T 1.02 0.96 0.066 (0.01)
1.4x10⁻⁸ 0.81 0.96 1.00 0.99 0.97
Knowne G6PD (missense) rs1050828 chrX:
153764217
C 1.04 0.98 0.13 (0.01) 1.80x10⁻¹⁸ 0.87 0.99 1.00 1.00 1.00
RDW Novel N/A (intergenic) rs6685034 chr1: 193954300
C 1.02 0.03 -0.02 (0.003)
4.8x10⁻⁸ 0.15 0.01 0.00 0.00 0.00
Knowna SLC12A7 (intronic) rs4565255 chr5: 1109568 T 0.98 0.60 0.007
(0.001)
3.1x10⁻¹⁰ 0.71 0.63 0.69 0.57 0.42
Novel SLC12A2 (promoter) rs17764730 chr5: 127357526
T 1.02 0.16 -0.011 (0.001)
8.8x10⁻¹³ 0.02 0.16 0.35 0.37 0.21
Novel PSMB5 (intronic) rs7147308 chr14: 23497629
C 1.10 0.70 -0.007 (0.001)
5.8x10⁻⁹ 0.13 0.79 0.94 0.60 0.70
Novel MCTP2 (intergenic) rs111473449 chr15: 95330055
G 0.99 0.97 -0.018 (0.003)
3.2x10⁻⁸ 0.84 0.97 1.00 1.00 >0.99
Known HBA1 / HBA2 (intergenic) 3.8kb deld chr16: 223447 3.8kb
del
NA 0.04 0.05 (0.00) 2.4x10-70 0.16 0.02 0.02 0.02 0.004
Knowna TMPRSS6 (missense) rs855791 chr22:
37462936
A 1.03 0.44 0.007
(0.001)
2.7x10⁻¹¹ 0.10 0.51 0.57 0.54 0.39
Knowne G6PD (missense) rs1050828 chrX:
153764217
C 1.04 0.98 0.04
(0.003)
1.50x10⁻²⁹ 0.87 0.99 1.00 1.00 1.00
MCH Known TFRC (intergenic) rs12634180c chr3:
195825756
G 0.81 0.82 -0.22 (0.04) 2.0x10⁻⁸ 0.91 0.79 NA NA 0.81
Known KIT (intergenic) rs218265 chr4: 55408999 T 1.07 0.67 -0.21 (0.03) 3.3x10⁻¹² 0.75 0.66 0.65 0.73 0.85
Known HFE (intronic) rs2032451 chr6: 26092170 G 1.01 0.88 -0.29 (0.04) 3.5x10⁻¹² 0.99 0.88 0.97 0.93 0.83 Known CCND3 (intronic) rs9367125 chr6:41987544 G 0.99 0.92 0.29 (0.05) 1.3x10⁻⁸ 0.96 0.94 0.74 0.86 0.88
Known HBS1L / MYB (intergenic) rs9389268 chr6: 135419631
A 1.00 0.83 -0.22 (0.04) 7.9x10⁻¹⁰ 0.78 0.84 0.76 0.89 0.74
Known CITED2 (intergenic) rs607203 chr6: 139841653
T 1.02 0.07 0.33 (0.06) 1.7x10⁻⁹ 0.24 0.05 0.00 0.02 0.04
Known HBA1 / HBA2 (intergenic) 3.8kb deld chr16: 223447 3.8kb
del
NA 0.04 -2.60 (0.06) <2.5x10 -231
0.16 0.02 0.02 0.02 0.004
Known TMPRSS6 (missense) rs855791 chr22: 37462936
A 1.03 0.44 -0.34 (0.03) 1.0x10⁻³⁴ 0.10 0.51 0.57 0.54 0.39
Knowne CTAG2 / GAB3 (intergenic) rs146474788 chrX:
153893403
G 1.04 0.98 -0.56 (0.08) 1.50x10⁻²⁹ 0.85 0.99
>0.99 1.00 1.00
Europeans (rs9349204, rs9349205) or Japanese (rs3218097) populations. Additionally, we report novel associations for two of the variants significantly associated with RDW in HCHS/SOL:SLC12A7rs4565255 andTMPRSS6rs855791.SLC12A7rs4565255 is a proxy for rs4580814, which was previously associated with MCHC in Japanese populations[9].
TMPRSS6rs855791 has been previously associated with multiple red cell and iron-related phe-notypes, but not with RDW[6,8,9].
To formally assess whether variants previously associated with RBC traits in populations of European, Asian, and African ancestry generalized to HCHS/SOL Hispanics/Latinos, we used a directional FDR approach. Of 251 unique published SNP associations with any of the seven RBC traits, 146 (58%) generalized to HCHS/SOL (S4 Table). The proportion of loci general-ized varied by RBC trait: 5 of 13 HCT variants generalgeneral-ized (38% of SNPs, 42% of loci); 17 of 42 HGB variants generalized (40% of SNPs, 37% of loci); 24 of 33 RBC variants generalized (73% of SNPs, 61% of loci); 38 of 61 MCH variants generalized (62% of SNPs, 61% of loci); 12 of 25
Table 1. (Continued)
Trait Status Annotated Gene(s) (annotation)
rsID/CNV chr: position CA oevar CAF Beta (SE) p-value 1000 Genomes Allele Frequencies
AFR AMR EAS SAS EUR
MCHC Known SMIM19 (intergenic) rs1349471 chr8: 42598868 C 1.05 0.44 -0.11 (0.02) 3.0x10⁻¹¹ 0.17 0.48 0.43 0.35 0.41
Known HBB (missense) rs334 chr11: 5248232 T 0.86 0.99 0.67 (0.08) 3.6x10⁻¹⁶ 0.90
>0.99 1.00 1.00 1.00
Knownb HBB (missense) rs33930165b chr11: 5248233 C 0.85 0.997 -1.86 (0.18) 6.8 x10⁻²⁴ 0.99 1.00 1.00 1.00 1.00
Known HBA1 / HBA2 (intergenic) 3.8kb deld chr16: 223447 3.8kb
del
NA 0.04 -0.82 (0.04) 6.7x10-81 0.16 0.02 0.02 0.02 0.004
Known PIEZO1 (enhancer) rs551118 chr16:
88789676
C 0.96 0.48 0.14 (0.02) 3.9x10⁻¹⁴ 0.26 0.50 0.38 0.40 0.41
Known KCTD17 (enhancer) rs9610638 chr22: 37049628
T 1.00 0.43 -0.14 (0.02) 7.0x10⁻¹⁷ 0.06 0.49 0.58 0.56 0.39
MCV Known KIT (intergenic) rs218265 chr4: 55408999 T 1.07 0.67 -0.58 (0.08) 8.9x10⁻¹³ 0.75 0.66 0.65 0.73 0.85
Known CCND3 (intronic) rs4714548 chr6: 41983431 A 1.02 0.18 -0.58 (0.10) 1.4x10⁻⁹ 0.36 0.16 0.35 0.24 0.13
Known HBS1L / MYB (intergenic) rs9389268 chr6: 135419631
A 1.00 0.83 -0.58 (0.10) 3.0x10⁻⁹ 0.78 0.84 0.76 0.89 0.74
Known CITED2 (intergenic) rs607203 chr6: 139841653
T 1.02 0.07 0.94 (0.15) 1.9x10⁻¹⁰ 0.24 0.05 0.00 0.02 0.04
Novel IDO2 (intergenic) rs141848064 chr8: 39876650 G 1.03 0.98 -1.41 (0.25) 1.1x10⁻⁸ 0.84 0.98 1.00 1.00 1.00
Known HBB (missense) rs334 chr11: 5248232 T 0.86 0.99 3.46 (0.36) 1.1x10⁻²² 0.90
>0.99 1.00 1.00 1.00
Known HBA1 / HBA2 (intergenic) 3.8kb deld chr16: 223447 3.8kb
del
NA 0.04 -5.81 (0.18) 2.5x10-231 0.16 0.02 0.02 0.02 0.004
Known HBA1 / HBA2 (intergenic) 3.8kb dupd chr16: 223447 3.8kb
dup
NA 0.02 -1.42 (0.25) 1.4x10-08 NA NA NA NA NA
Known TMPRSS6 (missense) rs855791 chr22: 37462936
A 1.03 0.44 -0.64 (0.07) 1.6x10⁻¹⁷ 0.10 0.51 0.57 0.54 0.39
Knowne G6PD (missense) rs1050828 chrX:
153764217
C 1.04 0.98 -1.92 (0.22) 1.30x10⁻¹⁷ 0.87 0.99 1.00 1.00 1.00
Bolding denotes novel associations.
aindicates previous association with other RBC traits, but not with RDW.
bpreviously reported low-frequency allele (MAF<0.01) observed as significant in this study. cAllele frequencies provided from HaploReg v4.1 as frequencies not reported in 1000 Genomes. dThe re-typed structural variant calls determined using Genvisis software.
eAnalysis on the X chromosome included X chromosome-based eigenvectors and relatedness matrix (sex-stratified results presented inS10 Table).
1000 Genomes superpopulations: AFR = African, AMR = American continents, EUR = European, EAS = East Asian, and SAS = South Asian. CA, coded allele; CAF, coded allele frequency; CNV, copy number variant; SE, standard error; HCT, hematocrit; HGB, hemoglobin; MCH, mean corpuscular hemoglobin; MCHC, mean corpuscular hemoglobin concentration; MCV, mean corpuscular volume; RBC, red blood cell count; RDW, red cell distribution width."oevar" is the imputation quality defined as the ratio of the observed variance of imputed dosage to the expected binomial variance.
MCHC variants generalized (48% of SNPs, 33% of loci); 49 of 76 MCV variants generalized (64% of SNPs, 58% of loci); and the only variant previously associated with RDW generalized.
Discovery and replication of new loci associated with RBC traits
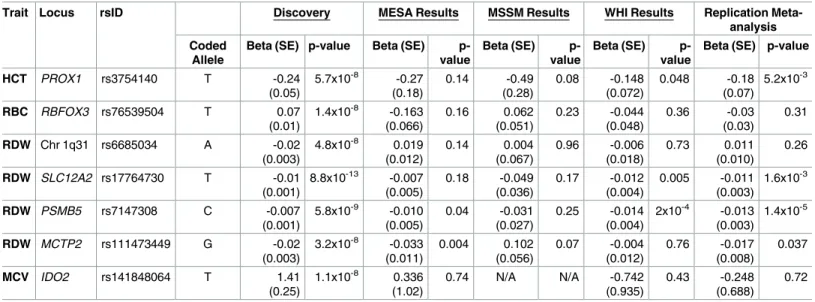
The seven remaining genome-wide significant variants in the HCHS/SOL discovery sample were at previously undetected loci (Table 1), and three of these variants replicated in a meta-analysis of three independent Hispanic/Latino samples (Table 2,S2 Table). The replicated loci are (1) chromosome 1q32.3PROX1rs3754140 (MAF = 0.39, replication p = 5.2x10⁻³) associated with HCT; (2) chromosome 5q23.3SLC12A2rs17764730 (MAF = 0.18, replication p = 1.6x10⁻³) associated with RDW; and (3) chromosome 14q11.2PSMB5rs7147308 (MAF = 0.30, replica-tion p = 1.4x10⁻⁵) associated with RDW. The four loci that did not meet the Bonferroni-cor-rected replication threshold (P<0.0071) are (1)RBFOX3rs76539504 associated with RBC count (MAF = 0.04, replication p = 0.31); (2)MCTP2rs111473449 (MAF = 0.03, replication p = 0.037); (3) an intergenic variant on chromosome 1q31 (rs6685034, MAF = 0.41, replication p = 0.26) associated with RDW; and (4)IDO2rs141848064 (MAF = 0.02, replication p = 0.72) associated with MCV.
Functional analysis of new loci associated with RBC traits
At each of the three replicated discovery RBC-associated loci, we evaluated the functional geno-mic annotation and regulatory potential of the lead variant and any proxy variants (r20.8 in HCHS/SOL) in erythroid cells to determine the most likely causal variant(s). We identified the following variants as the most likely functional candidates: three intronic SNPs ofPROX1
(rs7541039, rs7517701, and rs4282786) located within the same erythroid enhancer; one SNP 3’ ofPSMB5(rs11846575); and rs3812049, which is located in a bi-directional promoter between
SLC12A2and an anti-sense long noncoding RNA,LINC01184(S5andS6Tables).
We next performed mutagenesis analysis of the regions containing thePROX1,PSMB5, andSLC12A2candidate causal variants using CRISPR-Cas9 genome editing to disrupt the
Table 2. Replication of HCHS/SOL GWAS discovery loci in Hispanic/Latino populations.
Trait Locus rsID Discovery MESA Results MSSM Results WHI Results Replication Meta-analysis Coded
Allele
Beta (SE) p-value Beta (SE) p-value
Beta (SE) p-value
Beta (SE) p-value
Beta (SE) p-value
HCT PROX1 rs3754140 T -0.24 (0.05)
5.7x10⁻⁸ -0.27
(0.18) 0.14 -0.49 (0.28) 0.08 -0.148 (0.072) 0.048 -0.18 (0.07) 5.2x10⁻³
RBC RBFOX3 rs76539504 T 0.07 (0.01)
1.4x10⁻⁸ -0.163 (0.066) 0.16 0.062 (0.051) 0.23 -0.044 (0.048) 0.36 -0.03 (0.03) 0.31
RDW Chr 1q31 rs6685034 A -0.02
(0.003)
4.8x10⁻⁸ 0.019 (0.012) 0.14 0.004 (0.067) 0.96 -0.006 (0.018) 0.73 0.011 (0.010) 0.26
RDW SLC12A2 rs17764730 T -0.01
(0.001)
8.8x10⁻¹³ -0.007 (0.005) 0.18 -0.049 (0.036) 0.17 -0.012 (0.004) 0.005 -0.011 (0.003) 1.6x10⁻³
RDW PSMB5 rs7147308 C -0.007
(0.001)
5.8x10⁻⁹ -0.010 (0.005)
0.04 -0.031 (0.027)
0.25 -0.014 (0.004)
2x10⁻⁴ -0.013 (0.003)
1.4x10⁻⁵
RDW MCTP2 rs111473449 G -0.02
(0.003)
3.2x10⁻⁸ -0.033 (0.011) 0.004 0.102 (0.056) 0.07 -0.004 (0.012) 0.76 -0.017 (0.008) 0.037
MCV IDO2 rs141848064 T 1.41
(0.25)
1.1x10⁻⁸ 0.336 (1.02)
0.74 N/A N/A -0.742
(0.935)
0.43 -0.248 (0.688)
0.72
MESA: Multiethnic Study of Atherosclerosis, n = 781 to 784; MSSM: Icahn Mt. Sinai School of Medicine, n = 2,621 to 2,785; WHI: Women’s Health Initiative, n = 1,205 or 3,537 (rs3754140 only). N/A: not applicable.
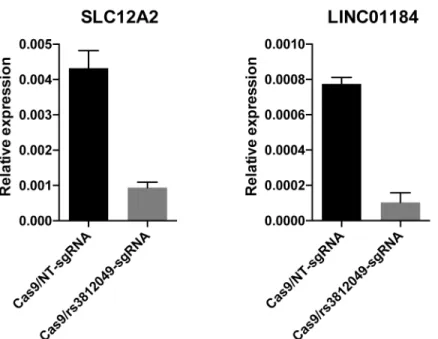
respective putative regulatory elements in human umbilical cord-derived erythroid progenitor (HUDEP-2) cells (oligonucleotide sequences described inS7 Table). At theSLC12A2locus, a single guide RNA was expressed along with Cas9 to produce indels surrounding the predicted functional SNP rs3812049. These edits resulted in a substantial decrease in expression of both
SLC12A2andLINC01184(Fig 1). Differentiation of erythroid cells was not obviously affected by disruption of the bi-directional promoter site. In a separate mutagenesis experiment, dele-tion of the third exon ofLINC01184resulted in a 3-fold reduction inLINC01184expression, but did not appear to exhibit substantialciseffects onSLC12A2expression (S3 Fig). While the candidate regulatory region ofPROX1is located within an erythroid enhancer,PROX1itself is not expressed in human erythroid cells including HUDEP-2, suggesting that the enhancer ele-ment might regulate a distal target. However, a 700 base-pair biallelic deletion of thePROX1
intronic region containing rs7541039, rs7517701, and rs4282786 did not show any effect on HUDEP-2 cell maturation or on expression of neighboring genesSMYD2andCENPF, both located within 300 kb of the putative enhancer element (S4 Fig). Similarly, deletion of the putative enhancer downstream ofPSMB5did not significantly alter expression ofPSMB5or neighboring genes (PRMT5,HAUS4,C14ORF93, andACIN1) that are both expressed in ery-throid precursors and located within the same topologically associated domain of K562 cells (S4 Fig).
Additional analysis of the alpha-globin copy number variant
Since the quality of structural variants imputed from 1000 Genomes may be lower than single nucleotide variants, we applied a specialized copy number variant (CNV) calling algorithm to re-type the key 3.8kb alpha-globin structural variant using raw probe intensity data from the
Fig 1. Small indels around rs3812049 reduce expression of both SLC12A2 and LINC01184 in HUDEP-2 cells. HUDEP-2 human erythroid precursor cells were transduced with lentivirus expressing Cas9 and a guide RNA, either nontargeting (NT) or targeting cleavage at rs3812049, and selected with antibiotics. Seven days after transduction, expression of SLC12A2 and LINC01184 in the population of edited cells was measured by quantitative reverse transcription PCR. Experiment was performed in biologic triplicate. Bars indicate means and error bars indicate standard deviation. T-tests showed significant differences in expression of both SLC12A and LINC01184 upon introduction of indels around rs3812049 (p<0.01 for each comparison to unedited controls).
custom 2.5M Illumina genotyping array used in HCHS/SOL, as described under Methods. Comparison of the CNV genotype calls to those for esv2676630 imputed from 1000 Genomes revealed that genotype calling using imputation appears to result in “under-calling” of the 3.8kb deletion, especially homozygous deletions (S8 Table). In addition, there are a number of individuals in HCHS/SOL who carry a 3.8kb duplication (3 or 4 copies of the structural vari-ant), which are mis-called by 1000 Genomes imputation as wild-type. Notably, the improve-ment in genotype accuracy with the CNV calling algorithm resulted in a nearly two-fold increase in effect size for MCH and MCV (Table 3) compared to 1000 Genomes imputation (S9 Table). Therefore conditional association analyses were performed using alpha-globin deletion/duplication genotypes derived from the CNV calling algorithm.
Conditional analysis and identification of secondary, independent
association signals
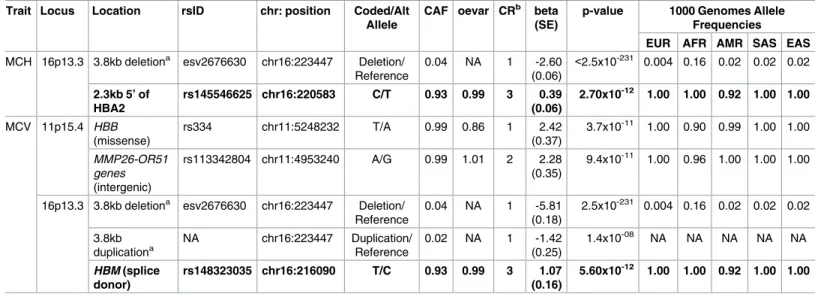
To identify additional independent association signals at known or novel RBC-associated loci, we performed step-wise conditional regression analyses in which we adjusted for the index vari-ant at each genome-wide significvari-ant locus. The analysis was repeated with adjustment for each independently associated single variant or structural variant until no further independent sig-nals were identified within that genomic region. Using a significance threshold ofα= 5x10⁻⁸, we identified additional independent variants associated with one or more RBC traits (Table 3) in two genomic regions. At the beta-globin locus on chromosome 11p15 containing the index SNP rs334 (sickle cell variant), there was an additional intergenic variant (rs113342804) inde-pendently associated with MCV. At the terminal region of chromosome 16p13 containing the alpha-globin locus, we identified two additional low-frequency variants—HBM-HBA2
rs145546625 (or its proxyHBMrs148323035 for MCH and MCV) and the 3.8kb alpha-globin duplication (for MCV)—independently of the 3.8kb alpha-globin deletion.
Table 3. Independent signals at GWAS loci identified by conditional analysis of HCHS/SOL participants.
Trait Locus Location rsID chr: position Coded/Alt Allele
CAF oevar CRb beta (SE)
p-value 1000 Genomes Allele Frequencies EUR AFR AMR SAS EAS MCH 16p13.3 3.8kb deletiona esv2676630 chr16:223447 Deletion/
Reference
0.04 NA 1 -2.60 (0.06)
<2.5x10-231 0.004 0.16 0.02 0.02 0.02
2.3kb 5’ of HBA2
rs145546625 chr16:220583 C/T 0.93 0.99 3 0.39 (0.06)
2.70x10⁻¹² 1.00 1.00 0.92 1.00 1.00
MCV 11p15.4 HBB (missense)
rs334 chr11:5248232 T/A 0.99 0.86 1 2.42
(0.37)
3.7x10⁻¹¹ 1.00 0.90 0.99 1.00 1.00
MMP26-OR51 genes (intergenic)
rs113342804 chr11:4953240 A/G 0.99 1.01 2 2.28 (0.35)
9.4x10⁻¹¹ 1.00 0.96 1.00 1.00 1.00
16p13.3 3.8kb deletiona esv2676630 chr16:223447 Deletion/
Reference
0.04 NA 1 -5.81 (0.18)
2.5x10-231 0.004 0.16 0.02 0.02 0.02
3.8kb duplicationa
NA chr16:223447 Duplication/ Reference
0.02 NA 1 -1.42 (0.25)
1.4x10-08 NA NA NA NA NA
HBM (splice donor)
rs148323035 chr16:216090 T/C 0.93 0.99 3 1.07 (0.16)
5.60x10⁻¹² 1.00 1.00 0.92 1.00 1.00
Rows in bold indicate variants that are Amerindian specific. 1000 Genomes super-populations European (EUR), African (AFR), American (AMR), South Asian (SAS) and East Asian (EAS), were examined to determine global allele frequencies. "oevar" is the imputation quality defined as the ratio of the observed variance of imputed dosage to the expected binomial variance.
a
The re-typed structural variant calls determined using Genvisis software.
b
CR: during sequential conditional analysis, the round number in which the variant was conditioned for.
Admixture mapping analysis
Several variants associated with RBC traits in the HCHS/SOL population are highly differenti-ated across ancestral populations. TheHBBrs334,HBBrs33930165, esv2676630 alpha-globin 3.8kb gene deletion, andG6PDrs1050828 lead variants are derived from an African ancestral background, while theHFEhemochromatosis variant rs2032451 (proxy of rs1799945 p.H63D) is common among Europeans and Amerindian populations and much less common among Asians and West Africans. In addition, we note that the two newly reported independent asso-ciation signals at the chromosome 16 alpha-globin locus—rs148323035/rs145546625 (Table 3) and the 3.8kb duplication—appear to be more common among populations of Amerindian ancestry[20,21]. To assess whether any additional genomic regions might contain ancestrally differentiated SNPs associated with RBC traits, we performed a genome-wide admixture-map-ping scan in HCHS/SOL for discovery analysis in each RBC trait. Admixture mapadmixture-map-ping in HCHS/SOL only detected associations already reported in the initial association testing: the chromosome 11p15 beta-globin region (for MCV); the chromosome 16p13 alpha-globin region (for RBC, HGB, MCV, MCH, MCHC, and RDW); and the RDW association on chro-mosome 14q11, which corresponds to thePSMB5association signal discovered in the HCHS/ SOL GWAS (S5 Fig). ThePSMB5index SNP shows large inter-continental allele frequency differences (rs7147308 T allele frequency is 0.87 in AFR, 0.40 in SAS, 0.30 in EUR, 0.21 in AMR, and 0.06 in EAS 1000 Genomes populations).
Discussion
We performed a GWAS of seven red blood cell traits in a diverse subsample of approximately 12,500 Hispanic/Latino participants of HCHS/SOL from across the continental U.S. We dis-covered and replicated three genome-wide significant variants (SLC12A2rs17764730 and
PSMB5rs941718 for RDW, andPROX1rs3754140 for HCT). We also showed that common African ancestral hemoglobin variants (beta-globin Hb S and Hb C missense variants rs334 and rs33930165, and alpha-globin 3.8kb thalassemia structural variant) and the African G6PD A- variant are associated with variation in RBC traits among the U.S. Hispanic/Latino popula-tion. Overall, 58% of previously identified GWAS loci for RBC traits generalized to HCHS/ SOL. We additionally provide a more detailed characterization of allelic heterogeneity at the alpha- and beta-globin loci, including a newly identified Amerindian ancestral variant that overlaps a known regulatory region of the alpha-globin gene cluster.
The HCT index SNP rs3754140 is located within a putative enhancer region positioned in the second intron ofPROX1and is in high LD (r2>0.8) with approximately 30 other intronic
PROX1variants (S5andS6Tables). Some of these intronic proxy SNPs (rs7541039, rs7517701,
association signal. Molecular analysis, including biallelic deletion of a 700bp region surrounding rs7541039 in the second intron ofPROX1, showed no effect on transcription ofPROX1—which does not appear to be expressed in human erythroid precursors—or neighboring genesSMYD2
andCENPF[28]. In light of this information, further investigation of the role of the putative
PROX1intronic regulatory region and associated genetic variants in hematopoiesis—specifically RBC production—is warranted.
The RDW-associated locus on chromosome 14q11 is located in a gene-rich region. The lead SNP rs941718 and several LD proxies are non-coding variants within or nearPSMB5, which encodes a 20S core proteasome subunit. From the standpoint of RBC biology, the ubi-quitin proteasomal system may be particularly important during erythroid maturation and hemoglobin synthesis to control globin-chain balance and limit potential toxicities of unstable free globin chains[29]. The lead SNP rs941718 is also a bloodcis-eQTL for nearby genes
HAUS4,MRPL52,PRMT5-AS1, andPRMT5[30,31] and has a CADD phred score of 15.8 (S5andS6Tables).PRMT5encodes an arginine methyltransferase involved in binding to theγ-globin promoter and silencing fetal hemoglobin expression, and therefore represents an additional potential mechanism for influencing RBC phenotype[32,33]. The LD proxy rs11846575, located just 3’ ofPSMB5, is proximal to a highly tissue-specific erythroid enhancer [34–36] and therefore merits further functional experimentation in the context of erythroid development and hemoglobin synthesis.
The other newly reported RDW-association signal is located on chromosome 5q23 and spans ~100kb includingSLC12A2and an upstream long non-coding RNA (LINC01184) on the antisense strand.SLC12A2(which codes for the protein NKCC1) is a sodium-, potassium-, and chloride-ion transporter membrane protein involved in cell-volume regulation and main-tenance in kidney, RBC, and other cell types[37]. Genetic variation in other RBC membrane ion-transport proteins (e.g.,PIEZO1,SLC4A1) has been associated with inter-individual vari-ability in RBC traits[13]. The lead SNP at theSLC12A2locus (rs17764730) lies within an exon ofLINC01184. RNA-Seq data indicates that bothSLC12A2andLINC01184are expressed in erythroblasts[35]. The lead SNP is in high LD (r2>0.8) with 23 other variants spanning
SLC12A2andLINC01184(S5andS6Tables). The strongest functional candidate SNP
(rs3812049, imputation quality score 1.006, r2to lead SNP = 0.89) is located within a bi-direc-tional promoter region between the 5’ ends ofSLC12A2andLINC01184. Rs3812049 is also positioned within an erythroid DNaseI hypersensitive region and is occupied by multiple tran-scription factors, including the erythropoietic trantran-scription factors GATA1 and TAL1 in erythroblasts and EGR1 in K562 cells. These observations suggest the possibility that the anti-sense transcript may be involved in erythrocyte maturation or maintenance by regulating
SLC12A2in erythrocytes. While this paper was under review, additional variants in the region of SLC12A2 and LINC01184 were reported to be associated with RDW in a predominantly European samples[38,39].
of NKCC1 in blood pressure regulation, kidney function, and RBC-volume maintenance, and ethnic differences among these traits[37]. Based on our preliminary molecular results, both
SLC12A2andLINC01184should be examined further for their potential roles in erythrocyte and non-erythroid traits.
The HCHS/SOL cohort represents a diverse subsample of Hispanics/Latinos across the U.S., with varying admixture proportions of three continental ancestry groups: Amerindians, Afri-cans, and Europeans. The beta-globin hemoglobin S and hemoglobin C variants, alpha-globin 3.8kb deletion, and G6PD A- variant have previously been shown to contribute to RBC pheno-typic variance among U.S. African Americans[41,42]. Here, we establish that these same com-mon African ancestral hemoglobin andG6PDgene variants are associated with quantitative RBC phenotypes among U.S. Hispanics/Latinos. The heterozygous states of each of these inher-ited RBC conditions are prevalent in populations in Africa, Asia, southern Europe, and South and Central America, and confer a survival advantage against malaria[43]. Even though carriers are generally without clinical sequelae, the heterozygous state of Hb C can induce RBC dehydra-tion, resulting in a higher MCHC[44]. Alpha-globin deletion carriers[1] and sickle cell trait carriers[45] may have lower levels of HCT, MCV, and MCH, and higher RBC counts, due to ineffective erythropoiesis. We also show that the HFE p.H63D variant (rs1799945) is associated with RBC phenotypes in Hispanics. Both C282Y and H63D hemochromatosis mutations are prevalent in Northern Europeans, while H63D appears more broadly in North Africa, the Mid-dle East, and less commonly in Asia. Emigration from Europe over the past 500 years likely introduced C282Y and H63D to Americas and Oceania, leading to a frequency of H63D in Amerindians and Hispanics/Latinos exceeds that of East and South Asians[46,47].
At the alpha-globin locus, the 3.8kb deletion and duplication generally arise as a result of misalignment of homologous sequences withinHBA1andHBA2and unequal crossing over during recombination. In U.S. Hispanics/Latinos, we observed that the 3.8kb alpha-globin duplication was significantly associated with lower MCV independently of the 3.8kb deletion. This may be due to imbalanced alpha/beta globin-chain synthesis, which may be exacerbated by co-inheritance of other globin gene mutations[48]. Nonetheless, given the caveats of struc-tural variant calling from genotype data, this finding requires additional validation using other molecular techniques. We observed additional allelic heterogeneity at the alpha-globin locus, a novel association signal for MCV and MCH with two Amerindian ancestral variants in high LD (r2>0.99): theHBMsplice-site variant rs148323035, and rs145546625, located ~2 kb upstream ofHBA2.HBMencodes hemoglobin mu, a globin chain similar to the oxygen high-affinity delta-globin found in reptiles and birds that is transcribed in a tightly regulated fashion in erythroid cells, particularly during the terminal differentiation stage[49]. TheHBMsplice donor variant rs148323035 overlaps with a putative regulatory region that spans the transcrip-tion start site and first intron ofHBMand is DNase hypersensitive, occupied by GATA1 and TAL1 in pro-erythroblasts[49].
power for generalization in HCHS/SOL is low due to the HCHS/SOL study population size; or (4) the power for generalization in HCHS/SOL may be low due to allelic frequency differences between populations.
In summary, we report three novel loci associated with RBC traits in Hispanics/Latinos as well as independent signals within two RBC trait-associated regions previously identified in African descent populations. This includes an Amerindian ancestral variant at the alpha-glo-bin gene cluster that overlaps a known alpha-gloalpha-glo-bin regulatory region. This particular variant is monomorphic among European, Asian, and African ancestral populations. Other Amerin-dian-specific loci for platelet count or diabetes have been identified among Hispanics/Latinos [50,51]. These findings emphasize the importance of performing genetic studies in Hispanic/ Latino populations.
Methods
Study population
The HCHS/SOL is a cohort of 16,415 self-identified Hispanic/Latino persons aged 18–74 years who were selected from households and census block groups in Chicago, IL, Miami, FL, Bronx, NY, and San Diego, CA, as previously described[52]. Study participants self-identified as having Hispanic/Latino background in one of six sub-groups, with the total study popula-tion including 6,471 participants identifying as having a Mexican background, 2,728 as Puerto Rican, 2,348 as Cuban, 1,730 as Central American, 1,460 as Dominican, and 1,068 as South American. Individuals were recruited to HCHS/SOL between 2008 and 2011, and underwent a baseline clinical exam that included clinical, lifestyle, and sociodemographic assessment[53]. Based on kinship coefficient among the genotyped individuals, the HCHS/SOL sample includes 204 parent-offspring trios, 1,042 parent-offspring duos, 699 full-sibling pairs, and numerous second- and third-degree relatives. The IRB committees for the HCHS Coordinat-ing Center at UNC Chapel Hill, San Diego State University, University of Illinois at Chicago, University of Miami, and Yeshiva University-Albert Einstein College of Medicine have all reviewed and approved the informed consent documents and study protocol. Written and signed informed consents in the language preferred by the participants are administered and archived at each of the participating field centers. All participants in this publication from HCHS/SOL have consented to use of their genetic and non-genetic data. Anyone not provid-ing consent has been excluded from this analysis. Demographic characteristics and RBC trait descriptive statistics for included study populations are presented inS2 Table.
Red blood cell trait measurement
Whole blood (approximately 58 to 76ml) was collected at Visit 1 for all consenting HCHS/ SOL participants by certified technicians trained at their respective field-center institutions. Supplies and procedures were standardized across all field centers; 4ml of whole blood for complete blood count (hemogram) was collected in a tube containing EDTA as an anticoagu-lant. CBC values were measured from whole blood using an automated hematology analyzer (Sysmex XE-2100, Sysmex America, Inc., Mundelein, IL 60060) at the central laboratory at the University of Minnesota Medical Center, Fairview, in Minneapolis.
Exclusion criteria
participants with>5% immature granulocytes (n = 2), end-stage kidney disease (n = 46), hematologic cancer (n = 28), or those undergoing cancer chemotherapy (n = 54). After exclu-sions, a total 12,502 participants were included for HCT, HGB, RBC, MCH, and MCV; 12,501 for RDW; and 12,500 for MCHC.
Genotype data cleaning and QC
HCHS/SOL subjects who consented to genetic studies had DNA extracted from whole blood, which was genotyped on the Illumina SOL HCHS Custom 15041502 B3 array. This array com-prised the Illumina Omni 2.5M array (HumanOmni2.5-8v1-1) and additional custom content [51,54]. In order to capture more Amerindian variation, the Omni2.5M array was modified by the addition of custom content comprised of ~150K SNPs selected from the CLM, MXL, and PUR 1000 Genomes Phase I samples for higher informativeness to identify Amerindian continental ancestry and for higher frequency in Amerindian genomic segments. Standard quality assurance/quality control (QA/QC) methods for SNP- and sample-level quality were applied. Quality metrics used to filter SNPs included Illumina/LA Biomed assay-failure indica-tor, missing call rate (>2%), deviation from Hardy-Weinberg equilibrium (p<10−5), Mende-lian errors (>3 in 1343 trios or duos), and duplicate sample discordance (>2 in 291 sample pairs). Following genotyping QA/QC procedures, there were 12,803 unique study participants and 2,232,944 SNPs available for imputation.
Imputation
For imputation, we used 1000 Genomes Project phase 1 reference panel and IMPUTE2 soft-ware. Genotypes were initially pre-phased using SHAPEIT2 (v2.r644,www.shapeit.fr), and subsequently imputed using IMPUTE2 software (v2.3.0,https://mathgen.stats.ox.ac.uk/ impute/impute_v2.html, last accessed Dec 2016)[54]. Only variants with at least two copies of the minor allele present in any of the four 1000 Genomes continental panels were imputed, yielding a total of 25,568,744 imputed variants (SNPs and indels). Imputed genotype dosages were modeled on a continuous scale from 0 to 2 in order to account for genotype uncertainty. Oevar is an imputation quality metric, defined as the ratio of the observed variance of imputed dosage to the expected binomial variance. Variants with an oevar<0.3 were considered low quality and excluded from analysis. Additional information about imputation and quality met-rics is found in Conomos, et al[55].
Copy number variant genotyping and association analysis at the
alpha-globin locus
The SOL Illumina Omni 2.5M array contains five variants (rs2362744, rs4021971, rs4021965, rs11639532, rs2858942) within the 3,811bp alpha-globin structural variant that can be used for determining copy number. Raw probe intensity data (normalized X and Y values) were exported from GenomeStudio as FinalReport files and then imported into the Genvisis soft-ware package (http://genvisis.org, last accessed Jan 2017) in order to use its specialized CNV calling algorithm. The first step in the process is to re-compute the Log R ratios (LRRs) using centroids derived from only high-quality samples (standard deviation of the autosomal LRRs
difference on the y-axis. For RBC phenotype association analyses, genotypes were then coded and analyzed separately for the presence of the 3.8kb alpha-globin deletion (0, 1, or 2 copies) and the presence of the 3.8kb alpha-globin duplication (0, 1, or 2 copies).
Replication samples
For replication of discovery associations in HCHS/SOL, 1000 Genomes Project phase 1-imputed GWAS data were utilized from three Hispanic/Latino study populations. These included the Women’s Health Initiative (WHI) SNP Health Association Resource (SHARe) project (n = 3,454), the Multi-Ethnic Study of Atherosclerosis (MESA) cohort (n = 782), and Mount Sinai BioMebiobank (n = 2,854)[56]. Genotyping in WHI-SHARe and MESA was per-formed using Affymetrix 6.0 array and imputation was perper-formed with MaCH software[57]. BioMewas genotyped using the Illumina OmniExpressExome beadchip array, phasing was performed using ShapeIt Version 2 release 644 and imputation with Impute version 2.3 using the All 1000 Genomes Project phase 1 integrated variant set (Aug 2012) as the reference.
Statistical analyses in HCHS/SOL
All outcomes were analyzed using linear mixed-effect models (LMMs), with random effects accounting for inter-individual correlation (due to either relatedness, shared household, or census block group). The covariates (fixed effects) included age, sex, five principal compo-nents, recruitment center, current cigarette smoking, sampling weight, and genetic analysis group (Cuban, Dominican, Puerto Rican, Mexican, Central American and South American) [54]. When performing analysis on the X chromosome, we included the first two X chromo-some-specific principal components as covariates. Additionally, pairwise genetic relatedness as estimated from the X chromosome was included as a random effect along with the autosomal genetic relatedness matrix. Additionally, since males have only one copy of X chromosome, genotypes on the X chromosome were coded 0, 1, 2 for females and 0, 2 for males. We also conducted three additional analyses for the known G6PD locus on the X chromosome: (1) sex-stratified analysis (S10 Table); (2) genotype-specific analysis in women, since there is
evi-dence for skewed X chromosome-inactivation with age[58] (S11 Table); and (3) age-genotype interaction analysis (S12 Table).
More information about the principal components, kinship matrix computation, and the genetic analysis groups, is provided in Conomos, et al[54]. Potential inflation was assessed using quantile-quantile plots of the test statistics against the standard normal distribution, and a calculated inflation factorλgc. We report genome-wide significant results at significance
threshold of p-value5.0x10-8and suggestive significance threshold of p-value<1.0x10⁻⁷in the HCHS/SOL discovery sample for all variants with MAF = 0.01 and imputation oevar>0.3 All SNPs exceeding genome-wide significance threshold of p-value<1x10⁻⁷are described in
S9 Table.
Admixture mapping analysis
Replication significance criteria
Association testing was performed in each of the three Hispanic replication data sets (WHI, BioMe, MESA) using linear regression and the same RBC trait transformation as the discovery samples, adjusted for age, sex, and principal components. Meta-analysis of results from the 3 independent Hispanic replication study samples was performed using the inverse-variance-weighted method implemented in METAL (http://csg.sph.umich.edu//abecasis/Metal, last accessed Dec 2016). We defined novel, replicated loci as those which exceeded a Bonferroni-corrected significance threshold of p<0.05/7, or 0.0071 (accounting for 7 SNPs carried for-ward for replication) and are located>1 megabase (Mb) from a previously reported genome-wide significant association signal.
Conditional analysis
We performed step-wise conditional analysis for each RBC phenotype to identify secondary, independent association signals within 500kb of known and newly discovered GWAS loci. In the first round of the conditional analysis for each trait, we used the same regression model as in the discovery GWAS, with additional adjustment for previously reported or novel variants identified in this study. The list of variants used in conditional analysis of each trait is provided inS13 Table. The significance threshold for discovering new, independent association signals was the same as the genome-wide discovery threshold (α= 5.0x10⁻⁸) as well as MAF0.01. Subsequent rounds of conditional analysis were repeated for each genomic region, adding the strongest genome-wide significant variant from the previous round as a covariate in the regression model, until no further genome-wide significant variants satisfying the MAF threshold remained in that region after covariate adjustment. The full models for each trait used in the final round of conditional analysis are listed inS14 Table. After obtaining probe intensity-based CNV calls for the 3.8kb alpha-globin CNV, we conducted conditional analysis on chromosome 16 using the calls from the re-typed CNV. The full models for each trait used in these conditional analysis are also listed inS14 Table. Conditional analysis with the
re-typed 3.8kb alpha-globin CNV was conducted on the subset of 12,390 individuals for whom the re-typed CNV calls were available.
Generalization analysis
Directional r-values were calculated based on one-sided p-values from both the “discovery” study (reported in the literature) and the HCHS/SOL, and based on the number of tests per-formed in the discovery study, in order to properly account for multiple testing. A SNP was considered generalized if its r-value was<0.05[61]. In generalizing associations reported by Ganesh et al. (2009), we did not employ directional control since Ganesh, et al., (2009) did not report effect sizes or directions[8]. The implication is a slight loss of power.
Generalization analysis was performed by looking up reported SNPs in HCHS/SOL results, in an analysis that mimics the analysis reported in the discovery study. For example, if a trait was reported as an association analysis with the natural-log-transformed trait, we performed the analysis with the same transformation in the HCHS/SOL population. In some cases, as with Kamatani, et al. (2010), we also matched effect-size reporting methods (standard deviations) for ease of comparison. Transformations, when applicable, are described inS1 Table. Since the same trait association may be reported by multiple studies, we counted only unique SNP-trait associations. In instances where more than one study reported associations for the same SNPs and trait, but used different trait transformations, we selected the results from the general-ization analysis in which the trait transformation matched our primary analysis.
Since some SNPs are associated with more than one RBC trait, and some genomic regions contain multiple SNPs associated with multiple traits, we summarize the generalization results as follows. Overall, we summarize the number of generalized unique trait-SNP associations (the same SNP may be counted more than once, if associated with more than one trait). Then, for each trait, we summarized (1) the number of unique SNPs, and (2) the number of unique genomic regions. To define genomic regions, we identified specific SNPs, and a 1Mb genomic region around them. Other SNPs within these regions were clumped together. We say that a genomic region generalized for a specific trait if at least one SNP in the region was associated with the trait.
Functional annotation of novel loci
In vitro analysis of functional candidates within SLC12A2-LINC01184,
PSMB5, and PROX1
The CRISPR/Cas9 system was used to mutagenize individual variants or small regions of inter-est identified during discovery analysis and subsequent bioinformatics interrogation. All oligo-nucleotide sequences used in CRISPR-Cas9 genome editing experiments are listed inS7 Table. The human umbilical cord blood derived erythroid progenitor cell line #2 (HUDEP-2)
was cultured and used for genome editing as previously described[71]. Individual and tandem pairs of single chimeric guide RNAs were cloned to lentiviral expression vectors (lentiGuide-Puro, Addgene plasmid 52963). Cells were transduced and selected for lentiviral integrants by antibiotic selection (10μg/ml blasticidin for lentiCas9-Blast [Addgene plasmid 52962], 1μg/ ml puromycin for lentiGuide-Puro). ForSLC12A2individual sgRNA promoter editing, indel frequencies were assessed after 7 days by nested PCR followed by amplicon deep sequencing. ForSLC12A2-LINC01184,PSMB5, andPROX1interstitial deletions, cells were plated at limit-ing dilution to isolate clones 7 days after transduction with tandem sgRNAs. Clones with biallelic deletions were characterized by presence of gap PCR amplification with primers out-side the deleted segment and absence of PCR amplification from inout-side the deleted segment. Expression of mRNA of genes of interest was compared to GAPDH expression using quantita-tive reverse transcription PCR (RT-qPCR) in control and edited HUDEP-2 cells. ForSLC12A2
individual sgRNA promoter editing, the total population of edited cells was evaluated in bulk by RT-qPCR. ForSLC12A2-LINC01184,PSMB5, andPROX1interstitial deletions, clones were first identified by PCR screening and then evaluated by RT-qPCR. For differentiation experiments, control and edited HUDEP-2 cells were cultured separately for 4 days in Ery-throid Differentiation Media (EDM) with Iscove’s Modified Dulbecco’s Medium (IMDM) (Life Technologies) supplemented with 330 mg/ml holo-transferrin (Sigma), 10 mg/ml recom-binant human insulin (Sigma), 2 IU/ml heparin (Sigma), 5% human solvent detergent pooled plasma AB (Rhode Island Blood Center), 3 IU/ml erythropoietin, 100 ng/ml human SCF, (R&D), 1 mg/ml doxycycline, 1% L-glutamine, and 2% penicillin/streptomycin. Subsequently the cells were cultured an additional 4 days in EDM lacking SCF, and then an additional 4 days in EDM lacking both SCF and doxycycline. Erythroid maturation was evaluated by flow cytometry staining with CD71 (eBiosciences), CD235a (eBiosciences), CD49f (Miltenyi), and DRAQ5 (eBiosciences) as well as morphology by May-Grunwald-Giemsa staining, Student’s t-tests were used for statistical analysis of results.
Data availability statement
Genotype data and GWAS results of discovery analysis of all the seven RBC traits can be requested via dbGaP study accession phs000880. Phenotype data can be requested via dbGaP study accession phs000810
Supplemental data
Supplemental data includes five figures, nine tables, and five Excel spreadsheets.
Supporting information
S1 Fig. Manhattan plots and accompanying QQ plots for seven RBC traits in 12,502 HCHS/SOL Hispanics/Latinos. A: Hematocrit; B: Hemoglobin; C: Red Blood Cell Count; D: Red Cell Distribution Width; E: Mean Corpuscular Hemoglobin; F: Mean Corpuscular
Hemoglobin Concentration; G: Mean Corpuscular Volume.All Manhattan plots include
Manhattan plots = -log10(p-value). X-axis of QQ plots = expected p-value; Y-axis of QQ plots = observed p-value.
(PDF)
S2 Fig. Locus-Zoom plots of loci significantly associated with RBC traits. All variants with
minor allele count>30 were plotted using Locus-Zoom software and genome build 37/hg19 positions on the x-axis. The left y-axis is the negative log10p-value for the association between
each variant and the relevant RBC trait; the gray line represents genome-wide significance (p<5x10⁻⁸). The left y-axis (blue lines on the plot) is the recombination rate in percent. The lead SNP at each locus is designated with a triangle if the SNP is imputed, and a diamond if the SNP is genotyped. Each symbol represents one variant, with circles for genotyped and x’s for imputed variants. Linkage disequilibrium (correlation, r2) with the lead variant in HCHS/SOL is indicated by color, with the colors for each level of LD shown in the upper-right corner of the plot. The genes at each locus are aligned underneath the plot with the corresponding genomic positions. (PDF)
S3 Fig. Impact of deletion of LINC01184 Exon-3 on expression of LINC01184 and SLC12A2.
HUDEP-2 human erythroid precursor cells were transduced with lentivirus expressing Cas9 and a pair of guide RNAs targeting cleavages flanking exon-3 ofLINC01184. After limiting dilution, clones were screened by PCR for deletion ofLINC01184exon-3. Twelve clones with biallelic deletion ofLINC01184exon-3 were identified and utilized for quantitative reverse transcription PCR to measure expression of LINC01184 and SLC12A2. Primers for LINC01184 measurement annealed to sequences at exons 1 and 2, i.e., non-deleted sequences. Data is shown for each of 12 biallelic deletion clones performed in technical triplicate. Gene expression is normalized to the level of parental cells. Lines indicate means and standard deviations.
(DOCX)
S4 Fig. Small indels in DNase I hypersensitive sites do not exhibit cis effects on expression ofPROX1 and PSMB5 in HUDEP-2 cells. Deletions of DNase I hypersensitive sites (DHSs) at
PSMB5andPROX1loci were not associated with significant gene expression changes in cis. HUDEP-2 human erythroid precursor cells were transduced with lentivirus expressing Cas9 and a pair of guide RNAs targeting cleavages flanking DHSs atPSMB5andPROX1. After limit-ing dilution, clones were screened by PCR for deletion of DHSs. Biallelic deletion clones were identified and utilized for quantitative reverse transcription PCR to measure expression of neighboring genes. As a control, nondeletion clones were isolated in parallel. Data is shown for RT-qPCR for indicated gene in a single clone, normalized to GAPDH, and then to median of the nondeletion clones. Each measurement was performed in technical triplicate. Lines indi-cate medians of each set of clones. No significant differences were identified between deletion and nondeletion clones (p>0.05 for all comparisons).
(TIF)
S5 Fig. Manhattan plots from admixture mapping analysis of RBC traits in HCHS/SOL participants. X-axis of Manhattan plots = ordered autosomal chromosomes; Y-axis of
Man-hattan plots = -log10(p-value). The X chromosome was not evaluated because established methods for admixture mapping of this chromosome are not available.
(DOCX)
S1 Table. Red blood cell trait descriptions. Genomic inflation factor refers to the ratio
between the median test statistics value and the expected median for variants with MAF0.01.
S2 Table. Characteristics of discovery and replication cohorts.Units for each trait are as
follows: Hematocrit, %; Hemoglobin, g/dL; RBC count, cells x109; RDW, %; MCH, pg; MCHC, g/dL; MCV, fL. Population means for hematocrit and hemoglobin are presented as sex-stratified due to significant differences between adult males and females.
Hematocrit and hemoglobin were available at the baseline exam for WHI SHARe in 3,539
participants. The remaining measures were available in a sub-sample of 1,205 WHI SHARe participants.
(DOCX)
S3 Table. Association results in the six genetic subgroups for genetic variants significantly associated with red blood cell traits in HCHS/SOL Hispanics/Latinos. # The full DNA
sequence of the deletion for esv2676630 can be found inS9 Table.het pval: p-value for test of
heterogeneity. C/A = coded and alternate alleles. CAF = coded allele frequency. Chromosomal positions refer to hg build19/GRCh37. Sub-groups were generated using self-identified back-ground and genetic principal components analysis.
(XLSX)
S4 Table. Generalization of variants previously associated with seven red blood cell traits in European-, Asian-, and African-ancestry populations to HCHS/SOL Hispanics/Latinos.
A: Hematocrit; B: Hemoglobin; C: Red Blood Cell Count; D: Red Cell Distribution Width; E: Mean Corpuscular Hemoglobin; F: Mean Corpuscular Hemoglobin Concentration; G: Mean Corpuscular Volume.
CAF = Effect Allele Frequency; N = number of study participants; NR = not reported; "—" = alternate allele not reported. Generalization was based on statistical significance (r0.05) and directional consistency with the published variant in HCHS/SOL Hispanics/Latinos.
(XLSX)
S5 Table. Summary of findings from the functional annotation of novel red blood cell trait-associated variants and their LD partners (r20.8) identified in HCHS/SOL. C/A =
coded and alternate alleles. CAF = coded allele frequency. (DOCX)
S6 Table. Summary ofin silico functional prediction algorithm results for novel significant
variants and their LD partners (r20.8) in discovery and conditional analyses. Chromo-some and base pair position reported from GRCh37/hg19.†SNP type: 0 = imputed, 2 = geno-typed.1CADD score = PHRED-scale score indicating deleteriousness of variants and all other substitutions in the genome;2Unmatched score presented from GWAVA;3Regulome DB score is on a scale from 1 to 7, with lower numbers indicating more evidence for the variant being functional;4deltaSVM score predicts the impact of SNPs on DNaseI sensitivity. "oevar" is defined as the ratio of the observed variance of imputed dosage to the expected binomial var-iance.
(XLSX)
S7 Table. Oligonucleotide sequences used in CRISPR-Cas9 genome editing,PCR screening and RT-qPCR quantification. F = forward, R = reverse. Chromosomal positions refer to hg
build19/GRCh37. (DOCX)
S8 Table. Comparison of 1000 genomes phase I and re-typed (based on probe intensity) deletion genotype calls for the alpha globin 3.8kb deletion.value of 0 = 0 copies of 3.8kb deletion, 1 = 1 copy of deletion, 2 = 2 copies of deletion.
S9 Table. All variants reaching suggestive significance (1E-7) for association with seven red blood cell traits in HCHS/SOL. A: Hematocrit; B: Hemoglobin; C: Red Blood Cell Count; D:
Red Cell Distribution Width; E: Mean Corpuscular Hemoglobin; F: Mean Corpuscular Hemoglo-bin Concentration; G: Mean Corpuscular Volume. Variants with a low imputation value (oevar<
0.3) were not included in association analyses. Variants with minor allele frequency (MAF)<
0.01 excluded.†imputed calls for esv2676630 were used in these analyses (seeMethods). (XLSX)
S10 Table. Sex-stratified results for genome-wide significant X-chromosome associations.
Chromosomal positions are aligned to build hg19/GRCh37. Alt = alternative; CAF = coded allele frequency; MCH = mean corpuscular hemoglobin; MCV = mean corpuscular volume; RBC = red blood cell count; RDW = red cell distribution width; SE = standard error. (DOCX)
S11 Table. Genotype-specific association results for lead X chromosome variant in HCHS/ SOL female participants. Chromosomal positions are aligned to build hg19/GRCh37. Alt =
alternative; CAF = coded allele frequency; MCH = mean corpuscular hemoglobin; MCV = mean corpuscular volume; RBC = red blood cell count; RDW = red cell distribution width; SE = standard error.
(DOCX)
S12 Table. Interaction results of age and lead X chromosome variant genotype in HCHS/ SOL female participants. Chromosomal positions are aligned to build hg19/GRCh37. Alt =
alternative; CAF = coded allele frequency; MCH = mean corpuscular hemoglobin; MCV = mean corpuscular volume; RBC = red blood cell count; RDW = red cell distribution width; SE = standard error.
(DOCX)
S13 Table. List of all variants used in conditional analysis. Allele frequencies reported for
1000 Genomes super-populations European (EUR), African (AFR), American (AMR), South Asian (SAS) and East Asian (EAS). HCT, hematocrit; HGB, hemoglobin; MCH, mean corpuscu-lar hemoglobin; MCHC, mean corpuscucorpuscu-lar hemoglobin concentration; MCV, mean corpuscucorpuscu-lar volume; RBC, red blood cell count; RDW, red cell distribution width; NA: “not applicable” because this deletion has not been characterized in 1000 Genomes populations;I/D: coded allele = insertion, alternative allele = deletion;#During sequential conditional analysis, the round number in which the variant was conditioned for. CAF, coded allele frequency; SE, stan-dard error.†imputed calls for esv2676630 were used in all conditional analyses (seeMethods). (XLSX)
S14 Table. Full models used for conditional analyses. EV = Eigenvector; HCT = hematocrit;
HGB = hemoglobin; MCH = mean corpuscular hemoglobin; MCHC = MCH concentration; MCV = mean corpuscular volume; RBC = red blood cell count; RDW = red cell distribution width; hba_cnv_countDel = intensity-based calls for the alpha gene deletion; hba_cnv_count-Dupl = intensity-based calls for the alpha gene duplication.†imputed calls for esv2676630 were used for conditional analyses (seeMethods).††probe intensity-based re-typed calls were used for esv2676630 in the chromosome 16 conditional analyses (seeMethods).
(DOCX)