STI 2018 Conference Proceedings
Proceedings of the 23rd International Conference on Science and Technology Indicators
All papers published in this conference proceedings have been peer reviewed through a peer review process administered by the proceedings Editors. Reviews were conducted by expert referees to the professional and scientific standards expected of a conference proceedings.
Chair of the Conference
Paul Wouters
Scientific Editors
Rodrigo Costas Thomas Franssen Alfredo Yegros-Yegros
Layout
Andrea Reyes Elizondo Suze van der Luijt-Jansen
The articles of this collection can be accessed at https://hdl.handle.net/1887/64521
ISBN: 978-90-9031204-0
© of the text: the authors
© 2018 Centre for Science and Technology Studies (CWTS), Leiden University, The Netherlands
Anna Kiss*, Sándor Soós**
Department of Science Policy and Scientometrics, Library and Information Centre of the Hungarian Academy of Sciences, Arany János street 1., Budapest, 1051 (Hungary)
Department of Science Policy and Scientometrics, Library and Information Centre of the Hungarian Academy of Sciences, Arany János street 1., Budapest, 1051 (Hungary)
Introduction
In recent years, increasing attention is being drawn to the analysis of scientific career path using the indicators of academic career in career studies (Paneros and Malesios, 2009). The aim of this study was to determine the patterns of academic career paths using multivariate bibliometric analysis. In opinion of Chakraborty et al. (2014) the success of scientific career depends on two factors: the identification of the research area and right research topic. However, one of the greatest strengths and difficulties of the career field is its diversity (Rhaiem, 2017). This diversity allows for wide coverage of relevant career dynamics across the scientific career trajectories and across levels of analysis. Bibliometric methods play an increasing role in scientific career path analysis and its evaluation (Persson. 2017). There are well-known methods to measure academic productivity, or to model the impact of co-author network on research performance, but an integrative approach is still missing to characterise the multiple aspects of scientific career (Wildegaard et al., 2014).
It is generally accepted, that for better understanding of characteristic features of academic career, the application of multivariable methods is essential (Bommann et al., 2008). This approach is significant for evaluation of performance regarding both teams and individual researchers Bordons et al., (2003); Verbere, (2015); Bornmann and Williams (2017) and further development of scientific policy. At the same time, we do not have any statistically proven methodology, which would be suitable for follow-up and reflexion of academic performance in the lifespan of the researcher, even though this would be important for the evaluation, strategic planning, and –in a larger perspective, paired with milestones of researchers during their careers- for forecasting the consequences of policy measures (Bayer and Smart, 1991; Besselar and Sandström, 2016). The novelty of our paper is an attempt to work out of a complex indicator system, that combines the aspect of academic career that can be captured via purely bibliometric methods.
STI Conference 2018 · Leiden
Methodology
Our source database has been the Hungarian National Scientific Bibliography (MTMT, www.mtmt.hu), a national collection of Hungarian academic publications, similar to other national scientific bibliographic databases (e.g. NL: NARCIS, SL: SICRIS; NO: CRISTIN). The principles of this system are regulated by Hungarian Law on Academy of Sciences (Hungarian Parliament, 2015), the application of this system is mandatory for a rather wide circle of Hungarian researchers in the public sphere. Due to the fact that this bibliometric data collection platform is relatively new, young researchers are over-represented. In order to avoid the distortion of our sample, we have excluded the authors, who have less than three articles or whose academic career (time span from first to last publication is less than three years). We have matched the publication records retreived from the MTMT database with Web of Science data, and used the WoS-indexed fraction to conduct the actual analysis (which is a limitation of this pilot study).
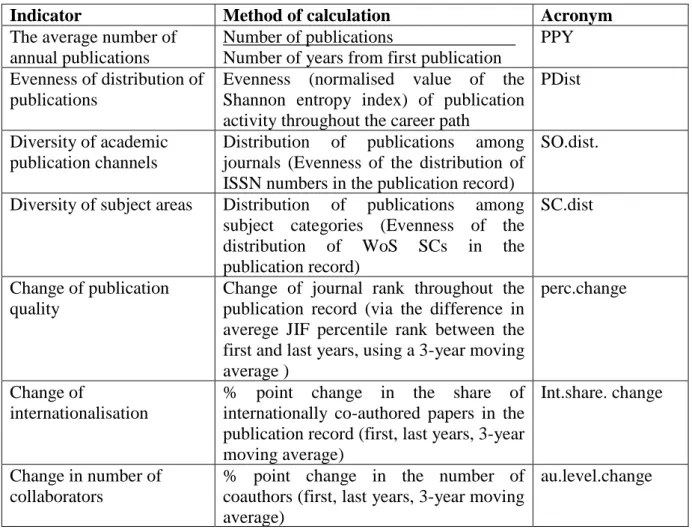
Based on these data different indicators have been calculated for each author. The indicators have been previously studied separately in different aspects and ways (e.g. Matia et al., 2005; Ding et al., 2011) but if we would like to evaluate the indicators of academic career path, we need to analyse not just these factors, on a one-by-one base, but we need to take into account the combination of all of these indicators and influencing conditions. Based on this, some typical career path could be constructed. The system of these indicators is summarised in Table 1.
Table 1. System of main scientometric indicators, applied in the study
Indicator Method of calculation Acronym
The average number of annual publications
Number of publications
Number of years from first publication
PPY
Evenness of distribution of publications
Evenness (normalised value of the Shannon entropy index) of publication activity throughout the career path
PDist
Diversity of academic publication channels
Distribution of publications among journals (Evenness of the distribution of ISSN numbers in the publication record)
SO.dist.
Diversity of subject areas Distribution of publications among subject categories (Evenness of the distribution of WoS SCs in the publication record)
SC.dist
Change of publication quality
Change of journal rank throughout the publication record (via the difference in averege JIF percentile rank between the first and last years, using a 3-year moving average )
perc.change
Change of
internationalisation
% point change in the share of internationally co-authored papers in the publication record (first, last years, 3-year moving average)
Int.share. change
Change in number of collaborators
% point change in the number of coauthors (first, last years, 3-year moving average)
The data have been analysed by simple (descriptive) and multivariable statistical methods.
Results
Firstly, we have applied the simple descriptive statistics for the characterisation of the sample and the indicators. Analysing Table 2, it is obvious, that there are considerable differences in the sample, e.g. the standard deviation is extremely high in a number of cases. The distribution of indicators in most cases could be approximated by lognormal function.
Table 2. The basic statistical parameters of variables
Indicators Mean Std. Deviation
PPY 1.51 1.88
PDist 0.940 0.046
SO.dist 0.928 0.089
SC.dist 0.830 0.201
perc.change 0.0011 0.065
au.level.change 0.027 0.0796
int.share.change 0.05 0.236
The clustering of authors on base of the scientometric indicators did not yield any reliable results, because the silhouette measure of cohesion and separation has been too low to separate the different cluster of individual actors. That’s why we have applied a two-step method: first we determined the factor structure of variables, then carried over the clustering based on this. The principal component analysis has yielded four factors, explaining nearly two thirds of the total variance (Bartlett sphericity index has been significant).
According to the principal component analysis, the first component is dominated by the average number of annual publications variable. The Shanon enthropy index has a significant negative value in this variable. This factor is suitable for characterisation of the productivity and the level of international imbedness of the researcher. In second factor the highest component loads have the diversity of academic publication channels and the diversity of subject areas. That’s why this factor offers information on diversity of publication channels used by the author. In third factor the two dominant variables are the change in number of collaborators and the change of internationalisation. As a summary it can be stated, that this component is suitable for the description of dynamic character of the academic career.
Using these main career components, the second step consisted of the clustering of authors, in order to arrive at a typology of career paths. Based on the Akaike and Schwarz information criteria we have been able to separate four clusters. The characteristic features of different clusters are summarised in Table 3.
STI Conference 2018 · Leiden
In case of second cluster (cluster B) the yearly academic productivity is the lowest. The diversity of communication channels and the topics is high. The publication quality and the indicators of international cooperation intensity show declining tendency. This cluster reflects the activity of a researcher, who decreases his/her international network and search lower quality publication channels to publish the results of his/her research. Cluster C is the opposite of the former cluster: the productivity is relatively low, too, but there is a strong tendency of improvement of quality of publication channels and a rapidly increasing internationalisation. This cluster reflects the strategy of emerging young scientists. The cluster D is similar to cluster C but there the average level of change of collaborators is relatively low. This is the cluster of emerging researchers, who have a stale domestic and international network of collaborators.
Table 3. Average values (centers) of clusters
Indicators Clusters Significant differences
at 5% of significance
A B C D
PPY 2.0568 1.1285 1.1531 1.5759 A-B;C; D; B-D; C-D
P.dist 0.9289 0.9414 0.9469 0.9409 A-B;C;D; B-C; C-D
SO.dist 0.7914 0.9524 0.9552 0.9454 A-B;C; C-D
SC.dist 0.4981 0.8965 0.8895 0.8754 A-B;C; B-D
P.change 0.0132 -0.0450 0.0584 0.0204 A-B;C; B-C;D; C-D
perc.change -0.0074 -0.0312 0.0371 0.0037 A-B;C; D; B-C;D; C-D au.level.change 0.0217 -0.0389 0.0979 0.0281 A-B;C; D; B-C;D; C-D int.share.change. 0.0596 -0.1571 0.2749 0.0380 A-B;C; B-C;D; C-D Number of cluster
members
573 989 900 1737
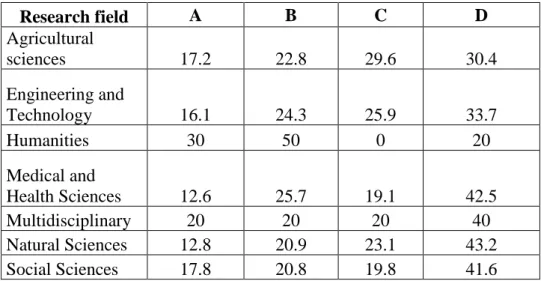
The different indicators of contingency (Chi square, Likelihood ratio, McNemar-Bowker test) show significant correspondence between fields of research and cluster membership, but it should be noted, that in case of some fields of research (e.g. humanities, multidisciplinary sciences) the number of researchers have been relatively low (Table 4).
Table 4. Distribution of researchers across clustres in different research fields (%)
Research field A B C D
Agricultural
sciences 17.2 22.8 29.6 30.4
Engineering and
Technology 16.1 24.3 25.9 33.7
Humanities 30 50 0 20
Medical and
Health Sciences 12.6 25.7 19.1 42.5
Multidisciplinary 20 20 20 40
Natural Sciences 12.8 20.9 23.1 43.2
Total 13.6 23.6 21.4 41.4
The most important differences are in structure of C and D cluster. Nearly 29.6% of agricultural researchers are in the C cluster, but the share of researchers in sphere of Medical and health sciences is just 19.1%.
Conclusion
We have developed a complex system of bibliometric-based indicators, which could be established a typology for characterisation of career path. This indicator system is relatively easy to obtain and the classification of researchers, it is well interpretable and robust. There are considerable differences in distribution of clusters across different fields of sciences, more than 41% of researchers work in field of social sciences in cluster D. This shows, that in field of social sciences the level of international cooperation is relatively low, as opposed to e.g. the agricultural sciences, where the share of researchers in this cluster is just 30%. Using bibliometric methods to analyse different career paths, this paper demonstrates the benefits of combining bibliometric methods in order to find typology among different career trajectories.
References
Bayer, A. E., & Smart, J. C. (1991). Career publication patterns and collaborative “styles” in American academic science. The Journal of Higher Education, 62(6), 613-636.
Bordons, M., Morillo, F., Fernández, M. T., & Gómez, I. (2003). One step further in the production of bibliometric indicators at the micro level: Differences by gender and professional category of scientists. Scientometrics, 57(2), 159-173.
Bornmann, L., Mutz, R., & Daniel, H. D. (2008). Are there better indices for evaluation purposes than the h index? A comparison of nine different variants of the h index using data from biomedicine. Journal of the Association for Information Science and Technology, 59(5), 830-837.
Bornmann, L., & Williams, R. (2017). Can the journal impact factor be used as a criterion for the selection of junior researchers? A large-scale empirical study based on ResearcherID data. Journal of Informetrics, 11(3), 788-799.
Boyack, K. W., Klavans, R., & Börner, K. (2005). Mapping the backbone of science. Scientometrics, 64(3), 351-374.
Chakraborty, T., Tammana, V., Ganguly, N., & Mukherjee, A. (2014). Understanding and modeling diverse scientific careers of researchers. Journal of Informetrics, 9(1), 69-78.
Diamond, A. (1984). An economic model of the life-cycle research productivity of scientists. Scientometrics, 6(3), 189-196.
Ding, J., Yang, L., Liu, Q. (2011). Measuring the academic impact of researchers by combined citation and collaboration impact. In: (Ed.), Proceedings of the 14th International Conference on Scientometrics and Informetrics. 1177-1187.
STI Conference 2018 · Leiden
IBM. (2015). IBM SPSS Modeller 17 Algorithms Guide. New York: IBM.
Kaiser, H. F. (1974). An index of factorial simplicity. Psychometrica, 39, 31-36.
Matia, K., Nunes Amaral, L. A., Luwel, M., Moed, H. F., & Stanley, H. E. (2005). Scaling phenomena in the growth dynamics of scientific output. Journal of the American Society for Information Science and Technology, 56(9), 893-902.
Panaretos, J., & Malesios, C. (2009). Assessing scientific research performance and impact with single indices. Scientometrics, 81(3), 635.
Persson, R. A. (2017). Bibliometric author evaluation through linear regression on the coauthor network. Journal of Informetrics, 11(1), 299-306.
Rhaiem, M. (2017). Measurement and determinants of academic research efficiency: a systematic review of the evidence. Scientometrics, 110(2), 581-615.
Simeon, V., Momčilović, B., Kralj, Z., & Grgas, B. (1986). Multivariate statistical analysis of the bibliographic output from a research institution, in relation to the measures of scientific policy. Scientometrics, 9(5-6), 223-230.
Van Den Besselaar, P., & Sandström, U. (2016). Gender differences in research performance and its impact on careers: a longitudinal case study. Scientometrics, 106(1), 143-162.
Verbree, M., Horlings, E., Groenewegen, P., Van der Weijden, I., & Van den Besselaar, P. (2015). Organizational factors influencing scholarly performance: a multivariate study of biomedical research groups. Scientometrics, 102(1), 25-49.
Waltman, L. (2016). A review of the literature on citation impact indicators. Journal of Informetrics, 10(2), 365-391.