Trickle-Down Preferences: Preferential
Conformity to High Status Peers in Fashion
Choices
Jeff Galak1*, Kurt Gray2, Igor Elbert3, Nina Strohminger4
1Tepper School of Business, Carnegie Mellon University, Pittsburgh, Pennsylvania, United States of America,2Department of Psychology and Neuroscience, University of North Carolina, Chapel Hill, North Carolina, United States of America,3Independent Researcher, New York, New York, United States of America,4School of Management, Yale University, New Haven, Connecticut, United States of America
Abstract
How much do our choices represent stable inner preferences versus social conformity? We examine conformity and consistency in sartorial choices surrounding a common life event of new norm exposure: relocation. A large-scale dataset of individual purchases of women’s shoes (16,236 transactions) across five years and 2,007 women reveals a balance of con-formity and consistency, moderated by changes in location socioeconomic status. Women conform to new local norms (i.e., average heel size) when moving to relatively higher status locations, but mostly ignore new local norms when moving to relatively lower status loca-tions. In short, at periods of transition, it is the fashion norms of the rich that trickle down to consumers. These analyses provide the first naturalistic large-scale demonstration of the tension between psychological conformity and consistency, with real decisions in a highly visible context.
Introduction
Conformity is undoubtedly a robust psychological phenomenon, but classic laboratory studies [1,2] have difficulty speaking to the subtle variations we experience in everyday life. Qualitative and quantitative investigations into everyday conformity [3–6]—while informative—involve small sample sizes, specific locations, and external interventions, leaving open questions about large-scale endogenous conformity. Even recent large-scale network analyses of“spreading” tastes are often difficult to generalize beyond specific closed networks [7], leaving open ques-tions about transiques-tions between social networks.
To overcome the challenges of past research on everyday conformity, we examine changing preferences within a large dataset of real purchase behavior, obtained from an online retailer of luxury clothing brands. Clothing is a key expression of identity that balances conformity and self-expression [8,9]. Sartorial choices, therefore, provide a convenient test case for how con-formity plays out in real life. To study sartorial concon-formity, we examined a common life event
a11111
OPEN ACCESS
Citation:Galak J, Gray K, Elbert I, Strohminger N (2016) Trickle-Down Preferences: Preferential Conformity to High Status Peers in Fashion Choices. PLoS ONE 11(5): e0153448. doi:10.1371/journal. pone.0153448
Editor:Jong-Ling Fuh, Taipei Veterans General Hospital, TAIWAN
Received:October 27, 2015
Accepted:March 30, 2016
Published:May 4, 2016
Copyright:© 2016 Galak et al. This is an open access article distributed under the terms of the
Creative Commons Attribution License, which permits unrestricted use, distribution, and reproduction in any medium, provided the original author and source are credited.
where changes in clothing are especially visible: relocation. By looking at this life event, we can not only quantify overall conformity but also examine the impact of extrinsic social variables upon conformity. One important potential variable is socioeconomic status, such that confor-mity may depend upon the relative socioeconomic status between origin and destination.
Theories in sociology have argued that taste, especially for highly visible consumer products, flows from high status individuals to low status individuals [10]. This suggests that conformity should be more likely when an individual moves to an area higher in SES, in order to emulate high status others [11–13]. In contrast, when moving to areas with relatively lower status indi-viduals, conformity may be less likely because these individuals may wish to maintain a sense of uniqueness by remaining consistent with their original preferences [14]. This tension between conformity and consistency is a hallmark of Optimal Distinctiveness Theory, which postulates that people balance fitting-in with remaining unique [15,16]. However, we suggest a twist on Optimal Distinctiveness Theory, where people are motivated to fit in with high-status groups and remain unique from low-status groups. One way of investigating this potential asymmetry is through fashion choices.
Anecdotally, fashion does seem to progress from high status to low status: runway shows in Paris and Milan give way to celebrity wardrobes, then to clothing in high-end boutiques, before descending to malls, department stores and discount racks. These observations are echoed by the“upper class theory of fashion,”which predicts a trickle-down of preferences from the elite leisure class to the proletariat [17]. However, fashion and style can also be inspired from rela-tively low SES groups, such as the rise (and resurrection) of grunge, the popularity of tattoos, and the power of hip-hop fashions.
Although many have discussed questions of conformity versus consistency of sartorial pref-erences in light of SES disparities, no work has empirically examined the interplay of these issues. In the present work, we use large scale naturalistic data to investigate the interplay of conformity/consistency and relative SES for one particular sartorial preference, shoe heel-size. Although sartorial choices are multi-dimensional [18], shoe heel-size is a quantitative measure that varies across geographic locations [19]. Relocation provides an ideal lens to examine SES and conformity because it represents a relatively rapid and discrete change in SES environ-ment. Specifically, we investigate whether post-relocation purchases stay consistent with past behavior, or whether they follow new destination norms—and whether conformity reflects the relative status of the new location.
Materials and Method
Dataset Summary
The dataset comes from an online retailer of luxury clothing brands. Data included 16,236 shoe purchases over five years (2010–2015) from 2,007 women who had changed primary resi-dence locations (i.e., US Zip Code) at least once. Average heel-size of shoes purchased by par-ticipants in the destination location was the key dependent variable (i.e.,new sartorial behavior). Key predictor variables were the average heel-size purchased by participants in the origin location (past sartorial behavior); the average heel-sizes purchased by others in the par-ticipant’s origin location (origin norms) and destination location (destination norms); and the median income level in the US Census Region of origin (origin SES) and destination ( destina-tion SES), as given by 2010 US Census data.
Sample
Our data come from an online retailer of luxury clothing brands. The retailer’s name cannot be disclosed due to a non-disclosure agreement prohibiting the naming of the company, though
Funding:The authors have no support or funding to report.
use of the data for research purposes and disclosure of summary statistic is permitted. Of pri-mary interest are individuals who we can identify as having moved from one geographic loca-tion to another during our observaloca-tion window. This identificaloca-tion task was accomplished by defining a“mover”as someone in United States who had at least five transactions in one loca-tion followed by at least five transacloca-tions in a new localoca-tion. Though this specificaloca-tion is imper-fect, it is reasonable to assume that an individual who purchased clothing a number of times in one area and then systematically switched their purchases to a new area has, at minimum, a strong physical presence in the two geographies, and, at best, permanently moved. Moreover, because our measure of interest is heel size, we further restricted our data set to those individu-als who purchased at least one shoe in either of the two locations. Looking only at shoe transac-tions (which is what we have direct access to), women remain in a location, 115 days on average. This likely underestimates how long they actually live in a location, because our data are both left and right truncated and we only examine shoe purchases, not all clothing pur-chases. This resulted in data from 2,007 individuals who placed 16,236 orders for shoes between the dates 6/14/2010 and 2/3/2015. Of those, 1,865 had data from areas where we were able to ascertain sufficient information (more on this below). Of those, 15 were outliers in terms of their number of moves (more than two standard deviations from the mean) and so were excluded, resulting in a final data set of 1,850 customers who placed 14,496 transactions (seeTable 1for summary statistics andS1 Figfor histogram of number of transactions per cus-tomer andS1 Tablefor correlation matrix of all relevant variables). Of note, the online retailer
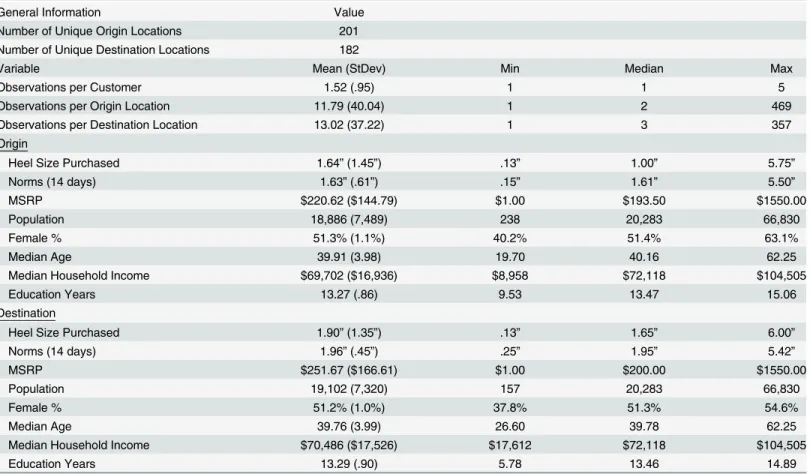
Table 1. Select Descriptive Statistics.
General Information Value
Number of Unique Origin Locations 201
Number of Unique Destination Locations 182
Variable Mean (StDev) Min Median Max
Observations per Customer 1.52 (.95) 1 1 5
Observations per Origin Location 11.79 (40.04) 1 2 469
Observations per Destination Location 13.02 (37.22) 1 3 357
Origin
Heel Size Purchased 1.64”(1.45”) .13” 1.00” 5.75”
Norms (14 days) 1.63”(.61”) .15” 1.61” 5.50”
MSRP $220.62 ($144.79) $1.00 $193.50 $1550.00
Population 18,886 (7,489) 238 20,283 66,830
Female % 51.3% (1.1%) 40.2% 51.4% 63.1%
Median Age 39.91 (3.98) 19.70 40.16 62.25
Median Household Income $69,702 ($16,936) $8,958 $72,118 $104,505
Education Years 13.27 (.86) 9.53 13.47 15.06
Destination
Heel Size Purchased 1.90”(1.35”) .13” 1.65” 6.00”
Norms (14 days) 1.96”(.45”) .25” 1.95” 5.42”
MSRP $251.67 ($166.61) $1.00 $200.00 $1550.00
Population 19,102 (7,320) 157 20,283 66,830
Female % 51.2% (1.0%) 37.8% 51.3% 54.6%
Median Age 39.76 (3.99) 26.60 39.78 62.25
Median Household Income $70,486 ($17,526) $17,612 $72,118 $104,505
Education Years 13.29 (.90) 5.78 13.46 14.89
does not customize offerings by region within the United States, and therefore all shoe options were available to all individuals regardless of their geographic location.
Sales Transaction Variables
The dataset contains panel data at the transaction level. For each transaction, we observe unique user id, date of transaction, census region of transaction, MSRP (not the price paid) of shoe, number of shoes purchased in that location on that date, and heel size of shoe purchased. In addition to the transaction data, we constructed norm indices at the transaction level that allow us to identify the norms of the region that an individual purchased their shoes in. This was accomplished by averaging across all transactions of other customers in the region of inter-est for the 14 days prior to the transaction in quinter-estion. That is, for each transaction, we con-structed unique norm indices by averaging across all other transactions from other customers in the census region where the transaction took place for the previous 14 days. This allowed us to construct norm indices for heel size and MSRP. These norm indices are particularly useful as they naturally account for seasonal variations in norms (e.g. higher heels purchased in the summer time) because they only look at recent transactions.
In order to ascertain the impact of location on heel size preferences, we transform the data into individual level transaction data averaging across sales within a geographic region within an individual. We classify the data into two groups: data from the origin location and data from the destination location. Origin location data is the average of all transaction data from a given individual within the first observed location in the dataset. Destination location data is the average of all transaction data from a given individual within a subsequent location in the dataset. For each individual, there may be more than one such origin-destination pair (if some-one moved multiple times) and so we include multiple rows of data as needed and control for both individual level variation and move number with random effects. SeeS2 Figfor a histo-gram of number of moves.
Missing Data
Because some transactions were either 1) at the very beginning of our data collection window (left censored data) or 2) in geographic regions with no other transactions for the 14 days prior to the transaction in question, we were unable to construct norm data for them. There were 398 (2.7%) observations that had any such missing data. Because the type of data missing var-ied across customers, we do not exclude customers merely for having one missing data value. Rather, we exclude customers when the data missing applies to the model being tested (see bot-tom ofTable 2for Customer and Observation sample sizes in each model).
Demographic Variables
The socioeconomic status of a geographic region was determined with 2010 ZIP code level US census data and create census region averages. Specifically, for each region, we observe the pop-ulation size, % of poppop-ulation that is female, the median age of the individuals, average years of education of individuals, and, most critically, the median household income of individuals.
Ethics Statement
Data Availability
The firm providing the data used in the subsequent analyses has requested that the data not be made publicly available. All authors signed non-disclosure agreements with the firm to such an effect. The firm has allowed aggregate data such as that reported in the Tables of this paper and any results from data analyses that do not inadvertently reveal individual level data to be made publicly available. For any additional aggregate analyses, the corresponding author can be con-tacted and aggregate results can be shared on an ad hoc basis.
Results
Main Effects of Relocation
Does purchase behavior after moving reflect conformity to the new location or consistency with their past behavior? To address this question, we ran a series of mixed model regressions with random intercepts for individual, move number, origin location, and destination location predicting own average heel size purchased in the destination location (Table 2). Of note, ori-gin location and destination location random effects allow us to control for any variation in the general nature of the locations that we could not observe with region level data (e.g. New York City’s cutting edge fashion scene vs. Topeka, Kansas’more conservative approach to fashion). Heel size was log transformed in order to normalize the data.
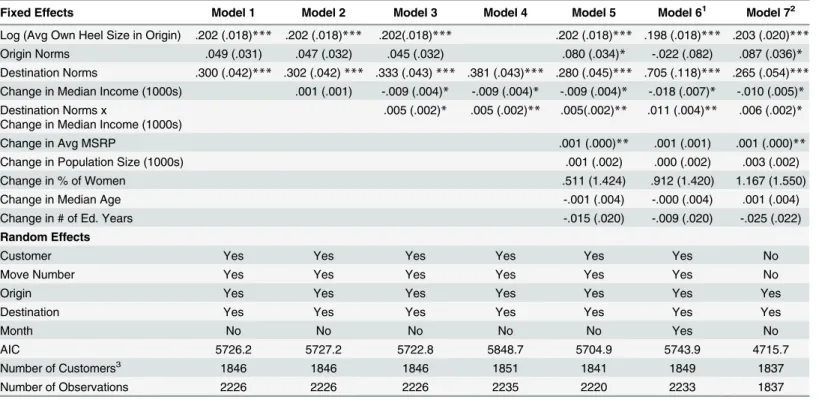
Table 2. Mixed Models Predicting Log(Avg Own Heel Size Purchased in New Location).
Fixed Effects Model 1 Model 2 Model 3 Model 4 Model 5 Model 61 Model 72
Log (Avg Own Heel Size in Origin) .202 (.018)*** .202 (.018)*** .202(.018)*** .202 (.018)*** .198 (.018)*** .203 (.020)*** Origin Norms .049 (.031) .047 (.032) .045 (.032) .080 (.034)* -.022 (.082) .087 (.036)* Destination Norms .300 (.042)*** .302 (.042)*** .333 (.043)*** .381 (.043)*** .280 (.045)*** .705 (.118)*** .265 (.054)*** Change in Median Income (1000s) .001 (.001) -.009 (.004)* -.009 (.004)* -.009 (.004)* -.018 (.007)* -.010 (.005)* Destination Norms x
Change in Median Income (1000s)
.005 (.002)* .005 (.002)** .005(.002)** .011 (.004)** .006 (.002)*
Change in Avg MSRP .001 (.000)** .001 (.001) .001 (.000)**
Change in Population Size (1000s) .001 (.002) .000 (.002) .003 (.002)
Change in % of Women .511 (1.424) .912 (1.420) 1.167 (1.550)
Change in Median Age -.001 (.004) -.000 (.004) .001 (.004)
Change in # of Ed. Years -.015 (.020) -.009 (.020) -.025 (.022)
Random Effects
Customer Yes Yes Yes Yes Yes Yes No
Move Number Yes Yes Yes Yes Yes Yes No
Origin Yes Yes Yes Yes Yes Yes Yes
Destination Yes Yes Yes Yes Yes Yes Yes
Month No No No No No Yes No
AIC 5726.2 5727.2 5722.8 5848.7 5704.9 5743.9 4715.7
Number of Customers3 1846 1846 1846 1851 1841 1849 1837
Number of Observations 2226 2226 2226 2235 2220 2233 1837
Note—Values in parentheses are standard errors. *p<.05,
**p<01, ***p<.001
1—Model 6: Origin and Destination Norms and Change in Avg MSRP include all history of location, not just previous 14 days. 2—Model 7 uses only data fromfirst move. 3—Number of Customers and Observations differ due to variations in missing data.
When predicting the average heel size purchased in the destination location as a function of the average heel size purchased in the origin location (a measure of personal preferences), ori-gin norms, and destination norms (Model 1), own preferences from the oriori-gin location (B= .20,SE= .02,t= 10.97,p<.001) and destination norms (B= .30,SE= .04,t= 7.23,p<.001) significantly predict own preferences in the destination location, while origin norms have no predictive power (B= .05,SE= .03,t= 1.58,p= .12). In other words, behavior in a new location demonstrates both consistency and conformity, balancing past behavior with the influence of new norms. Interestingly, origin norms, though not significant direct predictors of destination behavior, do operate indirectly via established individual preferences (seeS1 Appendixfor an explanation).
Moderation of Relocation Effects by Socioeconomic Status
People who move may demonstrate some level of conformity, but it may differ between moves to higher SES locations (i.e.,upward relocations) versus moves to lower SES locations (i.e.,
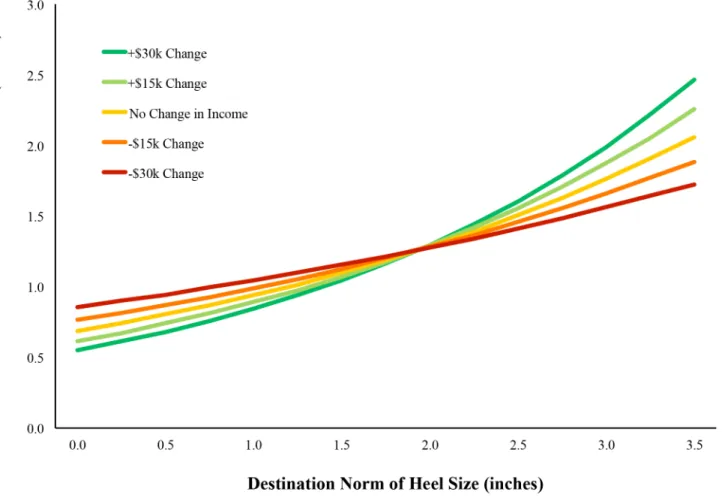
downward relocations). To test this, we computed a new variable—change in median income between origin and destination behavior—and tested whether this interacted with conformity level in the same mixed model (Model 3). As can be seen by the crossing lines inFig 1, the anal-ysis revealed a significant interaction (B= .005,SE= .002, t = 2.52,p= .01). Of note, to assure that the origin norms and origin behavior covariates do not bias our interaction estimate [20] we also test the interaction in Model 4 without these statistical controls. Doing so does not change our conclusion as the interaction term is of the same magnitude and still statistically significant (B= .005,SE= .002, t = 2.66,p= .007).
The influence of destination norms is largest when the change in median income between locations is large and positive, and smallest when the same change is large and negative. When an individual moves to a higher status location, their behavior strongly reflects the norms of that destination. However, when an individual moves to a lower (or similar) status location, they mostly do not assimilate to those new norms and instead remain relatively consistent in their preferences.
when moving to a new location with a median income that is $22,723lowerthan the origin location, the same beta coefficient is only .21, a sign of far less conformity to new norms.
Robustness checks
To test the robustness of the SES change by conformity interaction, we preform three checks. First (Model 5), we include a series of fixed effects controls: change in average MSRP of shoes across locations, change in population size across locations, change in % of women across locations, change in median age across locations, and change in number of years of education across locations. Even when including these controls, we observe a significant interaction between destination norms and change in median income between locations (B= .005,SE= .002, t = 2.61,p= .009).
Second, we change the nature of the norm variables to include averages across all previous transactions, not just those made in the previous 14 days (Model 6). Because this specification removes the benefit of seasonality being controlled for by the nature of how the norms vari-ables were computed, we include a new random effect of Month. This ensures that any varia-tions we observe cannot solely be attributed to seasonal differences. In Model 6, we still observe a significant interaction between destination norms and change in median income between locations (B= .011,SE= .004, t = 2.67,p= .007).
Fig 1. Heel-size purchase behavior across upward and downward relocations (each line represents a different change in median annual income). Estimates from full model (Model 4).
Finally, it is possible that customers who move often exert excessive influence on our model and so even with the customer and move number random effects controls, our results are driven by these unusual individuals (Model 7). We reran our analysis with only the first observed move from each individual (removing the customer and move number random effects as they are no longer needed). Doing so once again yields a significant interaction between destination norms and change in median income between locations (B= .006,SE= .002, t = 2.45,p= .01). In sum, regardless of model specification, upward relocations involve greater conformity to destination norms than downward relocations, which involve greater consistency with origin behavior. This is true even when controlling for location factors includ-ing MSRP of shoes purchased, population size, average age, gender ratio, and education level. To make this complex relationship a bit clearer, we include three illustrative examples inFig 2.
General Discussion
These findings provide a large-scale demonstration of how people balance conformity and con-sistency in new environments based on upward versus downward socioeconomic transitions.
Fig 2. Three select behaviors for illustration purposes (each trapezium is an individual move).
People adopt the fashion trends of higher status locations to a far greater extant than they do lower status locations. These results represent an empirical demonstration of long held theories in sociology and pervasive lay beliefs.
Despite the robustness and geographic scope of this dataset, many questions remain. One question is whether this preferential conformity reflects self-distancing from low status groups [21], self-identification with high status groups [22], or both. Another outstanding question for future research is whether such conformity is conscious or non-conscious [23,24]. Finally, recent work has demonstrated that conformity is more likely to occur when others explicitly express their preferences as compared to when they act on those preferences [25]. In the con-text of fashion, it seems more likely that the observed conformity occurred due to observation of norms, rather than conversations about preferences, suggesting that conformity is, indeed, influenced by observed preferences, at least in this one case. Future work is needed to better explain the inconsistency between our findings and those showing that conformity is less likely to occur when merely observing the preferences of others.
In addition to these questions, it is worth understanding whether status-dependent confor-mity effects emerge with other fashion choices, such as color, cut, or formality. Given the public nature of all such fashion choices, we suspect it would. In contrast, more private choices such as music or television selection may be less sensitive to conformity. Future research should examine the boundaries of trickle down preferences.
The non-experimental nature of the present work leaves open the possibility for alternative attributions for fashion choices. Although we included numerous control variables, it is possi-ble that some unobserved third variapossi-ble may help explain our results. Nevertheless, past experi-mental work provides converging evidence for our findings, as does recent network analyses. Our results are also sensitive to one other issue typically observed in these types of archival studies: reverse causation. However, it seems implausible that heel size is what drove relocation decisions rather than vice versa.
Conclusion
Every introduction to psychology textbook includes a section on Asch’s famous conformity experiments and how such behavior is nearly universal [26]. Likewise, textbooks discuss the universality of consistency and cognitive dissonance [27]. However, there are times at which these theories make conflicting predictions, such as when people relocate. Our data suggest that people balance these psychological demands based on a powerful extrinsic variable— socio-economic status—causing people to conform upward more than downward. In this way, people may be able to ratchet themselves up the social ladder, one heel at a time.
Supporting Information
S1 Appendix. Supplementary Mediation Analysis.
(DOCX)
S1 Fig. Histogram of Number of Transactions per Customer.
(DOCX)
S2 Fig. Histogram of Number of Moves per Customer.
(DOCX)
S1 Table. Correlation Matrix.
Author Contributions
Conceived and designed the experiments: JG KG IE NS. Performed the experiments: IE. Ana-lyzed the data: JG. Contributed reagents/materials/analysis tools: JG. Wrote the paper: JG KG NS.
References
1. Asch SE. Effects of group pressure upon the modification and distortion of judgments. Groups, Leader-ship and Men: Research in Human RElations. New York, NY: Russell and Russel; 1963.
2. Haney C, Banks W, Zimbardo P. The Stanford Prison Experiment: A simulation study of the psychology of imprisonment. International Journal of Ciminology and Penology. 1973; 1:69–97.
3. Aarts H, Dijksterhuis A, Custeres R. Automatic normative behavior in environments: The moderating role of conformity in activating situational norms. Social Cognition. 2003; 21(6):447–64.
4. Rappaport RA. Ritual and Religion in the Making of Humanity. Cambridge, UK: Cambridge University Press; 1999.
5. Schultz PW, Nolan JM, Cialdini RB, Goldstein NJ, Griskevicius V. The constructive, destructive, and reconstructive power of social norms. Psychological Science. 2007; 18(5):429–34. PMID:17576283
6. Smucker B, Creekmore AM. Adolescents’clothing conformity, awareness, and peer acceptance. Fam-ily and Consumer Sciences Research Journal. 1972; 1(2):92–7.
7. Lewis K, Gonzalez M, Kaufman J. Social selection and peer influence in an online social network. Pro-ceedings of the National Academy of Sciences. 2012; 3(1):68–72.
8. Adam H, Galinsky AD. Enclothed cognition. Journal of Experimental Social Psychology. 2012; 48 (4):918–25.
9. Chan C, Berger J, Boven LV. Identifiable but not identical: Combining social identity and uniqueness motives in choice. Journal of Consumer Research. 2012; 39(3):561–73.
10. Bourdieu P. La distinction: Critique sociale du jugement. Paris, France: Editions de Minuit; 1979.
11. Hollander EP. Conformity, status, and idiosyncrasy credit. Psychological Review. 1958; 65(2):117–27. PMID:13542706
12. Kraus MW, Mendes WB. Sartorial symbols of social class elicit class-consistent behavioral and physio-logical responses: A dyadic approach. Journal of Experimental Psychology: General. 2014; 143 (6):2330–40.
13. O'Cass A, McEwen H. Exploring consumer status and conspicuous consumption. Journal of Consumer Research. 2004; 4(1):25–39.
14. Tian KT, Bearden WO, Hunger GL. Consumers’Need for Uniqueness: Scale Development and Valida-tion. Journal of Consumer Research. 2001; 28(1):50–66.
15. Brewer MB. The social self: On being the same and different at the same time. Personality and Social Psychology Bulletin. 1991; 17:475–82.
16. Leonardelli GJ, Pickett CL, Berwer MB. ptimal distinctiveness theory: A framework for social identity, social cognition and intergroup relations. In: Zanna M, Olson J, editors. Advances in Experimental Social Psychology. 43: Elsevier; 2010. p. 65–115.
17. Veblen T. The leisure class: An economic study of institutions. New York, NY: MacMillian; 1912.
18. Gray K, Schmitt P, Strohminger N, Kassam KS. The science of style: In fashion, colors should match only moderately. PLOS ONE. 2014; 9(7):e102772. doi:10.1371/journal.pone.0102772PMID:25033079
19. Gilt Tech Blog [Internet]2015. [cited 2015]. Available: http://tech.gilt.com/post/101291680119/stilettos-by-state-a-gilt-infographic-while.
20. Yzerbyt VY, Muller D, Judd CM. Adjusting researchers’approach to adjustment: On the use of covari-ates when testing interactions. Journal of Experimental Social Psychology. 2003; 40(3):424–31.
21. Berger J, Heath C. Who drives divergence? Identity signaling, outgroup dissimilarity, and the abandon-ment of cultural tastes. Journal of Personality and Social Psychology. 2008; 95(3):593–607. doi:10. 1037/0022-3514.95.3.593PMID:18729697
22. Ellemers N, van Knippenberg A, De Vries N, Wilke H. Social identification and permeability of group boundaries. European Journal of Social Psychology. 1988; 18(6):497–513.
23. Berger J, Fitzsimons G. Dogs on the street, pumas on your feet: How cues in the environment influence product evaluation and choice. Journal of Marketing Research. 2008; 45(1):1–14.
25. Tu Y, Fishbach A. Words speak louder: Conforming to preferences more than actions. Journal of Per-sonality and Social Psychology. 2015; 109(2):193–209. doi:10.1037/pspa0000031PMID:26191960
26. Asch SE. Studies of independence and conformity: I. A minority of one against a unanimous majority. Psychological Monographs: General and Applied. 1956; 70(9):1–70.