AN EXPLORATORY ANALYSIS OF THE IMPACT OF SPORTS PROGRAMMING ON THE DEVELOPMENT OF SOCIAL EMOTIONAL COMPETENCIES
IN AT-RISK ELEMENTARY SCHOOL STUDENTS
Megan L. McVea
A dissertation submitted to the faculty at the University of North Carolina at Chapel Hill in partial fulfillment of the requirements for the degree of Doctor of Philosophy in School
Psychology in the School of Education.
Chapel Hill 2016
Approved by: Steven Knotek Rune Simeonsson Sandra Evarrs Pan Yi
ABSTRACT
Megan L. McVea: An Exploratory Analysis of the Impact of Sports Programming on the Development of Social Emotional Competencies in At-Risk Elementary School Students
(Under the direction of Steven Knotek)
The present study examined the effects of an after-school social emotional sports program on the development of social emotional competencies in at-risk elementary school students. The study also explored participants’ experiences in the program to inform the
development of future interventions. A paired t-test for dependent samples was used to analyze the effects of the intervention on social emotional development. A hierarchical multiple
regression was conducted to determine the best predictors of post intervention prosocial behavior. Mann-Whitney U tests were used to determine differences in program experience based on gender, grade level, and prior participation in the intervention. The results indicated that the intervention did not have a statistically significant impact on social emotional
development at the conclusion of the intervention. Ratings on a program survey, demographic variables, and pre-intervention social emotional competency scores significantly predicted post intervention prosocial behavior. No significant differences were found based on gender, grade level, or prior participation on what participants learned from the program. Significant
TABLE OF CONTENTS
LIST OF TABLES ... v
CHAPTER 1: INTRODUCTION ... 1
CHAPTER 2: REVIEW OF THE LITERATURE ... 4
Defining Social Emotional Development ... 4
Risk Factors ... 8
Protective Factors ... 14
Youth Development Programs ... 17
CHAPTER 3: RATIONALE FOR STUDY AND RESEARCH QUESTIONS ... 20
The Present Study ... 21
Research Questions ... 24
CHAPTER 4: METHOD ... 26
Design ... 26
Assessment Instruments ... 28
Participants ... 31
Ethical Considerations ... 32
Data Analysis ... 33
CHAPTER 5: RESULTS ... 34
APPENDIX ... 55
LIST OF TABLES
Table 1: CASEL Social Emotional Learning Competencies ... 4
Table 2: Description of SDQ Subscales... 28
Table 3: Alignment of SDQ Subscales and CASEL SEL Competency Areas ... 28
Table 4: Frequencies of age, grade, gender, and prior participation ... 30
Table 5: Summary statistics of analyzed variables ... 32
Table 6: Paired Samples T-Test ... 34
Table 7: Wilcoxon Signed-rank Test Statistics ... 35
Table 8: Correlation coefficient values between predictor variables and criterion variable ... 37
Table 9: Summary of hierarchical regression models predicting SDQ Post Prosocial... 38
Table 10: Differences in SPSLearned and SPSImportance based on gender ... 40
Table 11: Differences in SPSLearned and SPSImportance between grades 3 and 4 ... 42
Table 12: Differences in SPSLearned and SPSImportance between grades 3 and 5 ... 42
Table 13: Differences in SPSLearned and SPSImportance between grades 4 and 5 ... 43
CHAPTER 1: INTRODUCTION
The Center for Evidence-Based Practice (2004) disturbingly reported, “Early appearing behavioral problems during a child’s preschool years are the single best predictors of school dropout, delinquency, gang membership, and adult incarceration” (p.1). Deficits in social emotional competency are associated with poor outcomes as children and adolescents develop. Social emotional incompetence predicts later deficits in social emotional development, such as insecure attachment, angry emotion, inability to regulate affect, inability to cope, and a stunted ability to understand and recognize emotions (Denham, Blair, Schmidt & DeMulder, 2002). Kindergarten teachers report being more concerned with children’s social emotional and behavioral deficits than they are with children’s cognitive delays (Rimm-Kaufman, Pianta, & Cox, 2000). Furthermore, a delay in social emotional learning is a risk factor for the emergence of behavior problems and psychopathology (Carter, Briggs-Gowan & Davis, 2004; Cicchetti & Cohen, 1995; Denham & Holt, 1993). Denham (2001) refers to children’s emotional
competence as being the fundamental support for developing social competence and posits that a lack of social competence can endorse spiraling difficulties.
success. Another study posits that social emotional skills are necessary to support school readiness (Denham, 2006). Further, several other researchers have argued that it is possible to improve academic achievement by improving children’s levels of social-emotional competence (Payton et al., 2000; Ashdown & Bernard, 2012). Even more, several studies (e.g., McNeely, Nonnemaker, & Blum, 2002; Osterman, 2000) show that social emotional learning enhances students’ connectedness to school.
In addition to supporting academic success, social emotional learning (SEL) also has implications in other areas of a child’s development. Nissen and Hawkins (2010) cite early emotional competence, including emotional regulation, expression, and knowledge, as being strongly linked to children’s mental health and social interactions. Successful peer interactions have been shown to be a predictor of ongoing mental health (Denham, 2001). Social emotional competence is also related to prosocial behavior, fewer anger reactions, and the ability to explain emotions (Denham, 2001). In fact, teaching empathy was shown to be helpful in remedial programs designed to treat aggression and antisocial attitudes in youth (Robinson, Roberts, Strayer & Koopman, 2007).
The proposed study will explore the effectiveness of a sports based social emotional learning intervention on the social emotional development of an at-risk population of elementary school students attending school in an urban school district. Unlike many previous studies investigating the impact of social emotional interventions on school age populations, this proposed investigation focuses on how sports based programming, rather than academic based programming, provides a supportive environment for developing social emotional competency. There is a significant need for research on this topic to contribute to the development of
CHAPTER 2: REVIEW OF THE LITERATURE Defining Social Emotional Development
According to CASEL, social-emotional learning (SEL) is “the process through which children and adults acquire and effectively apply the knowledge, attitudes and skills necessary to understand and manage emotions, set and achieve positive goals, feel and show empathy for others, establish and maintain positive relationships, and make responsible decisions” (CASEL, 2014). These skills are critical for becoming a good citizen and student, and can decrease risky behaviors and promote positive outcomes (CASEL, 2013). CASEL has identified five
competency areas that are the focus of SEL curriculum (see Table 1).
Table 1: CASEL Social Emotional Learning Competencies
CASEL SEL COMPETENCY AREA Description
Self Awareness The ability to accurately recognize one’s emotions and thoughts and their influence on behavior. This includes accurately assessing one’s strengths and limitations and possessing a well-grounded sense of confidence and optimism.
Self-Management The ability to regulate one’s emotions, thoughts, and behaviors effectively in different situations. This includes managing stress, controlling impulses, motivating oneself, and setting and working toward achieving personal and academic goals.
social and ethical norms for behavior, and to recognize family, school, and
community resources and supports. Relationship Skills The ability to establish and maintain
healthy and rewarding relationships with diverse individuals and groups. This includes communicating clearly, listening actively, cooperating, resisting
inappropriate social pressure, negotiating conflict constructively, and seeking and offering help when needed.
Responsible Decision Making The ability to make constructive and respectful choices about personal behavior and social interactions based on
consideration of ethical standards, safety concerns, social norms, the realistic evaluation of consequences of various actions, and the well-being of self and others.
Development of these competency clusters in children improves student positive behavior and reduces negative behavior, prepares adolescents for success in adulthood, and improves student achievement and attitudes toward school (CASEL, 2014). For the purposes of this study, the CASEL definition of social emotional learning will be used, and the terms “social emotional learning” and “social emotional development” will be used interchangeably. Social emotional competencies will refer to the social emotional skills that are acquired during social emotional learning/development
Self-Awareness
component of social emotional learning and provides the foundation for building additional social emotional competencies.
Self-awareness includes awareness of feelings, management of feelings, constructive sense of self and perspective taking. An individual who is self-aware is able to correctly name and distinguish among a variety of emotions, such as understanding how anger is different from sadness. The self-aware individual also understands the range of emotions and can differentiate between situations that would cause rise to different emotions. Furthermore, a self-aware person is able to identify the thoughts associated with certain feelings. They can then connect those feelings to their physical state.
Self-Management
Self-management is the ability to monitor and regulate emotions and is often referred to as self-regulation. It includes the capacity to moderate negative feelings, to inhibit negative actions, control impulsive behaviors, and comfort oneself (Payton et al., 2000). CASEL defines self-management as the ability to regulate one’s emotions, thoughts, and behaviors effectively in different situations. Self-management includes managing stress, controlling impulses,
motivating oneself, and setting and working toward achieving personal and academic goals. Hofmann, Schmeichel, and Baddeley (2012) posit that self-regulation is comprised of three main components: standards of thought, feeling, or behavior that individuals endorse, mentally represent, and monitor; sufficient motivation to invest effort into reducing discrepancies between standards and actual states; and sufficient capacity to achieve this (i.e. reduce the
2009). Payton and colleagues (2000) summarize the important of awareness and self-management:
Being able to identify and regulate one’s feelings in adaptive ways also contributes to the promotion of a constructive sense of self…Knowledge of personal feelings, strengths, and areas in which one might want or need to improve, along with self-regulation of impulses and actions, are critical to developing a sense of confidence and optimism that one will be able to meet the challenges of everyday life now and in the future (p. 182).
Social Awareness
Social situations require that young people extend their awareness and understanding of feelings to others (Payton et al., 2000). Social awareness is defined as the ability to take the perspective of and empathize with others from diverse backgrounds and cultures, to understand social and ethical norms for behavior (i.e., social competence) and to recognize family, school, and community resources and supports (CASEL, 2014). Recognizing the feelings and taking the perspectives of others help predict how one might act in a given situation and guide one’s own behavior in response to situations (Payton et al., 2000). Social competence is an essential component of social awareness. Socially competent behavior strongly influences social acceptance (McKown et al., 2009). Socially competent behavior is defined as cooperative, assertive, socially appropriate behavior, and skillfully participating in group activities (Newcomb, Bukowski, & Pattee, 1993).
Relationship Skills
listening actively, cooperating with others, resisting inappropriate social pressure, negotiating conflict constructively, and seeking and offering help when needed (CASEL, 2014). In Payton and colleagues’ article (2000), they use the term “social interaction skills” to refer to this skill set. They identified six sub skills, including active listening (i.e., the capacity to attend to others both verbally and non-verbally to demonstrate to them that they have been understood),
expressive communication (i.e., the capacity to initiate and maintain conversations and to clearly express one’s thoughts and feelings both verbally and non-verbally), cooperation (i.e., the
capacity to take turns and share in both pairs and group situations), negotiation (i.e., the capacity to consider all perspectives involved in a conflict in order to resolve the conflict peacefully and to the satisfaction of all involved), refusal (i.e., the capacity to make and follow through with clear “NO” statements, to avoid situations in which one might be pressures, and to delay acting in pressure situations until adequately prepared), and help seeking (i.e., the capacity to identify the need for support and assistance and to access available and appropriate resources).
Risk Factors
Low Socioeconomic Status
There are certain risk factors associated with poor social emotional development in children and adolescents. Adolescents living in low socioeconomic neighborhoods face a
disparities (DeBose,1999). According to the National Center for Children in Poverty, families who are considered “poor” are those who live below the poverty threshold. In 2013, the federal poverty level for a family of four with two children was $23,624. In 2013, approximately 19% of children lived in poor families in the United States. Families are considered “low-income” if the family income is less than twice the poverty threshold. In 2013, approximately 41% of children lived in low-income families in the United States (Jiang, Ekono, & Skinner, 2015). These children engage in more risky behaviors during adolescence; they are more likely to have sex before age 16, become a member of a gang, attack someone or get in a fight, and run away. Approximately 29% of youth from low-income families do not graduate from high school and only one in ten graduate from a four-year university. Even more, one in five adolescents from low-income families are charged with an adult crime by the age of 24 (Kent, 2009).
Students who live in impoverished areas also face specific problems within the context of their educational settings. Many families who live in low-income areas are less likely to have financial resources to support their children academically, and might not be able to afford
resources such as books, computers, or tutors to help support academic achievement (Orr, 2003). In one nationwide study of kindergarten children, only 36% of children in the low-income group were read to on a daily-basis (Coley, 2002). Aikens and Barbarin (2008) found that children from low socio-economic families are at risk for reading difficulties. They acquire language skills at a slower rate and demonstrate delayed progress in the areas of letter recognition and phonological awareness (Aikens & Barbarin, 2008). In one study, the students with low socio-economic status entered high school 3.3 grade levels behind students from higher sociosocio-economic status schools (Palardy, 2008). A lack of resources in urban schools perpetuates low student achievement, increased school failures and subsequent dropouts (Browning, Leventhal, & Brooks-Gunn, 2005). Lack of resources stifle the home-school connection and disrupts parental involvement in the schooling process more than it does for affluent peers (Cooper & Cresnoe, 2007).
Students attending urban schools enter with varied backgrounds and ability levels, but often share community-specific stressors that stifle high academic achievement (Ahram, Stembridge, Fergus, & Noguera, n.d).
Community Violence Exposure
Students in urban settings have a history of being chronically exposed to violence in their neighborhoods (Osofsky, Wewers, Hann & Fick, 1993). A 1989 survey of mothers living in Chicago’s public housing reported that their children had witnessed a shooting by the age of five (Dubrow & Garbarion, 1989). A 1992 study in Baltimore, Maryland found that 42% of the surveyed youth reported witnessing a shooting, 25% reported witnessing a stabbing, and 33% reported witnessing an assault with a weapon (Gladstein, Rusonis & Heald, 1992). A survey by Bell and Jenkins (1993) found that a group of 10-19 year olds living in an impoverished
neighborhood reported similar shocking results – 39% reported that they had witnessed a shooting, 11% reported that they had been shot at, and 3% reported that they had actually been shot. Even more, Taylor and colleagues (1994) found that, of the surveyed parents with 1-5 year olds attending Boston City Hospital, 47% reported that their children had heard gunshots and 10% reported that their children had already witnessed a shooting or stabbing. One study indicates that 74% of sampled students reported feeling unsafe in their urban environments (Schwab-Stone et al., 1995). In a 2003 study, Youngstrom and colleagues found that of the 320 youth in their study, only 11 reported that they had not been exposed to violence. The median student reported six past exposures to violence and almost half of the youth reported past personal violent victimization (Youngstrom, Weist & Albus, 2003).
found adolescents who are chronically exposed to community violence are often anxious about unknown or impending violent acts. Their results also demonstrate that youth who are exposed to community violence exhibit more internalizing than externalizing disorders, and that
community violence exposure in youth are linked to anxiety symptoms and disorders. In the study, male adolescents reported more exposure to violence than female adolescents, but results showed that highly exposed female adolescents might be the most at-risk for internalizing behaviors.
Mazza & Reynolds (1999) found that post-traumatic stress disorder symptomatology showed a significant and direct relationship with exposure to violence. They also found that depression and suicidal ideation likely have an indirect association with exposure to violence. In another study, exposure to violence was significantly associated with twice the likelihood of suicidal ideation, four times the likelihood of suicide attempts, and twice the likelihood of alcohol abuse (Pastore, Fisher & Friedman, 1996). In the same study, researchers found that the students who were at an increased risk for mental health problems were those who reported having known someone who was murdered or witnessed a stabbing or shooting.
Family Dynamics
1998). Wang and colleagues (2010) found that gender, perceived father’s risk behavior,
perceived mother’s risk behavior, and interaction of health self-efficacy and perceived peers’ risk behavior were all statistically significant explanatory variables of adolescent risk behaviors.
Parent mental health also serves as risk factors for a child’s development. Individuals who experience depression often have deficits in emotion regulation and may not have all of the needed skills to model, teach, and reinforce adaptive ways of modulating distress (Gross & Muñoz, 1995; Morris et al., 2007). Other studies have demonstrated that depressed mothers display atypical affective interaction patterns with their children (Gotlib & Goodman, 1999) and have been shown to be less responsive to their children’s emotional states, less likely to match their children’s affect, and to display more anger and sadness and less positive affect than non-depressed mothers (e.g. Field, Healy, Goldstein, & Guthertz, 1990; Hops et al., 1987;Weinberg &Tronick, 1998). Eisenberg and colleagues’ (2001) work supported maternal expressivity as a predictor of children’s behavior. Their findings were consistent with previous data
demonstratingthat maternal expressivity affectschildren's regulation and social functioning. In summary, there are many risk factors that impede an individual’s ability to develop social emotional competencies. The literature cites an abundance of potential risk factors for poor or delayed social emotional development, many of them associated with living in an urban area. Children living in low-income areas may face risk factors including poverty, community violence exposure, lack of resources in schools and the community, familial stressors, decreased availability of mental health care, and an increased likelihood of developing mental illness.
Protective Factors
There are certain factors that promote development and learning even against the
that function as a buffer to mitigate risk and increase adolescent well-being (“Protective Factors,” 2013). In their study, Luthar and colleagues (2000) described the way in which a protective factor might interact with a risk factor, terming that interaction “the protective-stabilizing interaction,” which they define as a pattern in which the risk factor’s relationship to symptoms is less when high levels of the protective factor are present (Luthar at al., 2000). Resilience is the complex phenomenon that focuses on protective factors, contributing to positive outcomes despite the presence of risk (Short & Russell-Mayhew, 2009). Richardson defines resiliency as “the process of coping with adversity, change, or opportunity in a manner that results in the identification, fortification, and enrichment of resilient qualities or protective factors” (Richardson, 2002, p. 308).
Internal Protective Factors
A study examining risk and protective factors for African American youth, found that individual confidence served as a protective factor when poverty was examined as a risk factor (Li, Nussbaum & Richards, 2007). This is consistent with a study by Youngstrom and
colleagues (2003) that found self-concept moderated the effects of risk on externalizing and internalizing behaviors. LeBlanc and colleagues (2011) found that problem-solving skills served as a moderator of the psychological distress associated with violence exposure in adolescents. When levels of violence exposure in the school or neighborhood were high, better
behavior to be statistically significant predictors of adolescent risk behaviors. Furthermore, they discovered health self-efficacy and emotional regulation moderated the negative effects of peers’ perceived risk behavior on risk behaviors (Wang, Hsu, Lin, Cheng, & Lee, 2010).
Jessor and colleagues (1995) studied the relation of psychosocial protective factors and involvement in problem behavior. They explored seven protective variables, including positive orientation to school, positive orientation to health, intolerant attitudes toward deviance, positive relations with adults, perception of strong social controls or sanctions for transgression,
awareness of friends who model conventional behavior, and involvement in prosocial behaviors. The results suggested that these factors appear to play an important role in both the etiology and developmental trajectory of adolescent problem behavior (Jessor, Van Den Bos, Vanderryn, Costa & Turbin, 1995).
External Protective Factors
Li and colleagues’ (2007) work demonstrated that family support and helpfulness of a family were protective factors. Two protective factors related to connectedness were also found in Cleveland and colleagues’ (2003) study – having a positive relationship with one’s mother and feeling a sense of attachment to your school. Furthermore, Baker’s study (2013) found that fathers’ home literacy involvement was predictive of two domains of social emotional
development (i.e., increased attention and fewer negative behaviors) and mothers’ home literacy involvement was predictive of three domains of social emotional development (i.e., increased engagement, attention, and fewer negative behaviors). Social emotional competencies also help students with disabilities navigate the challenges of the schooling years (Darrow, 2014).
They promote self-confidence, problem-solving, and relationship skills and help mitigate the potential detrimental outcomes associated with risk factors.
Youth Development Programs
Youth development programs, including sports, are by their nature embedded with protective factors. Youth development programs promote physical and psychological safety, appropriate structure, supportive relationships, opportunities to belong, positive social norms, support for efficacy and mattering, opportunities for skill building, and integration of family, school, and community efforts (Eccles & Gootman, 2002). These features provide opportunity for adolescents to develop physically, intellectually, psychologically, and socially (Eccles & Gootman, 2002).
A study by Catalano and colleagues (2004) summarized the findings of 25 effective youth development programs and described the characteristics of those programs. All of the programs addressed a minimum of five of fifteen protective factors and social emotional competencies—bonding; resilience; social, emotional, cognitive, behavioral, and moral
behavior (Catalano, 2004).
A longitudinal study found that the more involvement an adolescent has in such a
program, the greater the likelihood of achieving a healthy adulthood as measured by high school graduation, college attendance, employment, and lack of involvement with the criminal justice system. The study explored the correlation between the degree of involvement in a youth development program and six surveyed areas. Three of the surveyed areas (i.e., education, employment, and criminal justice) showed statistical significance and two of the areas (i.e., pregnancy/parenthood, illicit drug use) demonstrated a positive trend (Meltzer, Fitzgibbon, Leahy, & Petsko, 2006).
A meta-analysis by Durlak and colleagues (2011) explored the findings of 213 school-based, universal social emotional learning (SEL) programs. They found that these programs had significant positive effects on social-emotional competencies, increased prosocial behavior, reduced conduct and internalizing problems, and improved academic performance on grades and achievement tests. In fact, they found that these programs boosted academic achievement by 11 percentile points. Other promising results of the meta-analysis demonstrate that teachers and other school staff effectively implemented the SEL programs; in fact, SEL interventions were successfully incorporated into teachers’ routine educational practices. Moreover, the SEL programs examined in the meta-analysis were successful at the elementary, middle, and high school levels and in urban, rural, and suburban schools.
CHAPTER 3: RATIONALE FOR STUDY AND RESEARCH QUESTIONS
With the expansive list of risk factors to which children are exposed in urban settings, it seems obvious that researchers would devote time to explore the protective factors that can mitigate those risks. The risk factors contribute to inequity in adult outcomes between children living in poverty and their more affluent peers. Protective factors are linked to positive outcomes and serve as a buffer to lessen the impact of risks. There is a substantial body of research that demonstrates the effectiveness of SEL interventions for a wide range of children. According to Durlak and colleagues’ meta-analysis, SEL interventions are routinely incorporated into
for adolescents to develop social and interpersonal skills (Rutten et al. 2007; Donaldson and Ronan 2006; Gardner, Roth, and Brooks-Gunn 2009). After-school sports programming provides a safe and supervised environment for students who might otherwise face significant risks in the environments they return to after school (Knotek & Pollack, 2014). Fraser-Thomas and colleagues (2005) highlight the benefits of organized youth sports, including a better quality of life and the development of numerous social skills.
Few studies, however, have explored the idea of embedding SEL curriculum into sports programs. Stoiber (2011) lists certain factors that have traditionally impeded school-based SEL implementation: schools do not always implement interventions with fidelity because they can be chaotic and lack the amount or type of resources necessary to follow through with the
intervention; there is limited availability and accessibility of reliable and accurate measures of effectiveness; schools are imbued with extraneous factors that can impact the intervention; and social-behavioral outcomes are hard to measure accurately and reliably. Though all of these factors certainly would affect SEL implementation within the school day, after-school programs would not face the same challenges.
The Present Study
sustainable sports programming that improves the quality of life for under served youth in Chicago and at-risk communities” (About World Sport Chicago, 2014). With community and funding partners, World Sport Chicago creates and implements programs that teach character development, engage families and communities, direct resources to communities, share practices and innovations, and advocate for all kids regardless of abilities (“About World Sport Chicago”, 2014).
Academy for Urban School Leadership (AUSL) is a Chicago nonprofit that was founded in 2001. It is a school management organization that creates schools of excellence by developing highly effective teachers and transforming educational outcomes for students in the lowest performing schools. Currently, AUSL manages 32 Chicago Public Schools serving more than 18,000 students. Hallmarks of AUSL managed schools are steady, positive improvements in academic achievement, student engagement, and parent satisfaction. AUSL turnaround elementary schools, on average, have outpaced the Chicago Public School district growth in ISAT meets/exceeds gains every year since 2008 (“About AUSL,” 2015).
The PLAYS (i.e., Play Learn Achieve Youth Succeed) pilot program was developed to support at risk students’ development of social emotional skills including grit, resiliency, and the core social emotional competencies outlined by Collaborative for Academic, Social, and
psychoeducational process, this intervention was manualized, had a formal schedule (e.g., check-in, instruction, problem-solving and debrief), and included explicit instruction, supervised practice, and facilitative questioning by the coaches (Knotek & Pollack, 2014).
The Chicago Fire Foundation developed the soccer portion of the curriculum. While a variety of skills were practiced at every session, each week had a distinct skill such as passing and touch (week 1), turning the ball (week 3) and team shape and spacing (week 10). SEL components of the curriculum systematically embedded grit (i.e., perseverance and passion for long-term goals) and CASEL core competencies into the sessions (Duckworth, Peterson, Matthews, and Kelly 2007). The grit constructs are connectedness/teamwork; self-awareness and desire to achieve; motivation, passion and movement towards goals; perseverance; and resilience. CASEL core competencies are self-management, self-awareness, responsible decision-making, social awareness and relationship skills. Similar to the soccer components of the curriculum, each week had a social-emotional theme that was explicitly taught and integrated into each of a week’s three sessions (Knotek & Pollack, 2014).
introduced and then they were recursively worked through again during the second half of the program (Knotek & Pollack, 2014).
The third year of program implementation began in March of 2015 at twelve AUSL elementary schools. The intended learning outcomes of the curriculum included both social emotional competencies and soccer skills. Each of the ten weeks of the program had an SEL component and a soccer component. For example, week one’s SEL component was Self-Awareness and the soccer component was dribbling. All of the practices followed a specified structure, and the coaches were provided with a program binder that included a detailed explanation of both the soccer portion and the SEL portion for every practice. A detailed description of the curriculum and intervention is located in the appendix.
Research Questions
The purpose of the current study is to explore the impact of SEL sports programming on the development of social emotional competencies in at-risk elementary school students. The following research questions will guide this study:
1. Does participation in the PLAYS intervention impact participants’ social emotional development?
a. Based on SDQPostTotal? b. Based on SDQPostProsocial?
2. What elements of participants’ demographics and experiences in the program predict social emotional development?
3. Are there differences in participants’ experiences in the program? a. Based on gender?
CHAPTER 4: METHOD
Design
One group pre- and post-test design was used to answer questions regarding the impact of participation in the PLAYS program and social emotional development in a sample of
elementary aged children attending school in low socioeconomic neighborhoods. The pre and post total scores on the Strengths and Difficulties questionnaire (i.e., SDQ; a brief measure of social emotional development) were compared to answer the following question: Does
participation in the PLAYS intervention impact participants’ social emotional development as evidenced by a decrease in total score (i.e., the higher the total score, the more problematic behaviors indicated) on the Strengths and Difficulties Questionnaire (SDQ)? The pre and post prosocial scores on the SDQ were compared to answer the following question: Does
participation in the PLAYS intervention impact participants’ social emotional development as evidenced by an increase in post prosocial score (i.e., the higher the score, the more positive behaviors indicated) on the SDQ? The relationship between participant demographics, SDQ pre Total score, the results of the Student Program Survey (i.e., SPS; a survey of participants’ experiences in the program), and post prosocial scores on the SDQ were examined to answer the following question: Based on the Student Program Survey results, what demographics and elements of participants’ experiences in the program predict social emotional development? The relationship between the results of the SPS and age, gender, and prior participation in the
Hypothesized outcomes were as follows:
1a. Participation in the PLAYS intervention will significantly impact
participants’ social emotional development, as evidenced by lower post-test SDQ total scores than pre-test.
1b. Participation in the PLAYS intervention will significantly impact
participants’ social emotional development, as evidenced by higher post-test SDQ prosocial scores than pre-test.
2. Ratings on the Student Program Survey (SPS), age, gender, SDQ pre total score and prior participation will predict post prosocial behaviors.
3a. There will be differences in SPS Learned and SPS Importance scores based on gender.
3b. There will be differences in participants’ SPS Learned and SPS Importance scores based on grade level.
3c. There will be differences in participants’ SPS Learned and SPS Importance scores based on prior participation in the program.
Assessment Instruments
It is important to note that available measures of social emotional development are varied in their terminology and focus on a range of social emotional constructs. Every instrument defines social and emotional constructs in its own unique way. The terms “social emotional learning (also referred to as SEL),” and “social emotional development” are often used
Social emotional development measures also come from a variety of frameworks,
including youth developmental assets and mental health, though this study focuses on youth risk and protective factors framework. The PLAYS curriculum was designed around the
Collaborative for Academic, Social, and Emotional Learning (CASEL) constructs and does not necessarily directly align with the terminology of the measure used in this study. The first four of the CASEL competency areas (i.e., self awareness, self management, social awareness, and relationship skills) will be measured in this study by the Strengths and Difficulties Questionnaire (SDQ).
Strengths and Difficulties Questionnaire
The Strengths and Difficulties Questionnaire (SDQ) is a brief social emotional questionnaire for children and adolescents ages 2 through 17. It was developed in the United Kingdom but has since been validated for use in the United States (Bourdon, Goodman, Rae, Simpson, Koretz (2005). The results indicated good acceptability and internal consistency, and normative scoring bands were similar, though not identical, to the original British bands. Goodman (2001)
SDQ with a brief description of each and Table 3 shows the alignment of the SDQ subscales with the CASEL SEL competencies.
Table 3: Alignment of SDQ Subscales and CASEL SEL Competency Areas
CASEL SEL Competency Area
SDQ Subscale Description of Subscale Self Awareness
Emotional Symptoms Does the child exhibit internalizing behaviors? Does the child understand different emotions?
Self-Management Conduct Problems
Hyperactivity/Inattention
Does the child have anger problems? Does the child lie, cheat, steal, or fight? Does the child think before acting? Social Awareness
Prosocial Behavior Is the child considerate of other people? Does the child understand social norms? Relationship Skills
Peer Relationship Problems Is the child able to establish and maintain friendships?
Table 2: Description of SDQ Subscales
Subscale Description
Emotional Symptoms How do children perceive their emotions? Conduct Problems How do children conduct themselves? Hyperactivity/Inattention How well do children regulate their
decision-making and behavior?
Peer Relationship Problems How well can the child establish and maintain friendships?
Student Program Survey
The Student Program Survey (SPS) is a self-report questionnaire developed specifically for the PLAYS program. The questionnaire has two scales – SPS Learned and SPS Importance – that give the participants the opportunity to rate their experience in the program. The SPS
Learned scale is composed of a sentence stem (i.e., Playing soccer in the PLAYS program taught me…) with ten accompanying statements about what the students may have learned during the duration of the program (e.g., … to work as part of a team). The students rated each item on five point lickert type scale ranging from Not At All True to Very Much True. The SPS Importance scale is composed of a sentence stem (i.e., When you played in the PLAYS soccer program, how important was…) with ten accompanying statements about what the students may have found important during the duration of the program (e.g., …making new friends). The students rated each item on five point lickert type scale ranging from Really Not Important to Really Important. A copy of the Student Program Survey is located in the appendix.
Participants
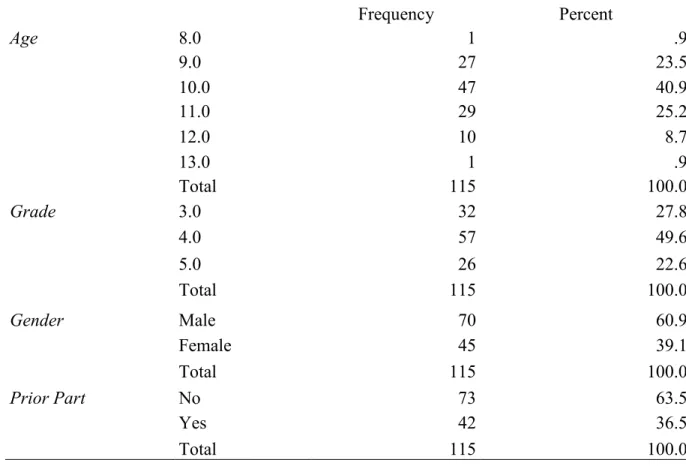
Student Program Survey, therefore their data were not used in the analyses. The total sample includes 115 participants from 8 different schools. Participant data is displayed in Table 4.
Table 4: Frequencies of Age, Grade, Gender, and Prior Participation
Frequency Percent
Age 8.0 1 .9
9.0 27 23.5
10.0 47 40.9
11.0 29 25.2
12.0 10 8.7
13.0 1 .9
Total 115 100.0
Grade 3.0 32 27.8
4.0 57 49.6
5.0 26 22.6
Total 115 100.0
Gender Male 70 60.9
Female 45 39.1
Total 115 100.0
Prior Part No 73 63.5
Yes 42 36.5
Total 115 100.0
Ethical Considerations
Data Analysis
The Odum Institute and committee members provided statistical consultation for data analysis. Data analyses were conducted using SPSS software package.
Preliminary Analysis
Preliminary analysis included an examination of descriptive information on all variables to assess their distributions. For categorical data (age, gender, grade, and prior participation), frequency data were calculated. Each of the dependent variables (SDQ scores and program survey results) contained continuous data. Preliminary analysis for continuous data included measurements of central tendency, variability, skewness, and kurtosis.
Primary Analysis
CHAPTER 5: RESULTS
Statistical analyses were conducted using the SPSS version 22 statistical software package to determine the effects of the PLAYS program on the participants’ social emotional competency, determine any differences in participants’ experiences in the program, and
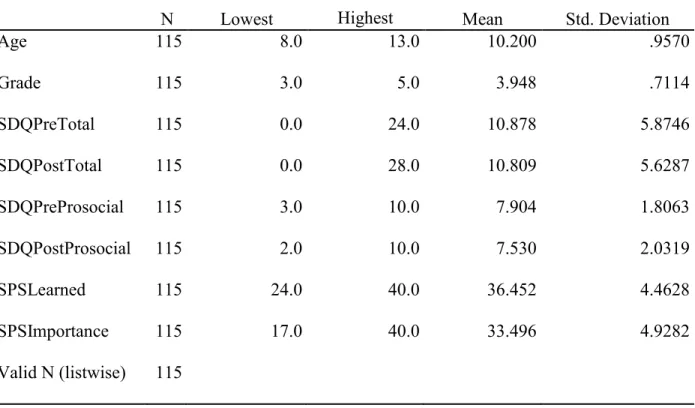
determine what elements predict social emotional development. Data entry was double-checked by committee members and was then screened for missing items. The data were also screened for errors in scoring and coding, normality, multicollinearity, and outliers. Summary statistics for analyzed variables are presented in Table 5.
Table 5: Summary statistics of analyzed variables
N Lowest Highest Mean Std. Deviation
Age 115 8.0 13.0 10.200 .9570
Grade 115 3.0 5.0 3.948 .7114
SDQPreTotal 115 0.0 24.0 10.878 5.8746
SDQPostTotal 115 0.0 28.0 10.809 5.6287
SDQPreProsocial 115 3.0 10.0 7.904 1.8063
SDQPostProsocial 115 2.0 10.0 7.530 2.0319
SPSLearned 115 24.0 40.0 36.452 4.4628
SPSImportance 115 17.0 40.0 33.496 4.9282
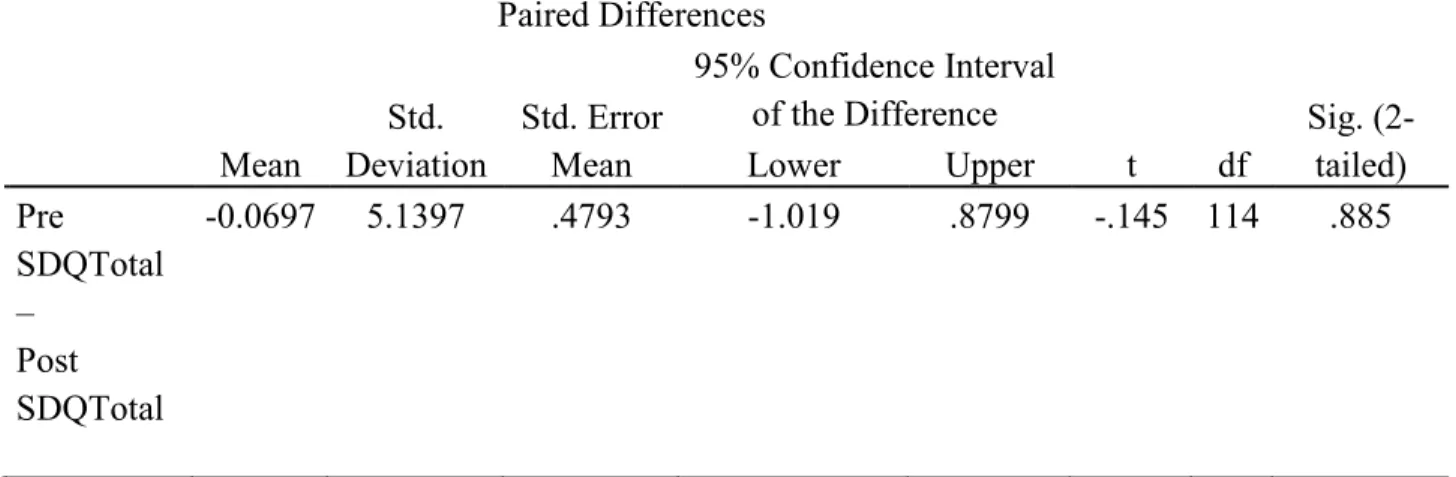
Hypothesis 1a: Participation in the PLAYS intervention program will result in a significant
decrease in Total score on the SDQ, a measure of participants’ social emotional development.
All variables (SDQ pre and post Total scores) were checked for violations of the assumptions of the paired t-test. Eight outliers were detected (i.e., among difference scores between SDQ pre and SDQ post total scores) that were more than 1.5 box-lengths from the edge
of the box in a boxplot. The paired t test for dependent samples was conducted comparing pre
and post scores both with and without the outliers, and the results were not affected. As such,
the outliers were kept in the analysis. The difference scores for the SDQ pre total scores and
SDQ post total scores were normally distributed, as assessed by Shapiro-Wilk's test (p = .058).
Table 6: Paired Samples T-Test
Paired Differences
t df
Sig. (2-tailed) Mean
Std. Deviation
Std. Error Mean
95% Confidence Interval of the Difference Lower Upper Pre
SDQTotal –
Post SDQTotal
-0.0697 5.1397 .4793 -1.019 .8799 -.145 114 .885
Hypothesis 1b: Participation in the PLAYS intervention program will result in a significant
increase in Prosocial score on the SDQ, a measure of participants’ social emotional
development.
All variables (SDQ pre and post Prosocial scores) were checked for violations of the assumptions of the paired t-test. Two outliers were detected (i.e., among difference scores between SDQ pre and SDQ post Prosocial scores) that were more than 1.5 box-lengths from the
edge of the box in a boxplot. Inspection of their values did not reveal them to be extreme and
they were kept in the analysis. The difference score between SDQ pre prosocial and SDQ post
prosocial were not normally distributed, as assessed by Shapiro-Wilk's test (p < .05).
Table 7: Wilcoxon Signed-rank Test Statistics
SDQPreProsocial - SDQPostProsocial
Z -1.848b
Asymp. Sig. (2-tailed) .065
a. Wilcoxon Signed Ranks Test b. Based on positive ranks.
Hypothesis 2: Ratings on the Student Program Survey (SPS), age, gender, prior participation,
and SDQ Pre Total scores will significantly predict post prosocial behaviors.
All variables (post Prosocial score, SPS Learned score, SPS Importance score, age, gender, prior participation, and SDQ Pre Total) were checked for violations of the assumptions for hierarchical regression analysis. There was independence of residuals, as assessed by a Durbin-Watson statistic of 2.046. A correlation greater than 0.7 was found between age and grade, thus grade was removed from the model. An analysis of studentized deleted residuals, leverage values, and Cook’s Distance values revealed only one noteworthy case. The case had a leverage value of .51 but was left in the analysis, as it was not considered a highly influential case as determined by Cook’s Distance. The visual analysis of the normal P-P plot and
histogram revealed an approximately normal distribution, thus parametric statistics were deemed appropriate for the data.
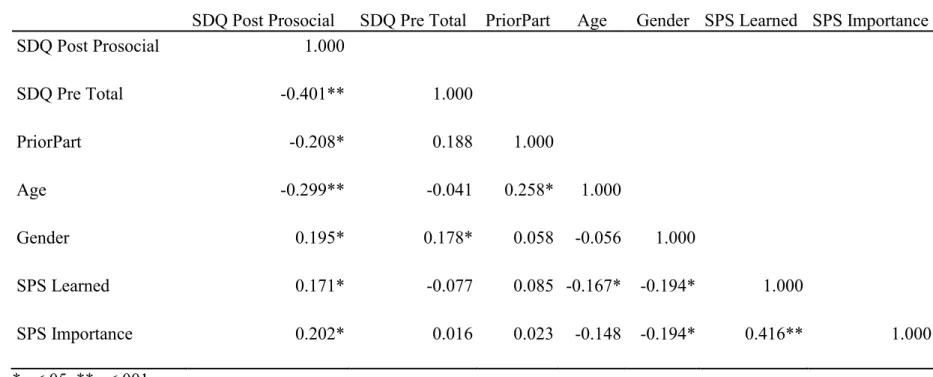
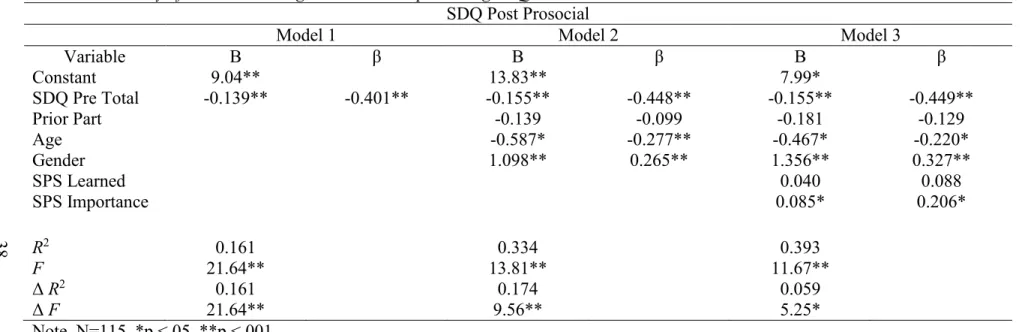
A hierarchical multiple regression was conducted to determine the best predictors of post
intervention prosocial behavior. Correlations between predictor variables and the outcome
measure are listed in Table 4. Three models were tested with SDQ Pre Total scores as Model 1.
increase in R2 of .174, F(3, 110) = 9.563, p < .001. The addition of scores on SPS Learned and
SPS Importance (Model 3) also led to a statistically significant increase in R2 of .059, F(2, 108) =
5.251, p < .05. The full model (Model 3) of SDQ pre total scores, prior participation, age,
gender, grade, SPS Learned score, and SPS Importance score was statistically significant, R2 =
.393, F (6, 108) =11.671, p < .001; adjusted R2=.360. Results for these analyses are found in
3
7
Table 8: Correlation coefficient values between predictor variables and criterion variable
SDQ Post Prosocial SDQ Pre Total PriorPart Age Gender SPS Learned SPS Importance
SDQ Post Prosocial 1.000
SDQ Pre Total -0.401** 1.000
PriorPart -0.208* 0.188 1.000
Age -0.299** -0.041 0.258* 1.000
Gender 0.195* 0.178* 0.058 -0.056 1.000
SPS Learned 0.171* -0.077 0.085 -0.167* -0.194* 1.000
SPS Importance 0.202* 0.016 0.023 -0.148 -0.194* 0.416** 1.000
3
8
Table 9: Summary of hierarchical regression models predicting SDQ Post Prosocial
SDQ Post Prosocial
Model 1 Model 2 Model 3
Variable B β B β B β
Constant 9.04** 13.83** 7.99*
SDQ Pre Total -0.139** -0.401** -0.155** -0.448** -0.155** -0.449**
Prior Part -0.139 -0.099 -0.181 -0.129
Age -0.587* -0.277** -0.467* -0.220*
Gender 1.098** 0.265** 1.356** 0.327**
SPS Learned 0.040 0.088
SPS Importance 0.085* 0.206*
R2 0.161 0.334 0.393
F 21.64** 13.81** 11.67**
Δ R2 0.161 0.174 0.059
Δ F 21.64** 9.56** 5.25*
Hypothesis 3a: There will be significant differences in SPS Learned and SPS
Importance scores based on gender.
The variables (SPS Learned and SPS Importance score and gender) were checked for violations of the assumptions of the independent samples t test. There were no outliers in the SPS Learned or SPS Importance data for females, as assessed by visual inspection of a box plot. There were six outliers in the SPS Learned data and one in the SPS Importance data for males, as assessed by visual inspection of a box plot. Two of the outliers in the SPS Learned data were 3 box-lengths away from the edge of their box and were considered extreme. Inspection of the outliers revealed no data entry or measurement errors. The outliers were considered genuinely unusual values and were left in the analysis. The visual analysis of the Normal Q-Q plots and histograms revealed a deviation from the normal distribution of SPS Learned and SPS Importance scores for both males and females, thus nonparametric statistics were used. Due to a violation of the assumption of normality, the Mann-Whitney U test was deemed an appropriate non-parametric statistic to compare male and female scores on the SPS Learned scale.
Mann-Whitney U tests were run to determine if there were differences in SPS
Learned or SPS Importance scores between males and females. Distributions of the
scores of SPS Learned and SPS Importance scores for males and females were similar, as
assessed by visual inspection. Median SPS Learned score was not statistically
Median SPS Importance score was statistically significantly higher in males than females,
U = 1221, z = -2.036, p < .05. Results can be found in Table 10.
Table 10: Differences in SPSLearned and SPSImportance based on gender
SPSLearned SPSImportance
Males N = 70 N = 70
Females N = 45 N = 45
Mann-Whitney U 1296.000 1221.000
Wilcoxon W 2331.000 2256.000
Z -1.613 -2.036
Asymp. Sig. (2-tailed) .107 .042
Hypothesis 3b: There will be significant differences in participants’ SPS Learned and SPS
Importance scores based on grade level.
The variables (SPS Learned and SPS Importance score and grade level) were checked for violations of the assumptions of the independent samples t test. The SPS Learned data had two outliers for third grade and four outliers for fourth grade, as assessed by visual inspection of box-plots. One of the outliers for fourth grade was considered extreme. There were no outliers in the SPS Learned data for fifth grade. The SPS Importance data had no outliers for third or fourth grade, and three outliers for fifth grade, as assessed by visual inspection of box-plots. The outliers were considered genuinely unusual values and were left in the analysis. The visual analysis of the Normal Q-Q plots and histograms revealed a deviation from the normal
distribution of SPS Learned and SPS Importance scores for all grade levels, thus nonparametric statistics were used. Due to a violation of the assumption of normality, the Mann-Whitney U test was deemed an appropriate non-parametric statistic to compare third, fourth, and fifth grader scores on the SPS Learned scale.
Mann-Whitney U tests were run to determine if there were differences in SPS Learned or
SPS Importance scores between grade levels. Distributions of the scores of SPS Learned and
SPS Importance scores for all grade levels were similar, as assessed by visual inspection.
Median SPS Learned score was not statistically significantly different between third and fourth
grade, U = 893, z = -.164, p = .870. Median SPS Importance scores were not statistically
significantly different between third and fourth grade participants, U = 772, z = -1.203, p = .229.
Median SPS Learned scores were not statistically significantly different between third and fifth
statistically significantly higher for third grade participants than fifth grade participants, U = 285,
z = -2.057, p < .05. Median SPS Learned scores were not statistically significantly different
between fourth and fifth grade participants, U = 608.50, z = -1.311, p = .190. Median SPS
Importance scores were not statistically significantly different between fourth and fifth grade
participants, U = 598.50, z = -1.403, p = .161. Results can be found in Tables 11 – 13.
Table 11: Differences in SPSLearned and SPSImportance between grades 3 and 4
SPSLearned SPSImportance
Third Grade N = 32 N = 32
Fourth Grade N = 57 N = 57
Mann-Whitney U 893.000 772.000
Wilcoxon W 1421.000 2425.000
Z -.164 -1.203
Asymp. Sig. (2-tailed) .870 .229
a. Grouping Variable: Grade
Table 12: Differences in SPSLearned and SPSImportance between grades 3 and 5
SPSLearned SPSImportance
Third Grade N = 32 N = 32
Fifth Grade N = 26 N = 26
Mann-Whitney U 357.000 285.000
Wilcoxon W 708.000 636.000
Z -.931 -2.057
Asymp. Sig. (2-tailed) .352 .040
Table 13: Differences in SPSLearned and SPSImportance between grades 4 and 5
SPSLearned SPSImportance
Fourth Grade N = 57 N = 57
Fifth Grade N = 26 N = 26
Mann-Whitney U 608.500 598.500
Wilcoxon W 959.500 949.500
Z -1.311 -1.403
Asymp. Sig. (2-tailed) .190 .161
a. Grouping Variable: Grade
Hypothesis 3c: There will be significant differences in participants’ SPS Learned and SPS
Importance scores based on prior participation in the program.
The variables (SPS Learned and SPS Importance score and prior participation) were checked for violations of the assumptions of the independent samples t test. The SPS Learned data had three outliers in the group of non-prior participants and three outliers in the group of prior participants, as assessed by visual inspection of box-plots. One of the outliers in the prior participant group was considered extreme. There was one outlier in the SPS Importance data in the non-prior participant group. No outliers were found in the SPS Importance data for prior participants. The outliers were considered genuinely unusual values and were left in the
Mann-Whitney U tests were run to determine if there were differences in SPS Learned or
SPS Importance scores between prior participants and new participants. Distributions of the
scores of SPS Learned and SPS Importance scores for both groups were similar, as assessed by
visual inspection. Median SPS Learned scores were not statistically significantly different
between prior and new participants, U = 1468.50, z = -.378, p = .705. Median SPS Importance
scores were not statistically significantly different between prior and new participants, U =
1518.50, z = -.085, p = .933. Results can be found in Table 14.
Table 14: Differences in SPSLearned and SPSImportance based on prior participation
SPSLearned SPSImportance
Prior Participant N = 42 N = 42
New Participant N = 73 N = 73
Mann-Whitney U 1468.500 1518.500
Wilcoxon W 4169.500 2421.500
Z -.378 -.085
Asymp. Sig. (2-tailed) .705 .933
a. Grouping Variable: PriorPart
Post Hoc Analyses
To further explore the finding of significant gender differences in ratings of SPS
Importance, four additional paired t-tests were performed (post for SDQ Total score and pre-post for SDQ Prosocial scores) separately for males and females.
A paired t test for dependent samples was conducted to compare pre intervention SDQ Prosocial scores and post intervention SDQ Prosocial scores for male participants. A significant different was found between the scores for pre intervention SDQ Prosocial scores (M=7.87, SD=1.75) and post intervention SDQ Prosocial scores (M=7.21, SD=1.98); t (69)=2.93, p=.005. This
significant difference was not in the predicted direction, indicating that male participants had rated themselves as having significantly fewer prosocial behaviors at the conclusion of the intervention.
CHAPTER 6: DISCUSSION
The present study examined whether participation in an after-school SEL sports program affected the social emotional development of at-risk elementary school students. The first hypothesis of this study was that participation in the PLAYS intervention would positively impact participants’ social emotional development. The second hypothesis was that participant’ experiences in the program, in addition to demographic variables and pre SDQ total scores, would predict post intervention prosocial behavior. The third hypothesis was that there would be differences in participants’ experiences in the program based on prior participation in the
program and demographic variables.
The statistical analyses did not support the first hypothesis. The results suggest that the PLAYS intervention did not have a significant effect on students’ overall performance on a post intervention measure of social emotional development. The results also suggest that the PLAYS intervention did not elicit a statistically significant median increase in prosocial behaviors at the conclusion of the intervention.
The statistical analyses supported the second hypothesis. The results indicate that participant’ experiences in the program, in addition to demographic variables and pre SDQ total scores significantly predicted post intervention prosocial behavior. The full model accounted for approximately 39% of the variance in post intervention scores on a measure of prosocial
The statistical analyses for the third hypothesis indicated that there is a statistically significant difference between male and female ratings of what aspects of the program they considered important, but no significant difference between what they learned from the program. In terms of grade level differences in program experiences, there was a statistically significant difference between third and fifth graders on what aspects of the program they found important. There were no other statistically significant differences between grade levels. There were no statistically significant differences found between prior and new participants on aspects of the program they found important or on what they learned from the program.
In the section that follows, the research questions will be interpreted in relation to existing research. Then, the study’s limitations will be considered. Finally, implications and directions for future research will be discussed.
Explanation of Findings
While there is little preceding literature examining the relationships between sports programs and social emotional development, it was hypothesized that participation in an after school sports program embedded within a social emotional learning curriculum would improve at-risk participants’ social emotional development. This hypothesis was based on risk and protective factor and youth development research within the framework of Bronfenbrenner’s ecological model of child development, which indicates “layers” of environment that impact a child’s development (Buchanan, 2014).
provide opportunity for adolescents to develop physically, intellectually, psychologically, and socially (Eccles & Gootman, 2002).
Consistent with Catalano’s 2004 study that summarized the findings of 25 effective youth development programs, this study used positive outcome measures to examine either a reduction in negative behavior or an increase in positive behavior. No significant reduction of negative behavior or increase in positive behavior was found in this study. It is important to note, however, that the mean score of total rated negative behaviors at the
conclusion of the intervention was lower than the mean of those rated prior to implementation of the intervention. This indicates that there was a decrease in reported problematic behaviors at the conclusion of the intervention though it did not reach statistical significance. On the outcome measure used in this study, the Strengths and Difficulties Questionnaire (SDQ), total scores between 20-40 are in the Abnormal range (i.e., many more negative behaviors than normal), scores between 16-19 are in the Borderline range, and scores between 0-15 are in the Normal range. The mean total scores for participants in this study prior to the intervention was only 10.88; thus, there may not have been a statistically significant decrease in negative behavior because the participants were not presenting with an abnormal amount of negative behaviors at the start of the intervention. However, the lack of significant findings may suggest limited impact of the social emotional learning curriculum within a sports program to reduce at-risk childrens’ negative behaviors.
SEL intervention they considered to be important. There was not a significant difference
between males and females in regards to what they learned from the program. In terms of grade level differences in program experiences, third graders indicated statistically significantly higher SPS Importance scores than fifth grade participants. These grade level differences are consistent
with the relationship between cognitive-developmental stages and phases of emotional development (Lewis & Granic, 2010) and provide implications for tailoring the intervention program based on participants’ overall developmental level.
Study Limitations
Certain limitations should be considered when interpreting the results of the present study. The following section will discuss concerns about the within-person design of the study, including potential threats to internal validity and clustering effects. Limitations of using self-report measures will also be discussed.
children were able to validly report core and basic symptoms of depression and anxiety (Luby, Belden, Sullivan & Spitznagel, 2007).
Ideally, several individuals (multi-raters) would complete rating scales to corroborate observations of behavior. Unfortunately, the PLAYS teacher/coaches did not know all of their players prior to the start of the intervention and were therefore unable to complete the pre
intervention ratings. Moreover, parent participation was too sporadic to have parent-rating scales completed.
The methodological shortcomings of the present study should also be considered when interpreting the effect of the PLAYS intervention on social emotional development. First, all of the participants were assumed to be at-risk based on attending an AUSL school. This
assumption was based on the fact that students attending AUSL schools, which are the lowest performing schools in the city, are likely to be from low-income, minority families. Other than school affiliation and grade level, no inclusionary criteria was used to recruit participants. Exclusionary criteria were also not used; as long as students were enrolled in a participating AUSL school in grades 3 through 5, they were allowed to participate.
Furthermore, the present study does not include a comparison group due to IRB restrictions from the participating school district. Without a control group, it is challenging to determine if the improvements that were observed were related to the intervention or to a number of other factors, such as participant maturation, differences in team climate, or special attention given to the children during participation in the intervention. Due to the absence of a control group, it is difficult to attribute positive student outcomes to the intervention.
An additional limitation of the study was the length of the intervention, which only
program. In order to assess any long-term and carry-over effects, the students would need to
participate, at minimum, in the intervention over the course of an entire school year.
Implications
The findings from the current study did not support the hypothesis that the PLAYS intervention had a significant effect on participants’ overall performance on a post intervention measure of social emotional development. Study limitations, specifically the dosage of the intervention and self-report outcome measures, may have limited finding of significant effects. Catalano and colleagues (2004) summarized the findings of 25 youth development programs and found that the effective programs were delivered over a period of 9 months or longer. Outcome data would ideally be from multiple raters, not only from the participants themselves. Durlak and colleagues (2011) completed a meta-analysis of 213 school based SEL programs. They found that outcome data from other sources (i.e., parents, teachers) yielded significantly higher effects than those from student self-reports.
The findings did support the second hypothesis that participant’ experiences in the program, in addition to demographic variables and pre SDQ total scores would significantly predict post intervention prosocial behavior. This finding can help tailor future social emotional intervention efforts with at-risk populations. The third hypothesis findings of gender differences and grade level differences, can also help to tailor similar interventions in the future.
The culture of the intervention is best explained by Bronfenbrenner’s (1979) ecological model and proximal processes theory; the participants were impacted by a number of systems that influenced their development, including parents, family members, teachers, and peers.
other factors that future researchers may find interesting to explore such as the home-school connection that this type of after-school intervention seeks to facilitate and how that connection may impact the child’s development. The impact of individual relationships between
participants and their families, teachers, and peers on social emotional development during the duration of the intervention may also be an intriguing area of future research given the
significant findings about the impact of father involvement (Baker, 2013), teacher preparation (Gimbert, Bol, & Wallace, 2007), peer interactions (Denham, 2001), and quality of sibling relationships (Stormshak, Bellanti, & Bierman, 1996) on social emotional and cognitive
development. Several variables that were not examined in this study may also be interesting to measure in future research on the role of social emotional development and sports programs. Such variables include the participants’ mental health status, disability status, and cognitive ability. These variables may affect the impact of a sports based SEL intervention on the development of social emotional competence.
Conclusions
and 5, as well as the relatively low mean Pre SDQ Total score, suggest that the use of
inclusionary criteria (i.e., 5th grade males with SDQ Pre Total scores of 20 or higher) may be the most beneficial way to tailor the intervention for at-risk students. Moreover, the duration of the intervention should be increased, and a control group should be used to ensure that any
APPENDIX
PLAYS Program Curriculum
A Guide to the Curriculum
Program Curriculum
Program Mission Statement: The Chicago Fire Foundation P.L.A.Y.S. Program created in partnership with World Sport Chicago is committed to enhancing the academic performance and development of key social and emotional skills of elementary school students through a sports based curriculum.
Goal: The P.L.A.Y.S. (Participate, Learn, Achieve, Youth Soccer) Program will engage participants by utilizing soccer and a curriculum focused on building grit as a means to grow Social and Emotional Learning (SEL) characteristics in third through fifth grade students from schools in some of Chicago's underserved
communities. Through soccer and the SEL curriculum, students will achieve a greater level of self and social awareness, build a strong character and strengthen skills linked to enhanced academic performance. Partners: The P.L.A.Y.S. Program was created in partnership with the Chicago Fire Foundation, World Sport Chicago, Academy of Urban School Leadership, the University of North Carolina at Chapel Hill and the University of Chicago.
Intended Learning Outcomes:
1. Players will develop fundamental skills for life effectiveness using the GRIT construct and CASEL
(Collaborative for Academic, Social, and Emotional Learning) core competencies:
a. GRIT :
i. Teamwork
ii. Self Awareness & Desire to Achieve
iii. Motivation, Passion & Movement towards goals
iv. Perseverance
v. Resilience
b. CASEL Core Competencies:
i. Self Management
ii. Self Awareness
iii. Responsible Decision Making
iv. Social Awareness
v. Relationship Skills
2. Players will develop the following soccer skills:
a. Week 1: Passing & Moving
b. Week 2: Dribbling
c. Week 3: Beating a Defender
d. Week 4: Turning with the Ball
e. Week 5: Running with the Ball
f. Week 6: Shooting
g. Week 7: Cross & Finishing
h. Week 8: Defending
i. Week 9: When to Dribble, When to Pass