Jingyi Zhou. An Analysis of the Allergy Comments on Twitter Using Data Mining Approach. A Master’s Paper for the M.S. in I.S degree. April, 2020. 60 pages. Advisor: Jaime Arguello
Allergies are one of the most common chronic illnesses in the world. The prevalence of social media allows people to express their opinions and exchange information including symptoms of personal health. Mining those publicly accessible health-related data on social media, such as Twitter, offers a unique approach to get valuable healthcare insights.
In this paper, a multi-component data mining framework was developed to collect Twitter data, detect time series patterns, discover topics of interest about allergies, and analyze the contents of tweets. From the extracted 2.2 million tweets in 2019, my experimental results show that allergy-related tweet volume is strongly correlated to the pollen data (r = .699, p < .01). Also, 152 unique topics are identified with a -28.36 perplexity score and a .67 coherence score. Furthermore, many linguistic dimensions such as the sentiment are analyzed to learn about the tweet contents. I consider this to be one of the many studies examining a large-scale social media stream to deeply analyze allergy activities. And with the growing social media, publicly available data such as Twitter posts can be used to support healthcare practitioners and social scientists in better understanding common public opinions, not just allergies.
Headings:
Text Mining
Health Informatics
by Jingyi Zhou
A Master’s paper submitted to the faculty of the School of Information and Library Science of the University of North Carolina at Chapel Hill
in partial fulfillment of the requirements for the degree of Master of Science in
Information Science.
Chapel Hill, North Carolina
April 2020
Approved by
Table of Contents
Introduction ... 2
Related Works ... 6
Methods ... 17
Data Collection ... 17
Twitter Dataset ... 17
Pollen Dataset ... 18
Data Preprocessing ... 19
Topic Discovery ... 20
Content Analysis ... 21
Results ... 24
Trend Analysis ... 24
Topic Modeling ... 26
Baseline ... 27
Eyeballing ... 27
Topic Perplexity ... 31
Topic Coherence ... 31
Content Analysis ... 32
Discussion ... 35
Conclusion and Future Work ... 39
References ... 41
Introduction
Allergies, also known as allergic diseases, are conditions caused by hypersensitivity
of the immune system to typically harmless substances in the environment (McConnell,
2007). Allergies are common and the complexity and severity of allergic diseases are
increasing worldwide. In the developed world, about 20% of people are affected by allergic
rhinitis, about 6% of people have at least one food allergy, and about 20% are afflicted
with atopic dermatitis at some point in time (Wikipedia, 2019). Worldwide, the rise in the
prevalence of allergic diseases has continued in the industrialized world for more than 50
years (WHO, 2012). More than 50 million Americans have experienced various types of
allergies each year. And Allergies are the 6th leading cause of chronic illness in the U.S.
with an annual cost in excess of $18 billion (Acaai, 2019). People visit the emergency room
about 200,000 times each year because of food allergies. In 2017, 8.1 percent of adults
(19.9 million adults) and 7.7 percent of children (5.6 children) were diagnosed with hay
fever (SHST, 2017).
Moreover, continuous use of allergy medication can worsen patients’ health
conditions and lead to side effects like dizziness, nausea and vomiting, and other serious
medical complications. Furthermore, an increasing number of allergy patients gives rise to
allergy-related health care costs and leads to reduced work productivity. Asthma-related
medical expenses are estimated to cost the U.S. health-care system $82 billion a year,
according to a study by U.S. Centers for Disease Control and Prevention. And researchers
allergies, from medical care to food to pharmaceuticals are $4,184 per child per
year, costing our economy $25 billion, including lost productivity (Robynobrien, 2019).
To this end, 4 million workdays are lost due to hay fever alone each year. Therefore,
accurate allergy surveillance and forecast is important to minimize the healthcare cost and
maximize work productivity loss due to allergy symptoms.
The growth of social media has provided a research opportunity to track public
behaviors, information, and opinions about common health issues including allergy. It is
estimated that the number of social media users will increase from 2.14 billion in 2015 to
2.95 billion in 2020 (Statista, 2019). Twitter, one of the largest social networking website,
allows users to post short text messages called tweets that can be up to 280 characters in
length. As of 2018, Twitter had more than 321 million monthly active users. Twitter has
been used as a valuable real-time information resource for various applications. On Twitter,
people not only make general chatters but also share photos, news, opinions, emotions, and
even health conditions including symptoms and medications they are taking for their
diseases. In recent years, many researchers have investigated using twitter for disease
surveillance, especially for influenza epidemic detection and prediction. Twitter thus
provides a unique opportunity to understand users’ opinions with respect to the most
common health issues (Mejova, Weber, & Macy, 2015). Publicly available Twitter posts
have facilitated data collection and leveraged the research at the intersection of public
health and data science; thus, informing the research community of major opinions and
topics of interest among the general population (Nasukawa&Yi, 2003) that cannot
otherwise be collected through traditional means of research (e.g., surveys, interviews,
organizations such as state health departments and large healthcare systems to provide
health advice and track health opinions of their populations and provide effective health
advice when needed (Mejova et al., 2015).
Among computational methods to analyze tweets, computational linguistics is a
well-known developed approach to gain insight into a population, track health issues, and
discover new knowledge (Paul & Dredze, 2011, 2012). Twitter data has been used for a
wide range of health and non-health related applications, such as the stock market (Bollen,
Mao, & Zeng, 2011) and election analysis (Tumasjan, Sprenger, Sandner, & Welpe, 2010).
Some examples of Twitter data analysis for health-related topics include flu, mental health,
Ebola, Zika, medication use, diabetes, weight loss, and obesity.
In my master’s paper, I aim to improve public health allergy surveillance on social
media and answer three research questions (RQ):
RQ1: What are the trends of the comments related to allergies on Twitter?
RQ2: What are the main topics related to allergies on Twitter?
RQ3: How can the content of the Tweets be analyzed?
I analyze a large scale Twitter data collected over 12 months to monitor the allergy
situation and extract some insights. More specifically,
(1) Expository data analysis is employed to find the latent pattern in allergy-related
tweets and a time series analysis is used to determine the causality between tweets amount
and pollen levels.
(2) To discover topics from the collected tweets, I use a topic modeling approach,
Latent Dirichlet Allocation (LDA), that fuzzy clusters the semantically related words into
(3) An objective interpretation approach with a lexicon-based approach, Linguistic
Related Works
This chapter provides an overview of previous researches on analyzing public
health issues (allergy) via social media (Twitter). While this topic has not been studied
in-depth, much academic research has been conducted on the issues around it. In order to fully
understand this topic, there are three aspects that I think are very important to understand
how social media can be used to help analyze public health issues from multiple
perspectives. First, I am going to find out the specific topic of health care analysis via social
media. The second aspect will explore multiple ways we can deal with social media data,
especially in how to handle natural language and unstructured data. Finally, we will inspect
the application and implication of the researches.
As we have known, publicly available Twitter posts have facilitated data collection
and leveraged the research at the intersection of public health and data science; thus,
informing the research community of major opinions and topics of interest among the
general population (Nasukawa&Yi, 2003; Wiebe et al., 2003; Zabin & Jefferies, 2008) that
cannot otherwise be collected through traditional means of research (e.g., surveys,
interviews, focus groups) (Eichstaedt et al., 2015; Wartell, 2015). Furthermore, analyzing
Twitter data can help health organizations such as state health departments and large
healthcare systems to provide health advice and track health opinions of their populations
and provide effective health advice when needed (Mejova et al., 2015).
Among computational methods to analyze tweets, computational linguistics is a
discover new knowledge (Moreland-Russell, Tabak, Ruhr, & Maier, 2014; Paul & Dredze,
2011, 2012; Zhao et al., 2011). Twitter data has been used for a wide range of health and
non-health related applications, such as the stock market (Bollen, Mao, & Zeng, 2011) and
election analysis (Tumasjan, Sprenger, Sandner, & Welpe, 2010).
Some examples of Twitter data analysis for health-related topics include flu, mental
health, Ebola, Zika, medication use, diabetes, and weight loss and obesity.
To detect influenza epidemics, the traditional methods mostly rely on expensive
surveys of hospitals across the country, typically with lag times of one to two weeks for
influenza reporting, and even longer for less common diseases (Culotta, 2010). And there
have been several recently proposed solutions to estimate a population’s health from
Internet activity, most notably Google’s Flu Trends service, which correlates search term
frequency with influenza statistics reported by the Centers for Disease Control and
Prevention (CDC). And there are now more possibilities to detect flu due to the prevalence
of social media like Twitter. Researchers analyzed messages posted on the micro-blogging
site Twitter.com to determine if a similar correlation can be uncovered. They proposed
several methods to identify influenza-related messages and compare a number of
regression models to correlate these messages with CDC statistics. Using over 500,000
messages spanning 10 weeks, Culotta’s team found that their best model achieves a
correlation of 0.78 with CDC statistics by leveraging a document classifier to identify
relevant messages, which is a very significant breakthrough.
Besides detecting flu, Twitter can also address the challenges of virus outbreak
surveillance, such as Zika and Ebola. Zika-related Twitter incidence peaked after the World
Twitter content (Fu et al., 2016). Fu’s team computationally analyzed the contents of
62,547 English Tweets obtained by search API. Topic modeling was used to group bags of
words in Tweets into different topics. Although 20 topics were identified using statistical
methods, they relied on human judgment to connote them into 5 themes for interpretations.
However, using both a statistical algorithm and human curators makes their study relevant
to public health. Computational methods assist-not replace-health communicators during
emergency responses. Their study highlighted the needs of multilingual Twitter health
communication on the Zika virus.
Michelle Odlum and Sunmoo Yoon demonstrated the use of Twitter as a real-time
method of Ebola outbreak surveillance to monitor information spread, capture early
epidemic detection, and examine the content of public knowledge and attitudes. They
collected tweets mentioning Ebola in English during the early stage of the current Ebola
outbreak from July 24-August 1, 2014. Their analysis for this observational study includes
time series analysis with geologic visualization to observe information dissemination and
content analysis using natural language processing to examine public knowledge and
attitudes. In a nutshell, a total of 42,236 tweets (16,499 unique and 25,737 retweets)
mentioning Ebola were posted and disseminated to 9,362,267,048 people, 63 times higher
than the initial number (Odlum & Yoon), 2015. Tweets started to rise in Nigeria 3-7 days
prior to the official announcement of the first probable Ebola case. The topics discussed in
tweets include risk factors, prevention education, disease trends, and compassion. Because
of the analysis of a unique Twitter dataset captured in the early stage of the current Ebola
outbreak, their results provide insight into the intersection of social media and public health
inform public health education. Allison J. Lazard et al. did a research on a similar topic.
They conducted a text mining analysis of the Centers for Disease Control and Prevention’s
Ebola live Twitter chat. And they concluded that social media text mining provides a
valuable tool that can be used quickly and efficiently to improve public health
communication efforts by collecting and identifying prevalent themes of public concern
(Lazard, Scheinfeld, Bernhardt, Wilcox, & Suran, 2015).
Tweets can also augment a public health program that studies emerging patterns of
illicit drug use (Buntain & Golbeck, 2015). Buntain & Golbeck described the architecture
necessary to collect vast numbers of tweets over time based on a large number of search
terms and the challenges that come with finding relevant information in the collected tweets.
They then showed several examples of early analysis they have done on this data,
examining temporal and geospatial trends. They also admitted that there were many
challenges ahead in this space. Disambiguation is one of the largest. In addition, it was
generally difficult to acquire recent and timely statistics on drug abuse across a wide
geographic region.
As prescription drug abuse has become a major public health problem.
Relationships and social context are important contributing factors. Social media provides
online channels for people to build relationships that may influence attitudes and behaviors.
To determine whether people who show signs of prescription drug abuse connect online
with others who reinforce this behavior and to observe the conversation and engagement
of these networks with regard to prescription drug abuse, Carl Lee Hanson studied
exploration of social circles and prescription drug abuse through Twitter. He and his
to November 2012. From this set, 25 Twitter users were selected who discussed topics
indicative of prescription drug abuse. Social circles of 100 people were discovered around
each of these Twitter users; the tweets of the Twitter users in these networks were collected
and analyzed according to prescription drug abuse discussion and interaction with other
users about the topic. A strong correlation was found between the kinds of drugs mentioned
by the index user and his or her network (mean r=0.73) and between the amount of
interaction about prescription drugs and a level of abusiveness shown by the network
(r=0.85, P<.001). Finally, they concluded that Twitter users who discuss prescription drug
abuse online are surrounded by others who also discuss it—potentially reinforcing a
negative behavior and social norm (Hanson, Cannon, Burton, & Giraud-Carrier, 2013).
Mental health is one of the essential parts of public health care. Glen Coppersmith,
Mark Dredze, Craig Harman and Kristy Hollingshead examined a broad range of mental
health conditions in Twitter data by identifying self-reported statements of diagnosis. They
systematically explored language differences between ten conditions with respect to the
general population, and to each other. Then they explored simple classifiers capable of
distinguishing these users from their age- and gender-matched controls, based on signals
quantified from the users’ language. The classifiers also allowed them to systematically
compare the language used by those with the ten conditions investigated, finding some
groupings of the conditions found elsewhere in the literature, but not altogether obvious
(Coppersmith, Dredze, Harman, & Hollingshead, 2015). They took this as evidence that
examining mental health through the lens of language is fertile ground for advances in
social media is ripe for data scientists, computational linguists, and clinical psychologists,
together, are well-positioned to drive this field forward.
Social media is a platform not only for individuals but also for government
departments and organizations. Twitter can be used as a tool for educational organizations
to inform the public about some issues like diabetes. Diabetes may affect one-third of US
adults by 2050. Adopting a healthful diet and increasing physical activity are effective in
preventing type 2 diabetes and decreasing the severity of diabetes-related complications.
Educating and informing the public about health problems is a service provided by local
health departments (LHDs). Jenine K. Harris et al. examined how LHDs are using social
media to educate and inform the public about diabetes. In June 2012 they used NVivo 10
to collect all tweets ever posted from every LHD with a Twitter account and identified
tweets about diabetes. They used a 2010 National Association of County and City Health
Officials survey to compare characteristics of LHDs that tweeted about diabetes with those
that did not. Content analysis was used to classify each tweet topic. They found that of 217
LHDs with Twitter accounts, 126 had ever tweeted about diabetes, with 3 diabetes tweets
being the median since adopting Twitter. LHDs tweeting about diabetes were in
jurisdictions with larger populations and had more staff and higher spending than LHDs
not tweeting about diabetes. They were significantly more likely to employ a public
information specialist and provide programs in diabetes-related areas. There was also a
weak positive association between jurisdiction diabetes rate and the percentage of all
tweets that were about diabetes (r = .16; P = .049). So they conclude LHDs were beginning
understanding of the reach and effectiveness of social media could enable public health
practitioners to use them more effectively (Harris, Mueller, Snider, & Haire-Joshu, 2013).
Public health-related tweets are difficult to identify in large conversational datasets
like Twitter.com. Even more challenging is the visualization and analyses of the spatial
patterns encoded in tweets. In Debarchana Ghosha and Rajarshi Guha’s study of mapping
tweets with topic modeling and geographic information system, obesity is chosen as a test
theme to demonstrate the effectiveness of topic modeling using Latent Dirichlet Allocation
(LDA) and spatial analysis using Geographic Information System (GIS) (Ghosh & Guha,
2013). The dataset was constructed from tweets (originating from the United States)
extracted from Twitter.com on obesity-related queries. Examples of such queries are ‘food
deserts’, ‘fast food’, and ‘childhood obesity’. The tweets were also georeferenced and
time-stamped. Three cohesive and meaningful themes such as ‘childhood obesity and schools’,
‘obesity prevention’, and ‘obesity and food habits’ are extracted from the LDA model. The
GIS analysis of the extracted themes showed distinct spatial patterns between rural and
urban areas, northern and southern states, and between coasts and inland states. Further,
relating the themes with ancillary datasets such as the US census and locations of fast-food
restaurants based upon the location of the tweets in a GIS environment opened new avenues
for spatial analyses and mapping. Therefore the techniques used in this study provide a
possible toolset for computational social scientists in general, and health researchers in
specific, to better understand health problems from large conversational datasets.
In another study to explore the use of social media as a tool for health
communication. Harris J.K. and his coworker used a mixed-methods design to examine
NodeXL was used to collect tweets sent in June 2013 containing the hashtag
#childhoodobesity. Tweets were coded for content; tweeters were classified by sector and
health focus. Data were also collected on the network of follower connections among the
tweeters. They used descriptive statistics and exponential random graph modeling to
examine tweet content, characteristics of tweeters, and the composition and structure of the
network of connections facilitating communication among tweeters. Eventually, they
collected 1110 tweets originating from 576 unique Twitter users. More individuals (65.6%)
than organizations (32.9%) tweeted. More tweets focused on individual behavior than
environment or policy. Few governments and educational tweeters were in the network,
but they were more likely than private individuals to be followed by others. After analyzing
the results, they concluded that there was an opportunity to better disseminate
evidence-based information to a broad audience through Twitter by increasing the presence of
credible sources in the #childhoodobesity conversation and focusing the content of tweets
on scientific evidence.
Another project created a Twitter classification model, which is aimed to design
and test data collection and management tools that can be used to study the use of mobile
fitness applications and social networking within the context of physical activity (Vickey,
Ginis, & Dabrowski, 2013). That project was conducted over a 6-month period and
involved collecting publically shared Twitter data from five mobile fitness apps (Nike+,
RunKeeper, MyFitnessPal, Endomondo, and dailymile). During that time, over 2.8 million
tweets were collected, processed, and categorized using an online tweet collection
application and a customized JavaScript. Using the grounded theory, a classification model
application users. Their data showed that by tracking mobile fitness app hashtags, a wealth
of information could be gathered to include but not limited to daily use patterns, exercise
frequency, location-based workouts, and overall workout sentiment.
Those previous Twitter studies have dealt with extracting common topics of one
health issue discussed by the users to better understand common themes. However, there
is one study that utilized an innovative approach to computationally analyze unstructured
health-related text data exchanged via Twitter to characterize health opinions regarding
four common health issues, including diabetes, diet, exercise, and obesity (DDEO) on a
population level (Karami et al., 2018). This study identified the characteristics of the most
common health opinions with respect to DDEO and discloses public perception of the
relationship between diabetes, diet, exercise, and obesity. These common public
opinions/topics and perceptions can be used by providers and public health agencies to
better understand the common opinions of their population denominators in regard to
DDEO, and reflect upon those opinions accordingly.
Kathy Lee, Ankit Agrawal and Alok Choudhary’s work about mining social media
streams to improve public health allergy surveillance is the most inspiring paper for me.
As mentioned in the paper, with the prevalence of social media, people sharing experiences
and opinions on personal health symptoms and concerns on social media are increasing
(Lee, Agrawal, & Choudhary, 2015). Mining those publicly available health-related data
potentially can provide valuable healthcare insights. In this paper, the authors proposed a
real-time allergy surveillance system that first classifies tweets to identify those that
mention actual allergy incidents using the bag-of-words model and NaiveBayes
collected allergy-related tweets from public tweet stream using twitter’s streaming API.
They had collected over 6.3 million tweets that mention ‘allergy’ or ‘allergies’ created by
over 3.1 million unique users over 28 months from January 2013 to April 2015. And they
used methods including data preprocessing, data classification, text mining, and
Spatiotemporal Mining to get the result. Their experimental results showed that the
proposed system can detect predominant allergy types with high precision and that
allergy-related tweet volume is highly corallergy-related to the weather data (daily maximum temperature).
In the past decade, with a dramatic increase in internet use, online data has been
extensively used to retrieve health information and to detect disease activities. Web search
queries data have been studied to track influenza activities. Ginsberg et al. used flu-related
google search queries data to estimate current flu activity near real-time, 1-2 weeks in
advance of the records by the traditional flu surveillance system. Recent research on public
health and disease surveillance using online data has mostly focused on monitoring and
predicting influenza levels. Researchers have used twitter data to monitor influenza
outbreak and to predict flu activities. Lee et al. built a real-time disease surveillance system
that uses Twitter data to track flu activity. Signorini et al. attempted estimating current
influenza activity by tracking public sentiment and applying support vector machine
algorithm on Twitter data generated during the Influenza A H1N1 pandemic. Chew et al.
analyzed the content and sentiment of tweets generated during the 2009 H1N1 outbreak
and showed the potential and feasibility of using social media to conduct infodemiology
studies for public health. There are many others who have used Twitter data for flu outbreak
prediction, to the best of our knowledge, their work is the first attempt examining allergy
activities using a large scale twitter stream.
Lee et al. classifies trending topics into 18 general categories using text-based and
network-based models. Aramaki et al. proposed a Twitter-based influenza epidemics
detection method that used Natural Language Processing (NLP) to filter out negative
influenza tweets. Tuarob et al. used ensemble machine learning techniques to identify
health-related messages in a heterogeneous pool of social media data. In this work, the
authors used bag-of-words model and explored using four different machine learning
algorithms to find the best model to classify tweets into those that mention actual allergy
incidents and those that mention general awareness or information about allergy season.
In this paper, we focus on examining only allergy activity using a large Twitter
stream collected over two years and show in-depth spatiotemporal analysis results. They
also applied natural language processing techniques to automatically identify prevalent
allergy types from Twitter contents.
This article is the first study that examines a large-scale social media stream for an
Methods
Our approach uses statistical, semantic and linguistics analysis for disclosing health
characteristics of opinions in tweets talking about allergy. The present study includes data
collection, data preprocessing, topic discovery, and topic-content analysis.
Data Collection
Twitter Dataset
This phase collected tweets using Twitter's Application Programming Interfaces
(API) (Twitter, 2017). Twitter's APIs provide both historic and real-time data collections.
This paper adopted the historic method to collect publicly available English tweets from
01/01/2019 to 12/31/2019 using several pre-defined allergy-related queries. Within the
Twitter API, allergy, hay fever, rhinitis, urticaria, anaphylaxis were selected as the related
words and the related health areas. 2,189,597 unique tweets were collected by the query
“allergy OR hay fever OR rhinitis OR urticaria OR anaphylaxis”. Some talk about allergy
types and symptoms (e.g. turns out I’m allergic to the new washing powder we bought &
my body is covered in rashes and blisters). And there are others talking about their emotions
and feelings negatively (e.g., this allergy really sucks) or positively (e.g., I love having
allergic reactions to things on my face). Results for monthly distributions set out in Figure
1. Clearly, users of Twitter appear to post more tweets in the second quarter (666,513),
particularly in April (251,581). Nonetheless, in February users tweeted less than in every
Figure 1: Allergy-related tweet count in 2019
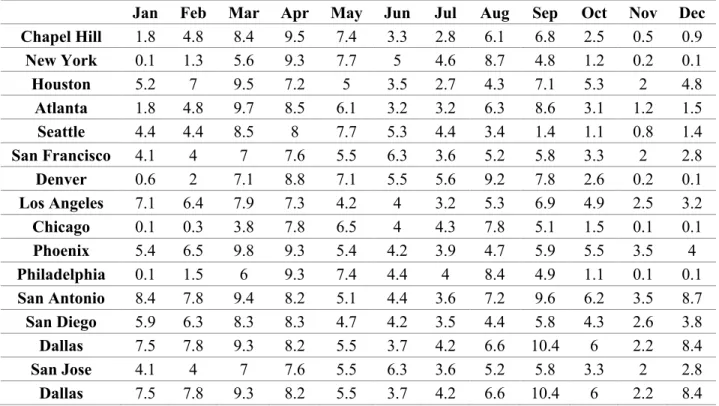
Pollen Dataset
I collected monthly average pollen levels during 2019 for the US main cities from
pollen.com. A pollen count is the measurement of the number of grains of pollen in a cubic
meter of air. High pollen counts can sometimes lead to increased rates of an allergic
reaction for those with allergic disorders. Usually, the counts are announced for specific
plants such as grass, ash, or olive. These are tailored to common plants in the measured
areas. Mild winters with warmer days lead to an increase in pollen counts while colder
winters lead to delayed pollen release (Skinner, 2016). A pollen index defined by
pollen.com is a number between 0 and 12 and divided into five categories: 0-2.4 (low),
2.5-4.8 (low-med), 4.9-7.2 (medium), 7.3-9.6 (med-high), 9.7-12.0 (high). The dataset contains
16 cities, which covers the top 10 cities ranking by population. The details can be seen in
Table 1: Monthly pollen levels in the main cities of the US
Jan Feb Mar Apr May Jun Jul Aug Sep Oct Nov Dec Chapel Hill 1.8 4.8 8.4 9.5 7.4 3.3 2.8 6.1 6.8 2.5 0.5 0.9 New York 0.1 1.3 5.6 9.3 7.7 5 4.6 8.7 4.8 1.2 0.2 0.1 Houston 5.2 7 9.5 7.2 5 3.5 2.7 4.3 7.1 5.3 2 4.8 Atlanta 1.8 4.8 9.7 8.5 6.1 3.2 3.2 6.3 8.6 3.1 1.2 1.5 Seattle 4.4 4.4 8.5 8 7.7 5.3 4.4 3.4 1.4 1.1 0.8 1.4 San Francisco 4.1 4 7 7.6 5.5 6.3 3.6 5.2 5.8 3.3 2 2.8 Denver 0.6 2 7.1 8.8 7.1 5.5 5.6 9.2 7.8 2.6 0.2 0.1 Los Angeles 7.1 6.4 7.9 7.3 4.2 4 3.2 5.3 6.9 4.9 2.5 3.2 Chicago 0.1 0.3 3.8 7.8 6.5 4 4.3 7.8 5.1 1.5 0.1 0.1 Phoenix 5.4 6.5 9.8 9.3 5.4 4.2 3.9 4.7 5.9 5.5 3.5 4 Philadelphia 0.1 1.5 6 9.3 7.4 4.4 4 8.4 4.9 1.1 0.1 0.1 San Antonio 8.4 7.8 9.4 8.2 5.1 4.4 3.6 7.2 9.6 6.2 3.5 8.7 San Diego 5.9 6.3 8.3 8.3 4.7 4.2 3.5 4.4 5.8 4.3 2.6 3.8 Dallas 7.5 7.8 9.3 8.2 5.5 3.7 4.2 6.6 10.4 6 2.2 8.4 San Jose 4.1 4 7 7.6 5.5 6.3 3.6 5.2 5.8 3.3 2 2.8 Dallas 7.5 7.8 9.3 8.2 5.5 3.7 4.2 6.6 10.4 6 2.2 8.4
Data Preprocessing
The preprocessing method plays a very important role in text mining techniques
and applications. It is the first step in the text mining process.
As I am interested in English messages, I have omitted tweets that are not written
in English (7.6% of the initial data set, mostly Japanese). Emojis and punctuation are
eliminated. All hyperlinks are replaced by the string ‘URL’ and all “@Username” are
translated to "AT_USER". To further the data, I first lowercased all the text data.
Stopwords are the most common words in any natural language. Such stopwords
may not bring any significance to the context of the document for the purpose of
interpreting text data and building some NLP models. And in my study, stopwords are
Lemmatization was applied in order to reduce the size of the dictionary and thus
the dimensionality of the description of text within the collection.
I also used n-gram to tokenize the tweets into consecutive sequences of words. To
be specific, I added bigrams and trigrams to text data. And most notably, since the dataset
is too large, I used the stratified random sampling method to extra 218,323 data with 2,812
unique tokens for topic modeling.
Topic Discovery
Topic modeling has a broad variety of applications in health and medical sciences
such as forecasting protein-protein relationships based on the literature knowledge (Asou
& Eguchi, 2008), finding applicable scientific principles and mechanisms in patients’
health records (Arnold, El-Saden, Bui, & Taira, 2010), and identifying patterns of clinical
events in a cohort of patients with brain cancer (Arnold & Speier, 2012).
Among all topic models, Latent Dirichlet Allocation (LDA) (Blei, Ng, & Jordan,
2003) is the most popular and most effective model (Lu, Mei, & Zhai, 2011; Paul & Dredze,
2011) as shown by studies that LDA is an effective computational linguistics model for
exploration of topics in a corpus (Hong & Davison, 2010; Mcauliffe & Blei, 2008). LDA
is defined as a generative probabilistic model for the collections of discrete data such as
text corpora. LDA is a three-level hierarchical Bayesian model, in which each item of a
collection is modeled as a finite mixture over an underlying set of topics (Blei, Ng, &
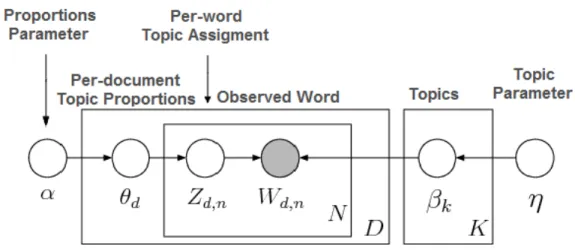
Jordan, 2003). It assumes a collection of K “topics.” As seen in Figure 2, each topic
describes a multinomial distribution over the vocabulary and is assumed to have been
drawn from a Dirichlet 𝛽!~Dirichlet(η). In the light of the topics, LDA assumes the
𝛽!~Dirichlet(ɑ). Then, for each word 𝑖 in the document, draw a topic index 𝑧"# ∈ {1, . . . ,
K } from the topic weights 𝑧"#∼𝜃" and draw the observed word 𝑤"# from the selected
topic, 𝑤"#~ 𝛽$!".
Figure 2: Latent Dirichlet Allocation (LDA) Structure, LDA represented as a graphical model in which the nodes denote the random variables and the edges of the dependencies between them. Unshaded nodes are unobserved or hidden variables and the shaded nodes represent the observed random variables. The boxes, called plates, indicate replication.
Twitter users can post their opinions or share information about a subject to the
public. Identifying the main topics of users’ tweets provides an interesting point of
reference, but conceptualizing larger subtopics of millions of tweets can reveal valuable
insight into users’ opinions. To discover topics from the collected tweets, I set Gensim's
standard LDA as the baseline model and compared the improved Mallet implementation
of LDA (Blei et al., 2003; McCallum, 2002) with it. To determine the optimum number of
topics, I used hyperparameter tuning. The best performance was determined 152 topics.
Content Analysis
The topic content analysis component used an objective interpretation approach
with a lexicon-based approach to analyze the content of topics. The lexicon-based approach
uses dictionaries to expose the semantic orientation of words on a topic. Linguistic Inquiry
personality, and motivations in the corpus (Karami & Zhou, 2014a, 2014b, 2015). LIWC
is a straightforward text analysis software that counts words in psychologically meaningful
categories. Empirical results using LIWC demonstrate its potential to detect meaning in a
wide variety of experimental contexts, including to show attentional focus, emotionality,
social relationships, t thought patterns, and human variations (Tausczik & Pennebaker,
2010).
To interpret a text, out of the total number of words in the text, LIWC calculates
the percentage of words in the text that match a dictionary word. Word frequency is
calculated against a word count dictionary in terms of percentages, by using the following
formula:
𝐿𝐼𝑊𝐶 𝑤𝑜𝑟𝑑 𝑓𝑟𝑒𝑞𝑢𝑒𝑛𝑐𝑦 = 𝑤𝑜𝑟𝑑 𝑐𝑜𝑢𝑛𝑡𝑠 𝑎𝑔𝑎𝑖𝑛𝑠𝑡 𝑎 𝑑𝑖𝑐𝑡𝑖𝑜𝑛𝑎𝑟𝑦
𝑡𝑜𝑡𝑎𝑙 𝑤𝑜𝑟𝑑 𝑐𝑜𝑢𝑛𝑡 𝑖𝑛 𝑎 𝑡𝑒𝑥𝑡 × 100%
where a dictionary refers to a collection of words and word stems (sometimes even phrases)
that represent or quantify particular linguistic features or psychological structures of
research interest. A dictionary needs to be defined in advance. The number of words and
word stems in a dictionary varies from several to multiple hundreds. For instance, the
LIWC “affect” dictionary comprises 935 words and stems. LIWC offers up to 66 built-in
dictionaries that represent specific text characteristics, ranging from linguistic processes to
spoken categories (Pennebaker et al., 2007). Among all the built-in dictionaries in LIWC,
the most relevant to public health research include social processes (e.g. family, friends,
and humans), affective processes (e.g. positive emotion, negative emotion, anxiety, anger,
and sadness), biological processes (e.g. body, health, sexual, and ingestion), and personal
2016). In this analysis, I mainly used biology and emotion dictionaries in LIWC to analyze
Results
Trend Analysis
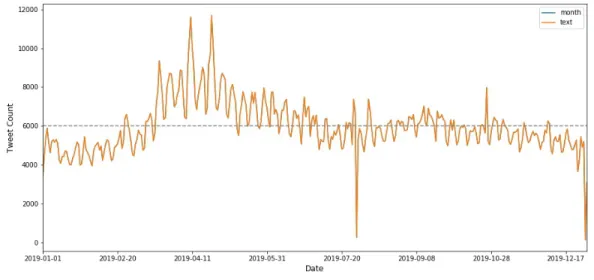
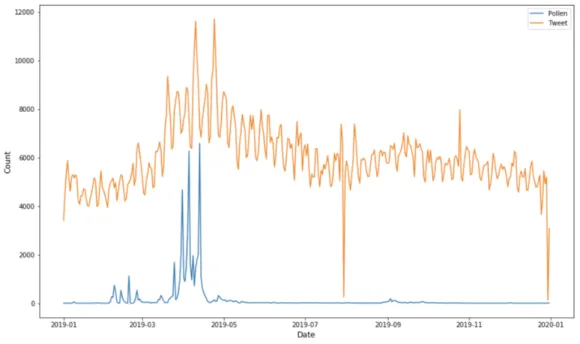
The average amount of tweets every day is 5,999 shown as the dotted line in Figure
3. The graph demonstrates the general allergy level trend over time. The allergy level is the
highest in mid-April, declines in June and July, starts rising again in August, and reaches
its local maximum point in September. Some other studies have observed similar seasonal
variations (Lee, Agrawal, Choudhary, 2015).
Figure 3: Daily data for allergy tweet count
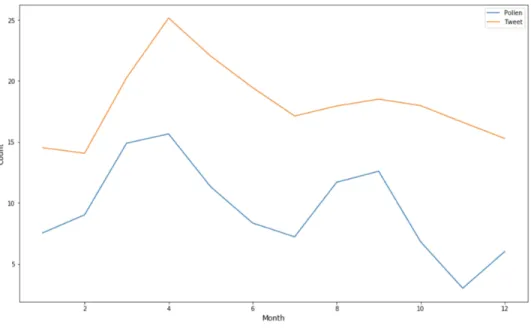
As we know, pollen is one of the most common triggers of seasonal allergies. Many
people know pollen allergy as “hay fever.” Experts typically refer to pollen allergy as
“seasonal allergic rhinitis.” In this research, I compared monthly tweets count and pollen
levels to see whether there is a correlation. Tweet count is strongly correlated to the pollen
Figure 4. The two lines both climb from the beginning and reach their maximum points in
April. Then the tweet count significantly declines as the pollen level is decreasing. They
both have the local minimum points in July and keep rising to September. The trend also
accords with common sense and some scientific explanations. It is understood that certain
allergens, especially pollen, are seasonal. Tree pollen, for example, pops up in the spring
(usually in late March to April), grass pollen occurs in the late spring (around May), weed
pollen is most prevalent in the summer (July to August), and ragweed pollen takes over
from summer to fall (late August to the first frost). This is consistent with the discernible
patterns I found.
Figure 4: Monthly data/10000 for allergy tweet count (orange) and pollen level (blue) in 2019. The number of tweets is shrunk by a factor of 10000 for visualization.
And I also took Atlanta, GA as an example. When looking at the trend of the pollen
count and tweet count during 2019, it is easy to find that the two lines follow identical
trends which can be seen in Figure 5. Their peaks are both around April and they both have
local maximum points in September. To determine the causal relationship, I ran a Granger
The Null hypothesis is that the pollen level does not Granger-cause the Tweet amount. If
the p-values are less than a significance level (0.05) then you reject the null hypothesis and
conclude that the said lag of X is indeed useful. In my experiment, when I set the lag as 4,
I got the smallest p-value, which is 0.0005. This indicates that the pollen amount affects
tweet count and 4 lags of pollen should be included in this causality. The Pearson
correlation coefficient between tweet count and the pollen level is 0.30 with p-value =
1.26e-08, which means that tweets count has a positive correlation with the pollen level.
Figure 5: Atlanta pollen level and tweet count
Topic Modeling
Before identifying the opinions, the optimum number of topics needs to be found.
I used GridSearch to determine the best hyperparameters. And the most important tuning
parameter for LDA models is the number of topics. Out of all 218,323 allergy-related
tweets returned by Tweeter's API, the highest log-likelihood from GridSearch was
Baseline
The first model I used is Gensim’s ldamodel, which is also the baseline model I set.
At 425 topics, Gensim had a coherence score of 0.48, a perplexity score of -15.34 . This is
not great; indeed the Mallet algorithm which I looked at next almost always outperforms
Gensim’s. Mallet (MAchine Learning for LanguagE Toolkit) is a Java-based package put
out by UMASS Amherst. The difference between Mallet and Gensim’s standard LDA is
that Gensim uses a Variational Bayes sampling method which is faster but less precise that
Mallet’s Gibbs Sampling.
To evaluate the results of Mallet version of LDA and compare it with Gensim’s
ldamodel, I used metrics like perplexity and coherence, along with eyeballing and model
visualizations.
Eyeballing
The most common approach to assessing the quality of topics is the “eyeballing”
approach, where topics are inspected deliberately and manually labelled (Morstatter and
Liu, 2018).
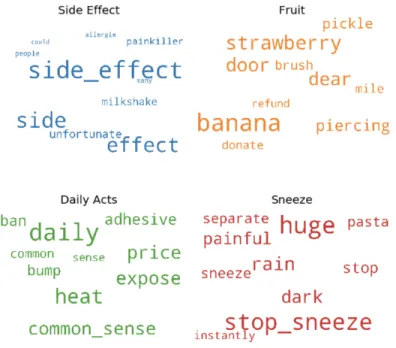
The top 10 topics associated with its keywords and weights are displayed in Table
2. Taken the first topic as an example, it is a represented as 0.354*"side_effect" +
0.288*"side" + 0.258*"effect" + 0.022*"unfortunate" + 0.019*"milkshake" +
0.016*"painkiller" + 0.007*"people" + 0.006*"many" + 0.006*"allergie" + 0.006*"could".
It means the top 10 keywords that contribute to this topic are: ‘side_effect’, ‘unfortunate’,
‘milkshake’, ‘painkiller’ and so on and the weight of ‘side_effect’ on this topic is 0.354.
those topics can be interpreted as side effect, fruit, and other topics under the consideration
of allergy.
Table 2: The top 10 topics generated from the LDA model.
Number Representation Label
1
0.354*"side_effect" + 0.288*"side" + 0.258*"effect" + 0.022*"unfortunate" + 0.019*"milkshake" + 0.016*"painkiller" + 0.007*"people" + 0.006*"many" + 0.006*"allergie" + 0.006*"could"
Side effect
2
0.186*"banana" + 0.119*"strawberry" + 0.110*"door" + 0.107*"dear" + 0.074*"piercing" + 0.061*"pickle" + 0.049*"brush" +
0.043*"mile" + 0.041*"donate" + 0.033*"refund"
Fruit
3
0.169*"daily" + 0.120*"heat" + 0.096*"expose" + 0.095*"price" + 0.091*"common_sense" + 0.064*"adhesive" + 0.061*"ban" +
0.055*"bump" + 0.041*"common" + 0.031*"sense"
Daily acts
4
0.170*"huge" + 0.155*"stop_sneeze" + 0.097*"rain" + 0.087*"dark" + 0.077*"painful" + 0.064*"stop" + 0.057*"sneeze" + 0.054*"pasta"
+ 0.054*"separate" + 0.035*"instantly"
Sneeze
5
0.368*"woman" + 0.088*"pregnant" + 0.082*"compare" + 0.063*"liquid" + 0.058*"memory" + 0.054*"suggestion" + 0.047*"loud" + 0.037*"washing" + 0.034*"alot" + 0.033*"outdoor"
Women
6 0.652*"allergic_reaction" + 0.272*"reaction" + 0.016*"cause" + 0.009*"give" + 0.008*"twitter" + 0.005*"go" + 0.004*"use" + 0.004*"time" + 0.004*"know" + 0.003*"lavender"
Allergy reaction
7
0.577*"take" + 0.126*"med" + 0.032*"onion" + 0.028*"help" + 0.023*"time" + 0.020*"almond" + 0.017*"need" + 0.017*"prescribe"
+ 0.016*"therapy" + 0.013*"ridiculous"
Medicine
8
0.310*"get" + 0.157*"sick" + 0.104*"stuff" + 0.056*"get_sick" + 0.036*"figure" + 0.032*"stupid" + 0.030*"put" + 0.029*"staff" +
0.027*"folk" + 0.026*"actually"
Sick
9
0.532*"food" + 0.120*"child" + 0.063*"people" + 0.049*"twitter" + 0.044*"many" + 0.039*"idea" + 0.018*"know" + 0.016*"give" +
0.016*"could" + 0.015*"foodallergie"
Food allergy
10 0.063*"make" + 0.063*"really" + 0.054*"good" + 0.053*"want" + 0.083*"think" + 0.081*"know" + 0.064*"go" + 0.063*"feel" + 0.050*"thing" + 0.046*"work"
Thoughts
Also, Figure 6 visualizes the first four of them are visualized using the world cloud
approach. The word cloud visualizations are consistent with the keyword weights of each
Figure 6: Word Clouds of Top 10 Keywords in Four Topics
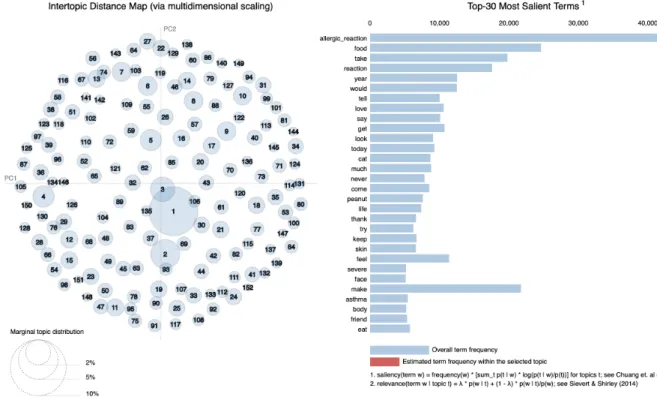
I used pyLDAvis in Python to render a more picturesque and realistic visualization.
It is the most widely used and a nice way to represent the information contained in a topic
model. Figure 7 shows the visualization of the LDA model and the most salient terms. The
left panel of the pyLDAvis graph presents a global view of the topic model. Within this
perspective, the topics are plotted as circles in the two-dimensional plane whose centers
are determined by computing the distance between topics, and then by using
multidimensional scaling to project the intertopic distances onto two dimensions, as is done
in (Chuang et al., 2012b). And the circle size is proportional to the topic's overall
prevalence in the corpus.
In my model visualization, the topic circles are distributed evenly in the 2d plane
with appropriate overlaps. The circle with the number 1 is the most prevalent one,
accounting for 7.6% of the tokens. In the right panel, the saliency measure is used for
ranking selecting relevant terms (Chuang et al., 2012a), which considers both term
are allergic_reaction, food, take, reaction, year, would, tell, love, say, get, look, today, cat,
much, never, come, peanut, life, thank, try, keep, skin, feel, severe, face, make, asthma,
body, friend, eat. These words mainly describe allergens (e.g., food, cat, peanut), allergy
symptoms (e.g., allergic_reaction, skin, asthma, face), and feelings (e.g., love, life, feel,
severe). It covers almost all the topics when people are talking about allergies.
Figure 7: The layout of LDAvis, with the global topic view on the left, and the term bar charts on the right.
This method of evaluation, while common, has the issue that it is ad-hoc and
time-consuming. It requires human labor to manually decide the quality of the results. This is a
major problem in the topic assessment as this evaluation can be subjective, sometimes
coming down to just one researcher who assigns definitions to the topics learned from the
model. To mitigate this issue, researchers have investigated imposing principled measures
different researcher may have a different interpretation of the top words (Morstatter and
Liu, 2018).
Topic Perplexity
Perplexity is one of the intrinsic evaluation metrics and is widely used for language
model evaluation. It captures how surprised a model is of new data it has not seen before
and is measured as the normalized log-likelihood of a held-out test set. Focussing on the
log-likelihood part, you can think of the perplexity metric as measuring how probable some
new unseen data is given the model that was learned earlier. In other words, how well does
the model represent or reproduce the statistics of the held-out data. The lower the perplexity,
the better the model.
The perplexity of my LDA model is -28.36, which means that the model is
satisfactory from the perplexity point of view. However, however, Chang et al. (2009)
found that perplexity does not always correlate with semantically interpretable topics.
Predictive likelihood (or equivalently, perplexity) and human judgement are often not
correlated, and even sometimes slightly anti-correlated. This limitation of perplexity
measure acted as a catalyst a motivation for further research trying to model the human
judgment, and hence topic coherence.
Topic Coherence
Topic coherence measures score a single topic by calculating the degree of semantic
similarity between high scoring words in the topic. These metrics help differentiate
between topics that are semantically interpretable topics and topics that are artifacts of
statistical inference. Among various coherence measures, I selected C_v implementation
words and an indirect confirmation measure that uses normalized pointwise mutual
information (NPMI) and the cosine similarity (Roder, Both and Hinneburg, 2015). The
C_v coherence score is from 0 to 1, the higher, the better. I got 0.67 coherence in my model.
From the perspective of the coherence score, the model proves itself again.
Content Analysis
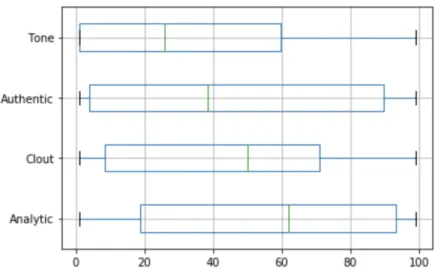
This section will present and discuss the LIWC results in detail. The average word
count of a tweet is 22.71 and the average number of words per sentence is13.40. Four
summary variables from the LIWC analysis are used (Figure 8). The mean of “Analytical
thinking” is 55.46, which is characterized by words suggesting logical, formal, or
hierarchical thinking. Scores on the “Authenticity” summary variable (language that
suggests revealing oneself in an honest way) is significantly high too, with the mean of
45.58. The next predominant dimension was “Authenticity” (mean=42.36), a variable that
refers to confidence, leadership, or social status. According to the LIWC documentation,
“a high number for Clout suggests that the author is speaking from the perspective of high
expertise and is confident; low Clout numbers suggest a more tentative, humble, even
anxious style” (Pennebaker et al., 2018). Scores on the “Emotional tone” (language
suggesting either positive or negative emotion) were lower than other variables, which is
Figure 8: Summary variables of language style of allergy-related tweets (n=111899)
We also measured a number of other language dimensions, such as the use of words
expressing different psychological processes, including emotional, social, perceptual and
cognitive processes and relativity-related words. Among all those dimensions, sentiment
analysis is an important part. The mean of positive emotion is 2.65 while the mean of
negative emotion is 3.65. To determine if negative emotions overwhelm positives, a
hypothesis test is necessary. The histograms in Figure 9 show the distribution of positive
and negative emotions. Obviously, they are not normally distributed. If the data does not
have the familiar Gaussian distribution, we must resort to the nonparametric version of the
significance tests. These tests operate in a similar manner, but are distribution free,
requiring that real-valued data be first transformed into rank data before the test can be
performed. In this study, I assume the positive emotion scores and negative emotion scores
are independent. In statistics, the Mann–Whitney U test (also called the Mann–Whitney–
Wilcoxon (MWW), Wilcoxon rank-sum test, or Wilcoxon–Mann–Whitney test) is a
nonparametric test of the null hypothesis that it is equally likely that a randomly selected
a second population. After conducting a one-sided Mann–Whitney U test, the statistic is
6696975603.0000 and P<0.001. The p-value strongly suggests that the sample distributions
are different, as is expected. As a result, it is true that LIWC’s negative emotion was
significantly higher than LIWC’s positive emotion.
Figure 9: Histograms of positive and negative emotion scores
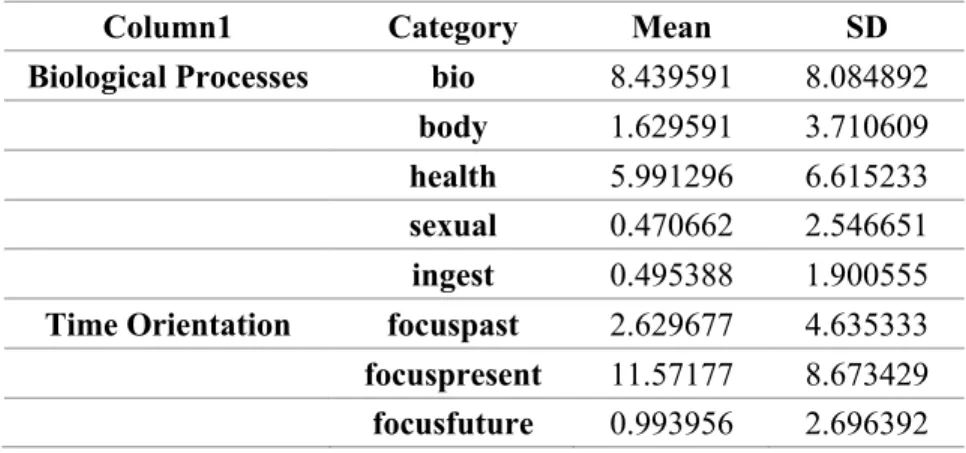
Moreover, there are some other interesting findings shown in Table 3.
Allergy-related tweets have relatively high scores in biology and health aspects, which is very easy
to understand. Also, people are talking about the present more, stating what they are
thinking or feeling now.
Table 3: Biological process and time orientation parts of the LIWC result
Column1 Category Mean SD
Discussion
Allergy is a common belief relating to public health. The study of individual
opinions by automated algorithmic techniques can be a useful method for better
characterizing a population's health opinions. Traditional public health polls and polls are
limited by small sample sizes; however, Twitter offers a forum for collecting a variety of
views and exchanging information shared in the tweeter's language. Research indicates that
there is a strong connection between Twitter health exchanges and the reports of the
Centers for Disease Control and Prevention (Prier, Smith, Giraud- Carrier, & Hanson,
2011).
This research provides a computational content analysis approach to conduct
in-depth analysis using a large data set of tweets. This framework decodes public health
opinions in the case of allergy-related tweets that can be applied to other public health
issues.
The time-series analysis showed the relationship between tweets and pollen. They
are highly correlated. The pollen amount affects tweet count and 4 lags of pollen should be
included in this causality. Also, I tracked how the trend of mentions of two different allergy
types differ over time. The tweet volume mentioning ‘pollen allergy’ rises very high during
the spring and the fall and remains very low in the summer. However, unlike pollen allergy,
the tweet volume mentioning ‘peanut allergy’ stays relatively constant throughout the year.
This observation implies that the seasonality observed in overall allergy dataset in figure 4
this finding. This paper addresses a need for clinical providers, public health experts, and
social scientists to utilize a large conversational data set to collect and utilize
population-level opinions and information needs. Although our framework is applied to Twitter, the
applications from this study can be used in patient communication devices monitored by
allergists with social media accounts, and support large scale population-wide initiatives
to help prevent allergy and alleviate allergic symptoms.
This research has some limitations. First, this study has some problems when
collecting data. It does not include nationwide pollen statistics. Certificated pollen counting
stations are located in every state and every county. It is difficult to collect the historical
pollen data of 2019 from all the stations and there is no universal definition of pollen count
at the nation-level. What it did is collecting 16 presentative cites and calculating their mean
pollen count as the national level while pollen levels may vary due to regional differences.
This analysis does not take the geographical location of Twitter users into consideration
either. Thus it does not reveal if certain geographical differences exist. Also, I used a
limited number of queries to select the initial pool of tweets, thus perhaps missing tweets
that may have been relevant to allergy but have used unusual terms referenced. And the
analysis only included tweets generated in 2019; however, public opinion can change
during years. Additionally, we did not track individuals across time to detect changes in
common themes discussed.
Second, this study does not evaluate the LDA model very thoroughly. LDA is
popular for text analysis, providing both a predictive and latent topic representation of the
corpus. However, there is a longstanding assumption that the latent space discovered by
challenging due to its unsupervised training process. Besides, there is a no-gold standard
list of topics to compare against every corpus. Nevertheless, it is equally important to
identify if a trained model is objectively good or bad, as well have an ability to compare
different models/methods. To do so, one would require an objective measure for quality.
Traditionally, and still for many practical applications, to evaluate if “the correct thing”
has been learned about the corpus, implicit knowledge and “eyeballing” approaches are
used. But the “traditional” approached are too subjective and inefficient. Moreover, the
perplexity metric has the limitation that it is not strongly correlated to human judgment and
even sometimes slightly anti-correlated (Chang et al., 2009). Chang et al. ran a large scale
experiment on the Amazon Mechanical Turk platform (2009). They ran a large scale
experiment on the Amazon Turk platform. For each topic, they took the five top words of
those topics and added a random sixth word. Then, they presented these lists of six words
to people asking them which is the intruder word. If all the people asked could tell which
is the intruder, then we can conclude safely that the topic is good at describing an idea. If
on the other hand, many people identified other words as the intruder, it means that they
could not see the logic into the association of words, and we can conclude the topic was
not good enough. The result proves that, given a topic, the five words that have the largest
frequency withing their topic are usually not good at describing one coherent idea; at least
not good enough to be able to recognize an intruder. And, optimizing for perplexity may
not yield human interpretable topics. As to the coherence score, it is the most advanced and
appropriate measure. This study got a 0.67 coherence score, and the results would be better
Third, this study took an unsupervised approach to analyze the content of the tweets,
especially sentiments using LIWC. And some researches show that many other tools have
better performance than the LIWC tool. For example, Crossley et al. tested a new sentiment
analysis tool, SEANCE, which is freely available to researchers and provides an automated
approach to the examination of discourse in terms of sentiment, cognition, and social order,
against the most common tool used in sentiment analysis for behavioral studies (LIWC)
and found that both the individual indices and the component scores statistically
outperformed LIWC in classic sentiment analysis tasks. What’s more, LIWC provides only
positive and negative emotions. Nevertheless, sentiments could also be extremely
positive/negative, slightly positive/negative or neutral. Last but not least, lexicon-based
Conclusion and Future Work
People eagerly share and post content on social media expressing their points of
view in an unrestricted way. The dimensionality and size of opinionated data are growing
exponentially and turn out to be valuable sources for text mining. This study represents one
of the early steps in developing routine processes to collect, analyze, and interpret
allergy-related posts to social media around health-allergy-related topics and presents a transdisciplinary
approach to analyzing public discussions around health topics.
This paper discovered the trends of allergy-related tweets using time series analysis,
clustered the topics by the LDA model and analyzed the contents via the LIWC2015 tool
in order to answer the research questions in the beginning. Taken the monthly pollen count
as ground truth data, the Pearson correlation coefficient between pollen level and tweets
count is 0.699 (p-value<0.01), which means there is a significant correlation between these
two attributes. The Granger causality test reveals that pollen counts change cause the tweets
count to vary. It's worth noting that pollen count and tweets count both have seasonal trends,
which might be explained by the weather/temperature. In the future, I would like to conduct
a time-series analysis of the daily temperature to find if there is any correlation between
temperature and tweet count. To solve the second research question, I built an LDA model
to cluster the allergy-related tweets into 152 topics. And I used three approached to evaluate
the model, eyeballing, perplexity (-28.36) and coherence (0.67). As the limitation of the
computation power, this research is based on only 10% of the data I crawled. However, the
likely achieve better results. The LIWC2015 tool is used to analyze the contents of tweets.
Especially, sentiment analysis is conducted to learn about the emotions of twitter users
when talking about allergies. And it turns out that people express negative emotions than
positives ones. Sentiment analysis using the LIWC is essentially lexicon-based. And I plan
to manually label the data and utilize machine learning techniques to do a supervised
classification job.
With billions of social media users, the ability to collect and synthesize social media
data will continue to grow. Considering that, my future research plans include introducing
a dynamic framework to collect and analyze allergy-related tweets during extended time
periods (multiple years) and incorporating spatial analysis of allergy-related tweets. And
developing methods to make this process more streamlined and robust will allow for more
References
American College of Allergy, Asthma, and Immunology. Allergy Facts.
http://acaai.org/news/facts-statistics/allergies (Retrieved March 14 2018)
A. Choudhary, W. Hendrix, K. Lee, D. Palsetia, and W.-K. Liao. Social media evolution
of the egyptian revolution. Commun. ACM, 55(5):74–80, May 2012.
Blei, D. M., Ng, A. Y., & Jordan, M. I. (2003). Latent dirichlet allocation. Journal of
machine Learning research, 3(Jan), 993-1022.
Chuang, J., Manning, C. D., & Heer, J. (2012, May). Termite: Visualization techniques
for assessing textual topic models. In Proceedings of the international working
conference on advanced visual interfaces (pp. 74-77).
Eichstaedt, J. C., Schwartz, H. A., Kern, M. L., Park, G., Labarthe, D. R., Merchant, R.
M., et al. (2015). Psychological language on Twitter predicts county-level heart
disease mortality. Psychological Science, 26(2), 159–169.
Gohil, S., Vuik, S., & Darzi, A. (2018). Sentiment analysis of health care tweets: review
of the methods used. JMIR public health and surveillance, 4(2), e43.
Jason Chuang, Daniel Ramage, Christopher D. Manning and Jeffrey Heer. 2012a.
Interpretation and Trust: Designing Model-Driven Visualizations for Text
Analysis. CHI.
J. Bollen, H. Mao, and X. Zeng. Twitter mood predicts the stock market. Journal of
Kapadia, S. (2019, August 19). Evaluate Topic Models: Latent Dirichlet Allocation
(LDA). Retrieved from
https://towardsdatascience.com/evaluate-topic-model-in-python-latent-dirichlet-allocation-lda-7d57484bb5d0
Karami, A., Dahl, A. A., Turner-McGrievy, G., Kharrazi, H. H. K., & Shaw, G. (2018).
Characterizing diabetes, diet, exercise, and obesity comments on Twitter.
International Journal of Information Management, 38(1), 1-6.
https://doi.org/10.1016/j.ijinfomgt.2017.08.002
Lee, K., Agrawal, A., & Choudhary, A. (2015, August). Mining social media streams to
improve public health allergy surveillance. In Proceedings of the 2015
IEEE/ACM International Conference on Advances in Social Networks Analysis
and Mining 2015 (pp. 815-822).
McConnell, T. H. (2013). The nature of disease: pathology for the health professions.
Lippincott Williams & Wilkins.
Mejova, Y., Weber, I., & Macy, M. W. (2015). Twitter: A digital socioscope. Cambridge
University Press.
Morstatter, F., & Liu, H. (2017). In search of coherence and consensus: measuring the
interpretability of statistical topics. The Journal of Machine Learning Research,
18(1), 6177-6208.
Nasukawa, T., & Yi, J. (2003). Sentiment analysis: Capturing favorability using natural
language processing. Proceedings of the 2nd international conference on
knowledge capture. ACM70–77.
Paul, M. J., & Dredze, M. (2011). You are what you tweet: Analyzing Twitter for public
Paul, M. J., & Dredze, M. (2012). A model for mining public health topics from Twitter.
Health, 11 16-6.
Pennebaker, J.W., Chung, C.K., Ireland, M., Gonzales, A., & Booth, R.J. (2007). The
development and psychometric properties of LIWC2007. Austin, TX: LIWC.net.
Pennebaker, J.W., Francis, M.E., & Booth, R.J. (2001). Linguistic inquiry and word
count: LIWC 2001. Mahwah, NJ: Lawrence Erlbaum Associates.
Pennebaker JW, Boyd RL, Jordan K, Blackburn K. The Development and Psychometric
Properties of LIWC 2015. https://repositories.lib.utexas.edu/
bitstream/handle/2152/31333/LIWC2015_LanguageManual.pdf. Accessed 22
Mar 2018.
Pleplé, Q. (2013, May). Perplexity To Evaluate Topic Models. Retrieved from
http://qpleple.com/perplexity-to-evaluate-topic-models/
Prier, K. W., Smith, M. S., Giraud-Carrier, C., & Hanson, C. L. (2011). Identifying
health-related topics on Twitter. International conference on social computing,
behavioral-cultural modeling, and prediction. Springer18–25.
Röder, M., Both, A., & Hinneburg, A. (2015, February). Exploring the space of topic
coherence measures. In Proceedings of the eighth ACM international conference
on Web search and data mining (pp. 399-408).
Skinner, A. (2016, August 6). What is Pollen? Master Gardener Newspaper, p. D5.
Statista (2019). Number of social media users worldwide from 2010 to 2020.
Summary Health Statistics Tables for U.S. Adults: National Health Interview Survey,
2017, Tables A-2b, A-2c https://robynobrien.com/25-billion-cost-food-allergies/
Tausczik, Y. R., & Pennebaker, J. W. (2010). The psychological meaning of words:
LIWC and computerized text analysis methods. Journal of language and social
psychology, 29(1), 24-54.
Tumasjan, A., Sprenger, T. O., Sandner, P. G., & Welpe, I. M. (2010). Predicting
elections with Twitter: What 140 characters reveal about political sentiment.
ICWSM 10.
T. Sakaki, M. Okazaki, and Y. Matsuo. Earthquake shakes twitter users: Real-time event
detection by social sensors. In In Proceedings of the Nineteenth International
WWW Conference (WWW2010). ACM, 2010.
Wang, W., Hernandez, I., Newman, D. A., He, J., & Bian, J. (2016). Twitter analysis:
Studying US weekly trends in work stress and emotion. Applied Psychology,
65(2), 355-378.
World Health Organization. White Book on Allergy 2011-2012 Executive Summary. By
Prof. Ruby Pawankar, MD, PhD, Prof. Giorgio Walkter Canonica, MD, Prof.