3.2
To be transmitted, data must be
transformed to electromagnetic signals.
3.3
3-1 ANALOG AND DIGITAL
Data can be analog or digital. The term analog data refers to information that is continuous; digital data refers to information that has discrete states. Analog data take on continuous values. Digital data take on discrete values.
Analog and Digital Data Analog and Digital Signals
3.4
Note
Data can be analog or digital.
Analog data are continuous and take
continuous values.
Signals
• Analog Signal
• An analog signal is a continuous wave denoted by a sine wave and may vary in
signal strength (amplitude) or frequency (time).
•Digital Signal
3.6
Signals can be analog or digital.
Analog signals can have an infinite number
of values in a range; digital signals can
have only a limited
number of values.
3.7
Both Analog and Digital signals can
take on of two forms:
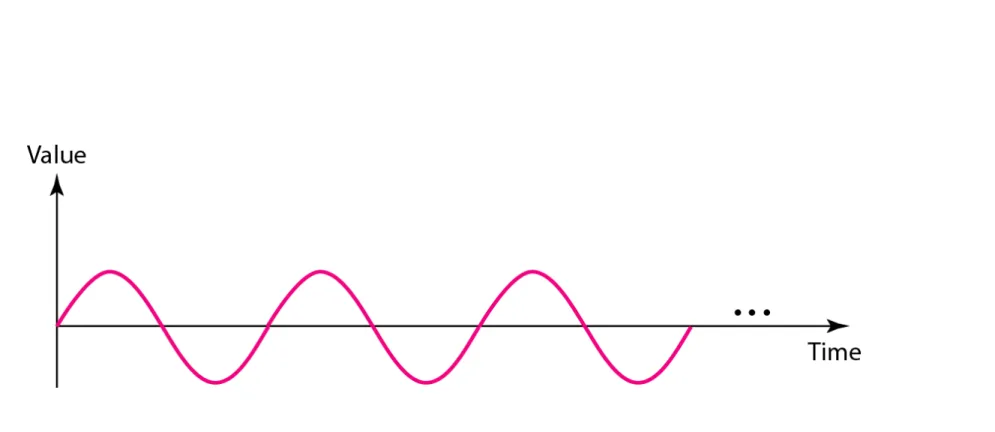
• Periodic Signal
• Aperiodic Signal
3.9
In data communications, we commonly use
periodic analog signals and nonperiodic
digital signals.
3.10
3-2 PERIODIC ANALOG SIGNALS
• Periodic analog signals can be classified as simple or composite.
• A simple periodic analog signal, a sine wave, cannot be decomposed into simpler signals.
• A composite periodic analog signal is composed of multiple sine waves.
Sine Wave Wavelength
Time and Frequency Domain Composite Signals
Bandwidth
3.11
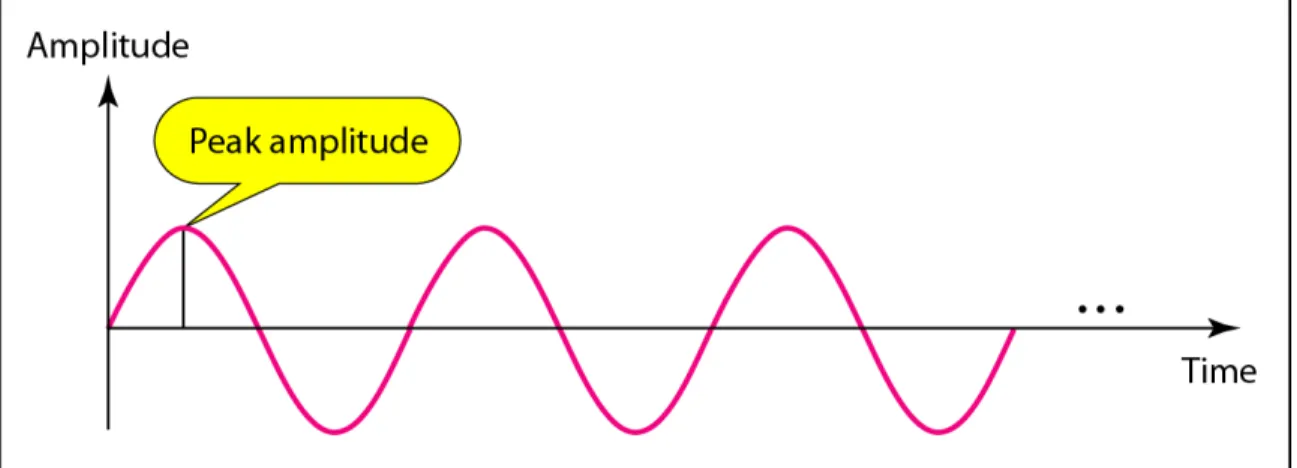
A sine wave can be represented by 3
parameters:
• Peak amplitude
• Frequency
• Phase
3.13
3.14
The voltage of a battery is a constant; this constant value can be considered a sine wave. For example, the peak value of an AA battery is normally 1.5 V.
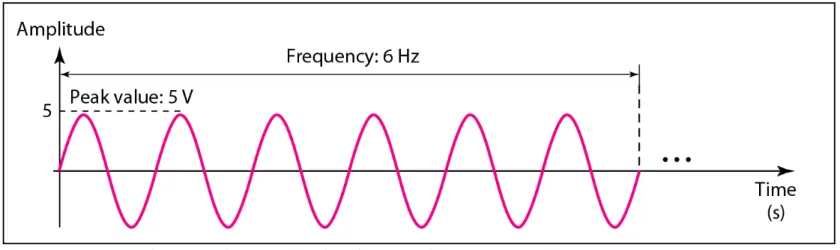
Period and Frequency
• Period : refers to the amount of time, in seconds, a signal needs to
complete one cycle.
• Frequency: refers to the number of periods in 1 sec.
OR
Frequency of the signal is the no. of times a signal makes a complete cycle within a given time frame.
3.16
Frequency and period are the inverse of
each other.
3.17
3.18
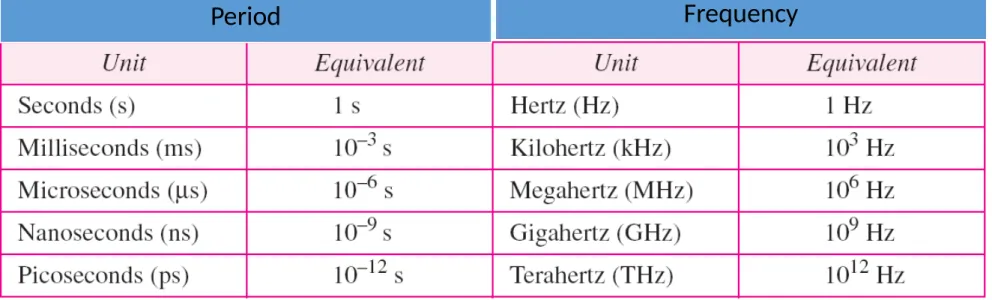
Table 3.1 Units of period and frequency
3.19
The power we use at home has a frequency of 60 Hz. The period of this sine wave can be determined as follows:
3.21
The period of a signal is 100 ms. What is its frequency in kilohertz?
Example 3.5
Solution
3.22
Frequency is the rate of change with
respect to time.
Change in a short span of time
means high frequency.
Change over a long span of
time means low frequency.
3.23
If a signal does not change at all, its
frequency is zero.
If a signal changes instantaneously, its
frequency is infinite.
Time and Frequency Domains
• A signal can be represented as a function of time, i.e. it varies with
time.
• However, it can be also expressed as a function of frequency, i.e. a
signal can be considered as a composition of different frequency components.
• Thus, a signal has both time-domain and frequency domain
representation.
Time-Domain and Frequency
Domain plot
• Time-Domain plot shows changes in signal amplitude w.r.t time.
• Frequency Domain plot show the relationship between amplitude and
frequency. This plot is only concerned with the peak value and the frequency.
3.32
3.33
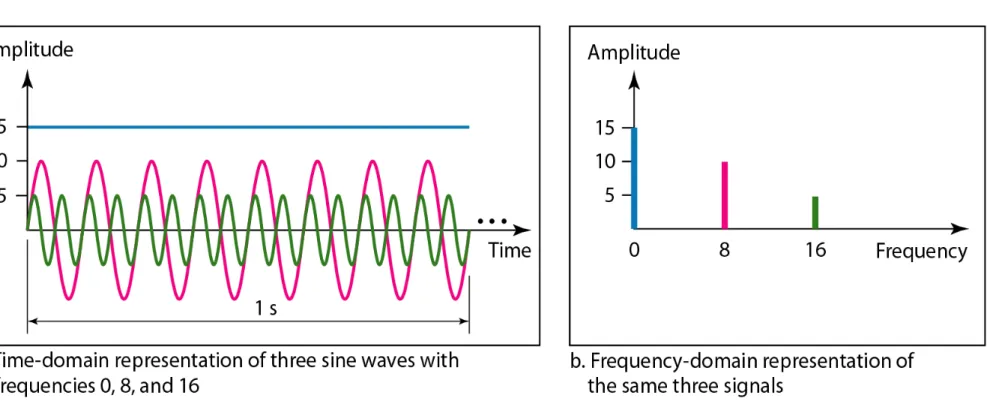
A complete sine wave in the time domain
can be represented by one single spike in
the frequency domain.
3.34
The frequency domain is more compact and useful when we are dealing with more than one sine wave. For example, Figure 3.8 shows three sine waves, each with different amplitude and frequency. All can be represented by three spikes in the frequency domain.
3.35
3.36
A single-frequency sine wave is not useful
in data communications;
we need to send a composite signal, a
signal made of many simple sine waves.
3.37
According to Fourier analysis, any
composite signal is a combination of
simple sine waves with different
frequencies, amplitudes, and phases.
3.38
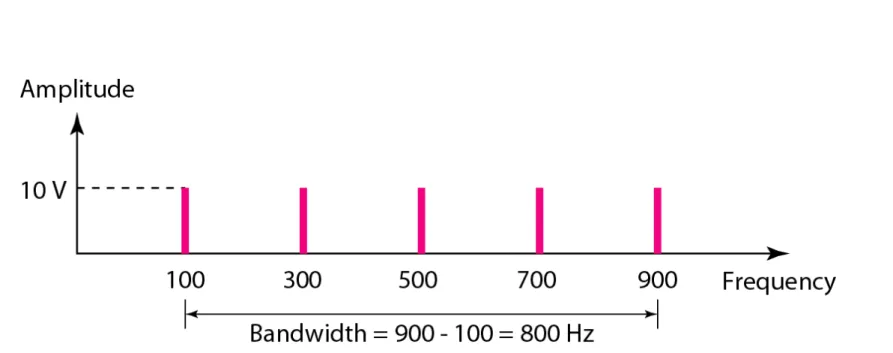
The bandwidth of a composite signal is the difference between the
highest and the lowest frequencies contained in that signal.
3.39
3.40
If a periodic signal is decomposed into five sine waves with frequencies of 100, 300, 500, 700, and
900 Hz, what is its bandwidth? Draw the spectrum, assuming all components have a maximum
amplitude of 10 V.
Solution
Let fh be the highest frequency, fl the lowest frequency, and B the bandwidth. Then
Example 3.10
3.41
3.42
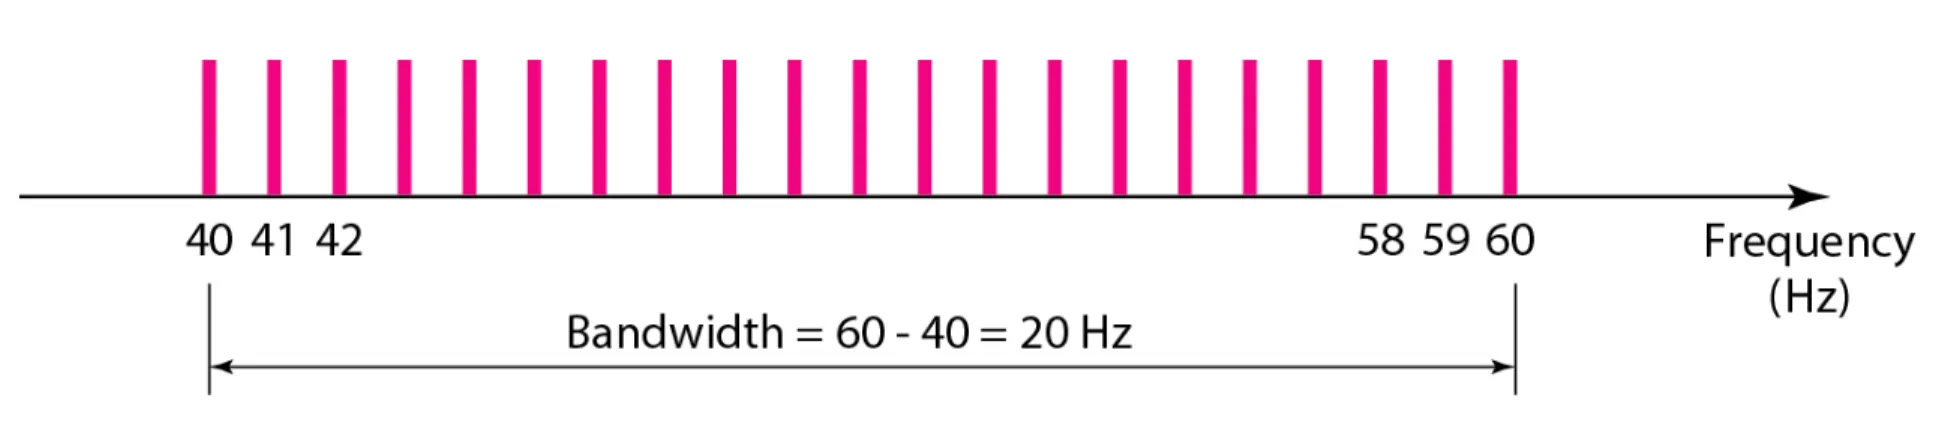
A periodic signal has a bandwidth of 20 Hz. The highest frequency is 60 Hz. What is the lowest
frequency? Draw the spectrum if the signal contains all frequencies of the same amplitude.
Solution
Let fh be the highest frequency, fl the lowest frequency, and B the bandwidth. Then
Example 3.11
The spectrum contains all integer frequencies. We show this by a series of spikes (see Figure
3.43
3.44
3-3 DIGITAL SIGNALS
A digital signal refers to an electrical signal that is converted into a pattern of bits.
3.45
3-4 TRANSMISSION IMPAIRMENT
Signals travel through transmission media, which are not perfect. The imperfection causes signal impairment. This means that the signal at the beginning of the medium is not the same as the signal at the end of the medium. What is sent is not what is received. Three causes of impairment are attenuation, distortion, and noise.
Attenuation
Distortion
Noise
3.46
Attenuation
• Attenuation means a loss of energy
• Attenuation is measured in decibels(dB). It measures the relative
strengths of two signals or one signal at two different point.
• Attenuation(dB) = 10log10(P2/P1)
3.48
3.49
Suppose a signal travels through a transmission medium and its power is reduced to one-half.
This means that P2 is (1/2)P1. In this case, the attenuation (loss of power) can be calculated as
3.51
A signal travels through an amplifier, and its power is increased 10 times. This means that P2 =
10P1 . In this case, the amplification (gain of power) can be calculated as
Distortion
Noise
• The random or unwanted signal that mixes up with the original signal
is called noise.
• There are several types of noise such as :
• Induced noise • Crosstalk noise
3.55
Signal-to-Noise Ratio (SNR)
• It is a measure that compares the level of a desired signal to the level
of background noise.
• SNR is defined as the ratio of average signal power to the average
noise power, often expressed in decibels.
3.57
The power of a signal is 10 mW and the power of the noise is 1 μW; what are the values of SNR
and SNRdB ?
Solution
Data Rate
• Nyquist