https://openaccess.leidenuniv.nl
License: Article 25fa pilot End User Agreement
This publication is distributed under the terms of Article 25fa of the Dutch Copyright Act (Auteurswet) with explicit consent by the author. Dutch law entitles the maker of a short scientific work funded either wholly or partially by Dutch public funds to make that work publicly available for no consideration following a reasonable period of time after the work was first published, provided that clear reference is made to the source of the first publication of the work.
This publication is distributed under The Association of Universities in the Netherlands (VSNU) ‘Article 25fa implementation’ pilot project. In this pilot research outputs of researchers employed by Dutch Universities that comply with the legal requirements of Article 25fa of the Dutch Copyright Act are distributed online and free of cost or other barriers in institutional repositories. Research outputs are distributed six months after their first online publication in the original published version and with proper attribution to the source of the original publication.
You are permitted to download and use the publication for personal purposes. All rights remain with the author(s) and/or copyrights owner(s) of this work. Any use of the publication other than authorised under this licence or copyright law is prohibited.
If you believe that digital publication of certain material infringes any of your rights or (privacy) interests, please let the Library know, stating your reasons. In case of a legitimate complaint, the Library will make the material inaccessible and/or remove it from the website. Please contact the Library through email:
Article details
Meijer M.S., Rojas-Gutierrez P.A., Busko D., Howard I.A., Frenze F., Wuerth C., Resch-Genger U., Richards B.S., Turshatov A., Capobianco J.A. & Bonnet S. (2018), Absolute upconversion quantum yields of blue- emitting LiYF4: Yb3+, Tm3+upconverting nanoparticles, Physical Chemistry Chemical Physics 20(35): 22556-22562.
Cite this:Phys. Chem. Chem. Phys.,
2018,20, 22556
Absolute upconversion quantum yields of
blue-emitting LiYF
4
:Yb
3+
,Tm
3+
upconverting
nanoparticles
†
Michael S. Meijer, aPaola A. Rojas-Gutierrez, bDmitry Busko,c
Ian A. Howard, cd Florian Frenzel,eChristian Wu¨rth, eUte Resch-Genger, e Bryce S. Richards, cdAndrey Turshatov, cJohn A. Capobianco *band Sylvestre Bonnet *a
The upconversion quantum yield (FUC) is an essential parameter for the characterization of the
optical performance of lanthanoid-doped upconverting nanoparticles (UCNPs). Despite its nonlinear dependence on excitation power density (Pexc), it is typically reported only as a single number. Here, we present the first measurement of absolute upconversion quantum yields of the individual emission bands of blue light-emitting LiYF4:Yb3+,Tm3+UCNPs in toluene. Reporting the quantum yields for the individual
emission bands is required for assessing the usability of UCNPs in various applications that require upconverted light of different wavelengths, such as bioimaging, photocatalysis and phototherapy. Here, the reliability of theFUCmeasurements is demonstrated by studying the same batch of UCNPs in three
different research groups. The results show that whereas the total upconversion quantum yield of these UCNPs is quite high—typically 0.02 at a power density of 5 W cm2—most of the upconverted photon flux is emitted in the 794 nm upconversion band, while the blue emission band at 480 nm is very weak, with a much lower quantum yield ofB6105at 5 W cm2. Overall, although the total upconversion quantum yield of LiYF4:Yb3+,Tm3+ UCNPs seems satisfying, notably for NIR bioimaging, blue-light
demanding phototherapy applications will require better-performing UCNPs with higher blue light upconversion quantum yields.
Introduction
Lanthanoid-doped upconverting nanoparticles (UCNPs) have attracted much attention over the last two decades as a result of their wide range of potential applications in bio-imaging and biosensing,1–4drug delivery,5phototherapy,6–9optical thermo-metry,10–12 photocatalysis,13–15 photovoltaics,16 or security.17 These nanomaterials show multiple sharp emission bands in the visible region of the spectrum upon sequential absorption of two or more near-infrared (NIR) photons, a non-linear
process known as photon upconversion (UC). Typically, UCNPs have a crystalline fluoride host lattice, such as NaYF4, doped
with one or more lanthanoid ions. Most commonly, Yb3+ions, capable of absorbing NIR light around 980 nm, are used as sensitizers, while secondary dopants, e.g. Er3+, Tm3+, or Ho3+ ions, are introduced in the crystal lattice as emitting activators, depending on the desired emission wavelength(s).18–20Compared to other upconverting systems, such as triplet–triplet annihilation upconversion (TTA-UC), UCNPs show long (ms) luminescence lifetimes, high photostability, insensitivity towards molecular oxygen, and no photoblinking.21,22In bio-imaging and photo-therapy the use of NIR excitation is highly beneficial as it eliminates background fluorescence and reduces scattering, with the advantage of increased penetration depth of the excitation light.23
Initially, the main drawbacks of UCNPs were their low absorption cross-section and low internal upconversion photo-luminescence quantum yields (FUC); high excitation power densities (Pexc420 W cm2) were often required to effectively
trigger photochemical reactions using UCNPs.24 In response to this shortcoming, a multitude of innovative strategies have
aLeiden Institute of Chemistry, Leiden University, Gorlaeus Laboratories,
P.O. Box 9502, 2300 RA Leiden, The Netherlands. E-mail: [email protected]
b
Department of Chemistry and Biochemistry, and Centre for NanoScience Research, Concordia University, Montreal, Quebec, H4B 1R6, Canada.
E-mail: [email protected]
cInstitute of Microstructure Technology, Karlsruhe Institute of Technology,
Hermann-von-Helmholtz-Platz 1, 76344 Eggenstein-Leopoldshafen, Germany
dLight Technology Institute, Karlsruhe Institute of Technology, Engesserstrasse 13,
76131 Karlsruhe, Germany
eFederal Institute for Materials Research and Testing (BAM), Division Biophotonics,
Richard-Willsta¨tter-Straße 11, 12489 Berlin, Germany
†Electronic supplementary information (ESI) available. See DOI: 10.1039/c8cp03935f Received 21st June 2018,
Accepted 16th August 2018
DOI: 10.1039/c8cp03935f
rsc.li/pccp
PCCP
been developed to increase the brightness of UCNPs, such as the application of core–shell structures or decoration of the surface with dyes to increase light absorption.25–28As a result of
these efforts, 10- to 500-fold enhancement of the luminescence intensity has been reported, which appears to bring UCNPs to the efficiency level of other UC systems, such as those based on triplet–triplet annihilation upconversion (TTA-UC) that typically requirePexcon the level of mW cm2.29–31Yet still, the daily practice
requires several W cm2of NIR light to obtain significant effects in phototherapy using UCNPs, in particular when large amounts of blue or UV light are required. The aim of this collaborative paper was to investigate where this apparent discrepancy comes from; for example, why do systems containing UCNPs that showB2% overall FUC still require long irradiation times (42 h) and high Pexc to
trigger blue-light sensitive photoreactions?
For a long time, most studies have focused on reporting upconversion intensities relative to other batches of UCNPs prepared in the same research laboratory. The broad range (from the UV to the NIR) and anti-Stokes nature of UCNP emission render the determination of quantum yields relative to a reference, such as an organic dye, very difficult,32thereby
eliminating the method commonly used for the determination of the quantum yields of molecular dye solutions or dispersions of semiconductor quantum dots.33 Furthermore, the lack of upconverting reference materials makes it a priori difficult to compare upconverting quantum yield values reported by different laboratories. Recently, the number of studies involving absolute measurements of FUC has increased, in particular for Er- or
Ho-doped UCNPs. This provided not only a few benchmark values, but also shone light upon the effect of excitation power density, particle size, and shell coating on the upconversion quantum yield.34–43To the best of our knowledge, the highest upconversion quantum yields for UCNPs were reported for 40 nm LiLuF4:Yb3+,Er3+ UCNPs (FUC = 0.050) and LiLuF4:Yb3+,Tm3+
UCNPs (FUC= 0.072).44However, even when absolutely measured
FUC values are provided, the methodologies for determining them are not always identical, and FUCvalues are not seldom given as a single number without specific mention of the power density used for the measurement – probably for the sake of simplicity.
While some studies exist that report on the relative efficiencies of thulium(III) emission lines,10,45,46these studies rarely provide
absolutely measured FUC values for these individual emission
lines. Furthermore, as the NIR emissions in Tm-doped materials are known to be multiple orders of magnitude more intense than the blue emissions,20,47,48 the efficiency of the blue emission bands cannot easily be deduced from their overallFUC,49 and thus remains essentially unknown.
This situation, and the lively discussions within the European COST Action 1403 on upconverting materials, encouraged us to assess theFUCof the individual upconversion bands of LiYF4:
Yb3+,Tm3+UCNPs. LiYF4was selected as it has been proposed as
a very efficient host lattice for Tm-based UC nanomaterials, but its efficiency had not yet been studied with absolute methods.50 In order to also assess the challenges and factors governing the reliability of such measurements, we independently determined
the FUC of the UCNPs in three European research groups (in
Leiden, Karlsruhe, and Berlin) using absolute integrating sphere setups of different complexity. We discuss herein the setups, methodologies, and data from the three groups, to identify which parameters must be controlled for providing accurate and reliableFUCvalues. The effects of power density, temperature, and excitation wavelength on theFUCvalues are also discussed.
Results and discussion
The tetragonal LiYF4:Yb3+,Tm3+(25% Yb3+, 0.5% Tm3+) UCNPs
were synthesized as reported following a two-step thermal decomposition procedure.50,51 Using transmission electron microscopy (TEM) it was shown that these oleate-capped UCNPs have a diamond-like morphology with an average size of 87
9 nm along the long diagonal and 50 4 nm along the short diagonal. A second batch of LiYF4nanoparticles was synthesized
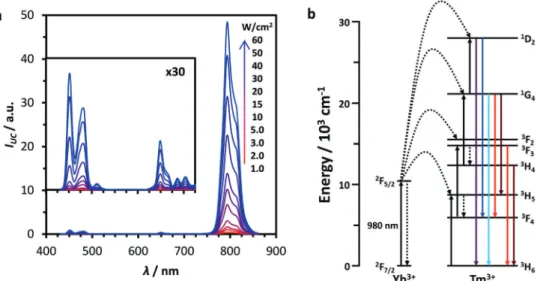
without the lanthanoid dopants. These undoped nanoparticles showed a morphology and size (87 6 nm by 48 3.5 nm) similar to the doped UCNPs, and served as a blank sample for some of the FUC determinations (vide infra). Powder X-ray diffraction (XRD) spectra, TEM images and size distributions are shown in the ESI†(Fig. S1–S3). Under NIR light excitation the UC emission spectrum of the Tm-doped UCNPs is clearly dominated by an emission band around 794 nm (Fig. 1). This emission stems mainly from the thulium3H4-3H6transition,
with a small contribution from the1G4 - 3H5 transition. In
addition, several blue and red Tm-based emission features are present, most notably around 451 nm (1D2 - 3F4), 480 nm
(1G4-3H6), and 649 nm (1G4-3F4). These emission bands are
caused by three- and four-photon upconversion processes, and are multiple orders of magnitude less intense than the 794 nm emission band, resulting predominantly from a two-photon process.
The efficiency of the upconversion process in LiYF4:Yb3+,
Tm3+UCNPs in toluene dispersion was assessed by measuring FUCabsolutely, as defined by eqn (1).
FUC¼
number of photons emitted number of photons absorbed¼
qp-em
qp-abs (1)
In this equation,qp-emis the upconverted emission photon
flux (in photons s1) andqp-absis the photon flux absorbed by
the sensitizer species (in photons s1). The assessment of FUC
was performed independently by the Leiden, Karlsruhe and Berlin research groups, using their respective standard meth-ods and instrumentation. All three groups employed measure-ment setups comprising of integrating spheres and fiber-coupled CCD spectrometers. Continuous wave (CW) laser diodes were used as the excitation source in all setups, although varying slightly in excitation wavelength. In Leiden, a 969 nm laser diode was employed, whereas excitation in Karlsruhe and Berlin was performed at 980 and 976 nm, respectively.
Measurements in Leiden were performed using the method described by Boyer and Van Veggel.34An sample of LiYF4UCNPs
of similar size and morphology but without dopant was utilized
as blank to ensure correction for the scattering properties of the UCNPs. In Karlsruhe, the three-measurement (3M) method previously described by De Melloet al. was used.52,53 Rather than measuring a blank sample, in this method correction for scattering and the absorption of scattered photons is achieved by performing a series of three measurements, namely (a) irradiation of the empty sphere, (b) irradiation of the sample inside the sphere, but not directly in the path of the excitation beam (indirect excitation), and (c) irradiation of the sample inside the sphere and directly in the beam path (direct excitation). The measurement method utilized in Berlin is similar to the method employed in Leiden, and has been described previously.36
In all systems, absorption and emission measurements were conducted separately in order to cope with the significant difference in intensity between the excitation light and the UC emission.FUCvalues were measured at a high UCNP concentration (up to 40 mg mL1) to ensure sufficient absorption (3–6%) of the excitation light. A full description of all three measurement setups is
given in the ESI†(Sections S3–S7), and the resultingFUCvalues are reported in Table 1 and Table S1 (ESI†).
The total internal upconversion photoluminescence quantum yield (FUC,total), determined by the integration of the UC spectra
from 430 to 860 nm, at an excitation power density of 5.0 W cm2 was determined to be 0.0260.008 in Leiden, which is in good agreement with the value found in Karlsruhe (0.0250.003), and slightly above the value found in Berlin (0.01890.0005,Pexc=
5.5 W cm2). As explained above, it would be tempting to use FUC,totalas the sole way to quantify the efficiency of the UCNPs.
However, in most applications only a fraction of the emission spectrum can be used. For example, if a dye or light-activated compound only absorbs blue light, then the 794 nm emission is not useful. Therefore, it can be much more relevant to report theFUCvalues for the individual emission bands, as shown in Table 1 and Table S1 (ESI†). For example, at aPexcof 5 W cm2,
the blue emission bands around 451 and 480 nm account only for 0.02–0.06% and 0.2–0.3% of the total UC emission, respectively,
Table 1 Upconversion photoluminescence quantum yields (FUC) for LiYF4:Yb3+,Tm3+UCNPs. Leiden data points forPexc= 0.07, 1.0 and 50 W cm2
were measured relative to the absolute value at 5.0 W cm2;T= 293 K. The full data sets are shown in Table S1 (ESI)
Pexc[W cm2] FUC,451 FUC,480 FUC,649 FUC,794 FUC,total
Leidena 0.07 n.d. n.d. n.d. 0.009(3) 0.009(3)
1.0 6(2)107 2.1(7)105 1.1(4)105 0.019(6) 0.019(6)
5.0 7(2)106 7(2)105 3.3(10)105 0.026(8) 0.026(8)
50 2.3(7)104 2.8(9)104 1.4(5)104 0.035(11) 0.035(11)
Karlsruheb 0.20 n.d. n.d. n.d. 0.009(1) 0.009(1)
0.95 n.d. n.d. n.d. 0.017(2) 0.017(2)
5.0 1.6(10)105 6.3(18)105 n.d. 0.025(3) 0.025(3)
13.5 4.5(14)105 1.2(2)104 6.7(19)105 0.029(3) 0.029(3)
Berlinc 5.5 3.0106 4.48(2)105 2.54(3)105 0.0188 0.0189(5)
48 9.08(5)105 1.65(1)104 8.48(5)105 0.0255 0.0260(6)
212 7.1104 5.15(3)104 2.63104 0.0310 0.034(2)
395 1.37103 8.78(2)104 4.24(1)104 0.0325 0.0371(7)
al
exc= 969 nm.blexc= 980 nm.clexc= 976 nm; n.d.: not determined. Uncertainties on the final digit are presented in parantheses. Fig. 1 (a) Emission intensity (IUC) of LiYF4:Yb3+,Tm3+(25%, 0.5%) UCNPs in toluene (10 mg mL
1) recorded in Leiden at variousP
exc(1.0–60 W cm 2, lexc= 969 nm,T= 293 K). Comparable results were obtained in Karlsruhe and Berlin (Fig. S6, ESI†). (b) Simplified energy level diagram depicting the
while 99.4% of the UC emission stems from the 2-photon NIR emission band around 794 nm. As a NIR-to-blue upconverting system at thisPexc, these UCNPs are thus best characterized by
their blue emission quantum yield (FUC,blue) of 4.8–7.9 105,
rather than by their more encouraging total emission quantum yield (FUC,total) of 0.019–0.026.
Another difficulty in reporting and comparing upconversion quantum yields is thatFUCis highly dependent on the power density of the excitation beam, as upconversion is a non-linear multiphoton process. At lowPexc, the observed emission intensity, IUC, is proportional toPn, wherePis the excitation power density,
andn is the so-called slope factor, indicative of the number of photons involved in the process.54,55Hence, on a log–log plot,IUC
is proportional ton, wherenis the slope of the linear least-squares curve through the data points (Fig. S4 and S7, ESI†). As Pexc
increases, saturation of the intermediate excited states occurs, andn slowly reduces to 1. As the upconversion quantum yield, FUC, is proportional toP(n1), it becomes constant at highPexc; a
regime often referred to as the saturation regime. Ideally,FUCis measured in this saturated regime, where the value is maximal, and less dependent onPexc. However, as Yb,Tm-doped UCNPs
show multiple emission bands, each with their own power dependency, it is impossible to determine a single saturation point for the whole system. Furthermore, complete saturation of all these emission bands will not be observed unless extremely highPexcare used (4400 W cm2). Such irradiation conditions
are not available with all experimental setups, and generally speaking irrelevant for the intended applications of UCNPs, so thatFUCreported in many articles, including ours, is typically Pexc-dependent.
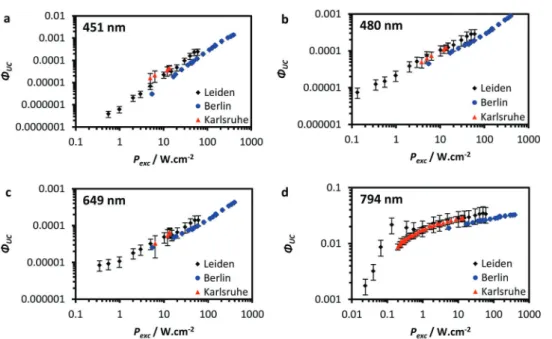
The Pexc dependency of the upconverted emission of the
LiYF4:Yb3+,Tm3+UCNPs (Fig. 2 and Table 1) was examined for
the four dominant emission bands. Using the three different
spectroscopic setups, we were able to examine thePexcdependence
over three to four orders of magnitude, a larger range than typically possible for most setups. In Karlsruhe and Berlin,FUCvalues were obtained absolutely, following the same protocol described above. In Leiden, limitations in the output power stability of the laser diode precluded directFUCmeasurements at highPexc. Thus, the
emission intensity was measured relative to the emission intensity at 5.0 W cm2, and subsequently converted to aFUCvalue using the absoluteFUCvalues determined at 5.0 W cm2. Importantly, despite the differences in setup design and measurement protocols, the results from the different groups are in very good agreement.
In spite of this good overall agreement, we did observe that the FUC values obtained on the Berlin setup are typically
somewhat lower than those obtained in Leiden and Karlsruhe (Fig. 2). We believe that this may, in part, be attributed to the difference in beam profile used for the measurements. Whereas the measurements in Berlin were performed using a top-hat beam profile, the other setups employed more commonly used near-Gaussian beam profiles. As a result of the Gaussian beam profile, thePexcis not homogeneous throughout the sample, and
thus, at many points in the sample, deviates from the reported averagePexc. Due to the multiphotonic nature of the upconversion
process, these deviations lead to local variations in upconversion efficiency throughout the sample that have been shown to potentially result in a higher apparent (i.e.spatially averaged) FUC, especially in the unsaturatedPexc-regime.36
For the two-photon3H4-3H6emission band at 794 nm, the
onset of the saturation regime was observed around 0.1 W cm2, whereafter the slope factor n dropped from 2.5 to about 1.1 (Fig. 2d and Fig. S4, S7e, ESI†). Contributions from the three-photon1G4 -3H5 process to the 794 nm emission band may
explain the fact thatn42.0 for lowPexc, as well as the incomplete
Fig. 2 Pexcdependence ofFUCof the thulium emission bands at (a) 451 nm, (b) 480 nm, (c) 649 nm, and (d) 794 nm in LiYF4:Yb3+,Tm3+UCNPs in
toluene, measured in Leiden (black diamonds), Berlin (blue circles), and Karlsruhe (red triangles).
saturation (n41.0) at higherPexc.46No saturation is found for
the three major visible bands, and the slopes in Fig. 2a–c are virtually constant. Close examination of the four-photon blue emission band at 451 nm (1D
2 -3F4) reveals that the slope is
reduced fromn= 2.8 to 2.0 asPexcis increased to 395 W cm2
(Fig. S7e, ESI†). This suggests that the first excited thulium state is saturated, but also indicates that the higher excited states in the thulium ions involved are far from saturation. Similarly, the three-photon emission features around 480 nm (1G4-3H6) and
649 nm (1G4-3F4), both show a slope factor of 1.6, that changes
relatively little over the studiedPexcrange. AsPexcin this study
was limited to 395 W cm2, no saturation values for FUC,451,
FUC,480, andFUC,649can be given. Instead, in Table 1 and Fig. 2,
FUCfor these emission bands are given for various values ofPexc.
Additionally, the lifetime of the downconverted Yb3+emission at 998 nm (2F5/2-2F7/2) was measured in Karlsruhe (Fig. S12, ESI†),
and, as expected, was found to decrease upon an increase ofPexc,
from 0.69 ms (Pexc= 10 W cm2) to 0.38 ms (Pexc= 220 W cm2).
Although the relative contributions of the visible emission bands increase for higher Pexc, at 395 W cm2 the 794 nm
emission still makes up 88% of the total emission, with the blue emission bands accounting for 2.4% (480 nm) and 3.7% (451 nm) of the total emission, respectively. The maximalFUC measured for the total emission is 0.0371(7) (Berlin, Pexc =
394.9(6) W cm2), while all the individual visible light emission showed quantum yields between 1104and 1.4103(Fig. 2 and Fig. S7, Table 1 and Table S1, ESI†). In comparison, Mousavi et al. recently reported a FUC,794 of 0.0039 at
14 W cm2 for NaYF4:Yb3+,Tm3+ (25%, 0.3%) UCNPs, which
makes it tempting to conclude that the LiYF4host lattice used
in this work (FUC,794= 0.022–0.029 at 152 W cm2) is more
efficient, at least for NIR-to-NIR upconversion.32However, the use of a different solvent (cyclohexaneversustoluene), different dopant concentrations, and the smaller size of the NaYF4
particles (f = 32 nm) preclude a direct comparison between the two values.
When high power densities are used for obtaining blue light, the temperature of the upconverting sample may rise. Thus, the effect of temperature on the relative UC efficiency was examined, performing emission spectroscopy in a temperature-controlled cuvette holder. Although an optimum of theFUC,totalwas found around 181C (FUC,total= 0.026), and upon heating the sample to 601C a 10% reduction in the overall emission was observed, no strong dependence of FUC,total on the temperature was found (Fig. S11 and Table S2, ESI†). Thus, the temperature is of minor importance for upconversion quantum yields of LiYF4:Yb3+,Tm3+
UCNPs, compared to the influence of other factors such as the surface coating or the nature of the solvent.38,51
Finally, as the FUC studies in Leiden and Karlsruhe were
performed using different excitation wavelengths (969 and 980 nm, respectively (see Table 1)), also the influence of this parameter on the emission intensity and FUC was assessed.
Fig. 3a depicts the integrated emission intensity of the NIR and blue emission bands as a function of excitation wavelength (excitation spectrum), which is in good agreement with the absorption spectrum of the LiYF4:Yb3+,Tm3+UCNPs (Fig. S10,
ESI†). Only small differences in emission intensity can be observed between exciting at 969 and 980 nm. However, the sharp peak in the excitation spectrum in Fig. 3a around 960 nm implies that the UC emission is far brighter at this excitation wavelength, compared to the conventional 980 nm excitation. An explanation of these results can be found by looking at the fine structure of the2F7/2-2F5/2transition in Yb3+ions. Under
the influence of the crystal field, the Yb3+energy levels split into a number of so-called Stark splitting levels (four and three levels for2F7/2and2F5/2, respectively), resulting in several absorption
bands corresponding to the2F7/2(n = 0)- 2F5/2(n= 00, 10, 20)
electronic transitions. The absorption between 970 nm and 990 nm is attributed to the 0 - 00 transition, whereas the absorption bands near 960 nm and 930 nm correspond to the 0-10and 0-20transitions, respectively.56The relative intensity
of these transitions is strongly influenced by the symmetry of
Fig. 3 (a) Normalized excitation spectrum recorded in Karlsruhe of LiYF4:Yb3+,Tm3+UCNPs in toluene (10 mg mL1) for 480 nm and 794 nm emission
bands. Spectra were corrected for the small difference inPexc, assumingn= 1.1 (794 nm) and 1.6 (480 nm). (b) Upconverted emission spectra recorded in
the host lattice. Here, the tetragonal LiYF4host (scheelite structure)
favors the 0-10 transition, in contrast to the hexagonal NaYF4
host, for which the 0-00transition is dominant. The preference
towards the 0-10transition has been demonstrated before for
LiYF4single crystals doped with Yb3+ions.56,57Thus, in order to
achieve maximal upconversion brightness, evaluation of the optimal excitation wavelength is crucial for every new host material. In the case of LiYF4, the emission intensities of the
NIR and blue UC bands increased considerably upon 960 nm excitation, by a factor ofB3 for the NIR emission andB6 for the blue emission compared to 980 nm excitation at the used excitation power density (Fig. 3b). Considering the good agreement between the excitation spectrum depicted in Fig. 3a and the absorption spectrum in Fig. S10 (ESI†), we assume that the observed increase in UC emission intensity is caused by the increased absorption at 960 nm, rather than by a significant increase inFUC.
Conclusions
In this work, we have presented the first multicenter absolute measurement of upconversion photoluminescence quantum yields (FUC) of UCNPs, and provided the first FUC values for LiYF4:Yb3+,Tm3+UCNPs. These measurements have been
per-formed independently by three research groups, but using the same batch of nanomaterials. In spite of the quite different setups and methods used in the three labs, strikingly similar values were obtained, which underline that these measurements can give reproducible results not only when using state-of-the-art setups such as those available in Karlsruhe and Berlin, but also using relatively inexpensive, modular spectroscopy setups such as the one in Leiden. Importantly, upconversion quantum yield values are given for the individual upconversion bands of LiYF4:
Yb3+,Tm3+UCNPs. By doing so we illustrate, as done recently for
Yb,Er-doped UCNPs,36,38,41 the strikingly large difference in
intensity between the different emission bands of these UCNPs. Although Tm-doped UCNPs are usually described as blue-emitting UCNPs, FUC of the blue emission bands are as low as 1105at 5 W cm2, while the NIR band at 794 nm has an excellent FUC of B0.02 at 5 W cm2. This discrepancy is
especially important when selecting upconverting materials for different applications.58In security or bioimaging applications where the 794 nm emission is used,FUC,totalis a good measure for
the efficiency of LiYF4:Yb3+,Tm3+UCNPs, because the upconverted
emission spectrum is strongly dominated by the 794 nm band. However, in phototherapeutic applications where only the blue thulium emission is used, for example in the activation of blue-light sensitive anticancer compounds,59the actual efficiency of these UCNPs is one to three orders of magnitude lower than FUC,total. Thus, reporting only the latter would give a misleading evaluation of the amount of excitation light needed to obtain a measurable photochemical effectviaNIR-to-blue upconversion. The low efficiency of the blue upconverted emission in Tm-based UCNPs provides a good explanation why these systems are still difficult to apply in for example blue light-triggered phototherapy,24 and justifies the need for further material research aimed at
increasing the upconversion quantum yields of UCNPs in the blue region of the spectrum.
Conflicts of interest
The authors declare no competing financial interest.
Acknowledgements
COST project CM1403: The European Upconversion Network is thanked for stimulating scientific discussion. The European Research Council is acknowledged for a Starting grant to S. B. The Netherlands Organization for Scientific Research (NWO) is acknowledged for a VIDI grant to S. B. S. B. and M. S. M. kindly acknowledge Prof. E. Bouwman for scientific discussion and support. J. A. C. is a Concordia University Research Chair in Nanoscience and is grateful to Concordia University for financial support of his research. J. A. C. is grateful for financial support from the Natural Science and Engineering Research Council of Canada. The authors from KIT would like to acknowledge the financial support provided by the Helmholtz Association: (i) a Recruitment Initiative Fellowship for B. S. R.; (ii) the funding of chemical synthesis and spectroscopy equipment from the Helmholtz Materials Energy Foundry (HEMF); and (iii) the Science and Technology of Nanosystems research programme. The authors from BAM gratefully acknowledge financial support by the German Science Foundation DFG (grants RE 1203/18-1 and M-Eranet/DFG grant NanoHype RE 1203/20-1).
References
1 R. Wang and F. Zhang, in Near-infrared Nanomaterials: Preparation, Bioimaging and Therapy Applications, ed. F. Zhang, The Royal Society of Chemistry, 2016, ch. 1, pp. 1–39. 2 T. Na¨reoja, T. Deguchi, S. Christ, R. Peltomaa, N. Prabhakar,
E. Fazeli, N. Pera¨la¨, J. M. Rosenholm, R. Arppe, T. Soukka and M. Scha¨ferling,Anal. Chem., 2017,89, 1501–1508. 3 L. Mattsson, K. D. Wegner, N. Hildebrandt and T. Soukka,
RSC Adv., 2015,5, 13270–13277.
4 C. Drees, A. N. Raj, R. Kurre, K. B. Busch, M. Haase and J. Piehler,Angew. Chem., Int. Ed., 2016,55, 11668–11672. 5 A. Bagheri, H. Arandiyan, C. Boyer and M. Lim, Adv. Sci.,
2016,3, 1500437.
6 K. Deng, C. Li, S. Huang, B. Xing, D. Jin, Q. Zeng, Z. Hou and J. Lin,Small, 2017,13, 1702299.
7 E. Ruggiero, S. Alonso-deCastro, A. Habtemariam and L. Salassa,Dalton Trans., 2016,45, 13012–13020.
8 D. Wang, B. Xue, X. Kong, T. Langping, X. Liu, Y. Zhang, Y. Chang, Y. Luo, H. Zhao and H. Zhang,Nanoscale, 2015,7, 190–197.
9 Z. Chen, R. Thiramanas, M. Schwendy, C. Xie, S. H. Parekh, V. Maila¨nder and S. Wu,Small, 2017,13, 1700997.
10 W. Chen, C. Shi, T. Tao, M. Ji, S. Zheng, X. Sang, X. Liu and J. Qiu,RSC Adv., 2016,6, 21540–21545.
11 J. D. Kilbane, E. M. Chan, C. Monachon, N. J. Borys, E. S. Levy, A. D. Pickel, J. J. Urban, P. J. Schuck and C. Dames, Nanoscale, 2016,8, 11611–11616.
12 A. Sedlmeier, D. E. Achatz, L. H. Fischer, H. H. Gorris and O. S. Wolfbeis,Nanoscale, 2012,4, 7090–7096.
13 X. Liu, H.-C. Chen, X. Kong, Y. Zhang, L. Tu, Y. Chang, F. Wu, T. Wang, J. N. H. Reek, A. M. Brouwer and H. Zhang, Chem. Commun., 2015,51, 13008–13011.
14 Y. Tang, W. Di, X. Zhai, R. Yang and W. Qin,ACS Catal., 2013,3, 405–412.
15 Z. Xu, M. Quintanilla, F. Vetrone, A. O. Govorov, M. Chaker and D. Ma,Adv. Funct. Mater., 2015,25, 2950–2960. 16 C. L. M. Hofmann, E. H. Eriksen, S. Fischer, B. S. Richards,
P. Balling and J. C. Goldschmidt,Opt. Express, 2018, 26, 7537–7554.
17 W. J. Kim, M. Nyk and P. N. Prasad,Nanotechnology, 2009, 20, 185301.
18 J. C. Boyer, F. Vetrone, L. A. Cuccia and J. A. Capobianco, J. Am. Chem. Soc., 2006,128, 7444–7445.
19 W. Gao, H. Zheng, Q. Han, E. He and R. Wang, CrystEng-Comm, 2014,16, 6697–6706.
20 F. Wang and X. G. Liu, J. Am. Chem. Soc., 2008, 130, 5642–5643.
21 A. D. Ostrowski, E. M. Chan, D. J. Gargas, E. M. Katz, G. Han, P. J. Schuck, D. J. Milliron and B. E. Cohen,ACS Nano, 2012,6, 2686–2692.
22 G. Liu,Chem. Soc. Rev., 2015,44, 1635–1652.
23 A. N. Bashkatov, E. A. Genina, V. I. Kochubey and V. V. Tuchin, J. Phys. D: Appl. Phys., 2005,38, 2543–2555.
24 E. Ruggiero, A. Habtemariam, L. Yate, J. C. Mareque-Rivas and L. Salassa,Chem. Commun., 2014,50, 1715–1718. 25 G. Chen, H. Agren, T. Y. Ohulchanskyy and P. N. Prasad,
Chem. Soc. Rev., 2015,44, 1680–1713.
26 X. Xie, N. Gao, R. Deng, Q. Sun, Q.-H. Xu and X. Liu,J. Am. Chem. Soc., 2013,135, 12608–12611.
27 W. Zou, C. Visser, J. A. Maduro, M. S. Pshenichnikov and J. C. Hummelen,Nat. Photonics, 2012,6, 560–564.
28 D. J. Garfield, N. J. Borys, S. M. Hamed, N. A. Torquato, C. A. Tajon, B. Tian, B. Shevitski, E. S. Barnard, Y. D. Suh, S. Aloni, J. B. Neaton, E. M. Chan, B. E. Cohen and P. J. Schuck,Nat. Photonics, 2018,12, 402–407.
29 Q. Dou, L. Jiang, D. Kai, C. Owh and X. J. Loh,Drug Discovery Today, 2017,22, 1400–1411.
30 S. H. C. Askes, P. Brodie, G. Bruylants and S. Bonnet,J. Phys. Chem. B, 2017,121, 780–786.
31 V. Gray, K. Moth-Poulsen, B. Albinsson and M. Abrahamsson, Coord. Chem. Rev., 2018,362, 54–71.
32 M. Mousavi, B. Thomasson, M. Li, M. Kraft, C. Wu¨rth, U. Resch-Genger and S. Andersson-Engels, Phys. Chem. Chem. Phys., 2017,19, 22016–22022.
33 C. Wu¨rth, M. Grabolle, J. Pauli, M. Spieles and U. Resch-Genger,Nat. Protoc., 2013,8, 1535–1550.
34 J. C. Boyer and F. C. J. M. van Veggel,Nanoscale, 2010,2, 1417–1419.
35 S. Fischer, N. J. J. Johnson, J. Pichaandi, J. C. Goldschmidt and F. C. J. M. van Veggel,J. Appl. Phys., 2015,118, 193105.
36 M. Kaiser, C. Wu¨rth, M. Kraft, I. Hyppanen, T. Soukka and U. Resch-Genger,Nanoscale, 2017,9, 10051–10058. 37 S. Balabhadra, M. L. Debasu, C. D. S. Brites, R. A. S. Ferreira
and L. D. Carlos,J. Lumin., 2017,189, 64–70.
38 C. Wu¨rth, M. Kaiser, S. Wilhelm, B. Grauel, T. Hirsch and U. Resch-Genger,Nanoscale, 2017,9, 4283–4294.
39 A. Pilch, B. Czaban, D. Wawrzyn´czyk and A. Bednarkiewicz, J. Lumin., 2018,198, 482–487.
40 A. Pilch, D. Wawrzyn´czyk, M. Kurnatowska, B. Czaban, M. Samoc´, W. Strek and A. Bednarkiewicz,J. Lumin., 2017, 182, 114–122.
41 C. Wu¨rth, S. Fischer, B. Grauel, A. P. Alivisatos and U. Resch-Genger,J. Am. Chem. Soc., 2018,140, 4922–4928.
42 C. Homann, L. Krukewitt, F. Frenzel, B. Grauel, C. Wu¨rth, U. Resch-Genger and M. Haase,Angew. Chem., Int. Ed., 2018, 57, 8765–8769.
43 M. Y. Hossan, A. Hor, Q. Luu, S. J. Smith, P. S. May and M. T. Berry,J. Phys. Chem. C, 2017,121, 16592–16606. 44 P. Huang, W. Zheng, S. Zhou, D. Tu, Z. Chen, H. Zhu, R. Li,
E. Ma, M. Huang and X. Chen,Angew. Chem., Int. Ed., 2014, 53, 1252–1257.
45 K. W. Kra¨mer, D. Biner, G. Frei, H. U. Gu¨del, M. P. Hehlen and S. R. Lu¨thi,Chem. Mater., 2004,16, 1244–1251. 46 M. Quintanilla, I. X. Cantarelli, M. Pedroni, A. Speghini and
F. Vetrone,J. Mater. Chem. C, 2015,3, 3108–3113.
47 S. Heer, O. Lehmann, M. Haase and H. U. Gu¨del, Angew. Chem., Int. Ed., 2003,42, 3179–3182.
48 X. Liu, J. Zhao, Y. Sun, K. Song, Y. Yu, C. Du, X. Kong and H. Zhang,Chem. Commun., 2009, 6628–6630.
49 S. Fischer, J. K. Swabeck and A. P. Alivisatos,J. Am. Chem. Soc., 2017,139, 12325–12332.
50 V. Mahalingam, F. Vetrone, R. Naccache, A. Speghini and J. A. Capobianco,Adv. Mater., 2009,21, 4025–4028. 51 P. A. Rojas-Gutierrez, C. DeWolf and J. A. Capobianco,Part.
Part. Syst. Charact., 2016,33, 865–870.
52 D. O. Faulkner, J. J. McDowell, A. J. Price, D. D. Perovic, N. P. Kherani and G. A. Ozin,Laser Photonics Rev., 2012,6, 802–806. 53 J. C. de Mello, H. F. Wittmann and R. H. Friend,Adv. Mater.,
1997,9, 230–232.
54 J. F. Suyver, A. Aebischer, S. Garcı´a-Revilla, P. Gerner and H. U. Gu¨del,Phys. Rev. B: Condens. Matter Mater. Phys., 2005, 71, 125123.
55 M. Pollnau, D. R. Gamelin, S. R. Lu¨thi, H. U. Gu¨del and M. P. Hehlen,Phys. Rev. B: Condens. Matter Mater. Phys., 2000,61, 3337–3346.
56 A. Sugiyama, M. Katsurayama, Y. Anzai and T. Tsuboi, J. Alloys Compd., 2006,408-412, 780–783.
57 L. D. DeLoach, S. A. Payne, L. L. Chase, L. K. Smith, W. L. Kway and W. F. Krupke,IEEE J. Quantum Electron., 1993,29, 1179–1191.
58 G. Jalani, R. Naccache, D. H. Rosenzweig, S. Lerouge, L. Haglund, F. Vetrone and M. Cerruti,Nanoscale, 2015,7, 11255–11262.