Original Research Article
Estimation of stature from percutaneous length of tibia amongst
Bengalee population-an observational study in a teaching
institution in West Bengal, India
Tapas Ghosh*
INTRODUCTION
Stature is one of the important parameters for identification of an individual. Stature can be estimated from long bones, especially tibia and femur, as these have a direct correlation to the height of an individual. Lower limb length is the greatest contributor to standing height; hence most predictive equations for height are based on length of lower limb or its long bones. Tibia is ideal in this context as it is subcutaneous, and measurement can be done easily.
Assessment of height of individuals from measurement of body parts has been of immense interest to anatomists, anthropologists and forensic medicine experts.
Various studies have been conducted in this respect and different regression equation formulae derived to correlate height with percutaneous length of tibia (PCLT).1-5 Pelin IC et al, compared the accuracy of
formulae designed for Turkish people to the accuracy of formulae devised for other populations and found that the Trotter-Gleser formula for Mongoloids was the closest.6
ABSTRACT
Background: Assessment of stature from measurement of percutaneous body parts is important for identification. This assessment can be done from long bones, especially tibia and femur. Tibia is ideal in this context as it is subcutaneous, and measurement is easy. Various regression equations correlating stature with percutaneous length of tibia (PCLT) are outdated, incorrect or inappropriate. So, the present study aimed at finding a recent relationship, and if possible, correlation between PCLT and stature.
Methods: PCLT and stature of 470 subjects of Burdwan district, West Bengal, India, were recorded.
Results: New regression equations were derived from the data, taking into consideration the racial, geographic, secular and gender differences. After determining that PCLT and stature were related and positively correlated, the newly formulated regression equations were evaluated and found to be statistically significant.
Conclusions: The new regression equations derived from this study could be employed for more accurate estimation of stature.
Keywords: Percutaneous regression equation, Stature, Tibial length
Department ofAnatomy, Burdwan Medical College and Hospital (BMCH), West Bengal, India
Received: 13 February 2019 Revised: 27 March 2019 Accepted: 03 April 2019
*Correspondence: Dr. Tapas Ghosh,
E-mail: [email protected]
Copyright: © the author(s), publisher and licensee Medip Academy. This is an open-access article distributed under the terms of the Creative Commons Attribution Non-Commercial License, which permits unrestricted non-commercial use, distribution, and reproduction in any medium, provided the original work is properly cited.
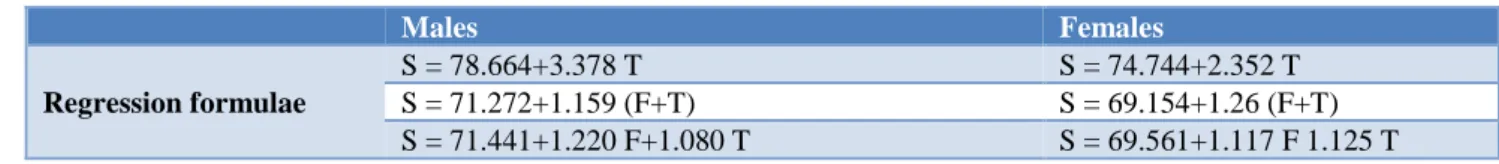
Pearson, whose data from 1899 is still used largely for stature estimation even nowadays, laid down a regression formula for the estimation of living stature (S) from cadaver long bone length - (from tibia (T) alone and from femur (F) and tibia (T) together) (Table 1).7
The researches of Trotter and Gleser, Dupertutis and Hadden, and Trotter is the basis for estimation of stature not only for American Whites and Blacks but was actually meant to solve the whole problem of statural reconstruction as such.8-12 Trotter and Gleser had
concluded that: ‘There is a reasonably and relatively constant average stature which is devoid of any trend of variation for all the 4 groups born between 1840 and 1895. There is a tendency for the Black American population (both male and female) to slightly increase in stature from 1895 to 1905.
A significant increase in male stature is present in individuals born between 1905 and 1924. Stature trend thus presents minor fluctuations in the nineteenth century followed by rapid increase in the twentieth century.9
Table 1: Pearson’s regression formulae for the estimation of living stature (S) from cadaver long bone length- (from tibia (T) alone and from femur (F) and tibia (T) together.
Males Females
Regression formulae
S = 78.664+3.378 T S = 74.744+2.352 T
S = 71.272+1.159 (F+T) S = 69.154+1.26 (F+T) S = 71.441+1.220 F+1.080 T S = 69.561+1.117 F 1.125 T
Other studies have been performed to derive formulae for Europeans, Mongoloids, Negroids, South Africans, etc. 13-16 For east India and India (then United provinces) Pan
and Nat respectively had derived multiplying factors for different long bones (e.g. stature: tibia ratio) as given in Table 2.17,18
Table 2: Multiplication factor to get stature.
Pan Nat
Tibia Male Female Male
4.49 4.46 4.48
But there are numerous drawbacks to all the above-mentioned studies. For example, there has been considerable change in body size since Trotter and Gleser’s work; so, it is quite possible that their formulae are inappropriate for modern application. Pan and Nat’s worked more than five decades ago; hence, the growth pattern which prevailed at that time may have changed now, and the formulae derived then might not yield satisfactory results at present. Stature is influenced by many factors like age, gender, race, geographical climate, nutrition, genetic factors, etc. So, the correlation factor of one region will not hold good for another. Lastly, in many cities and towns, cosmopolitan pattern of distribution of people are found, to which Pan’s or other’s formulae cannot be applied. For all these reasons, the present study was planned to find out a recent relationship, and if possible, correlation between the PCLT and stature of an individual.
METHODS
This was a cross sectional study for one year. Patients and patient party attending the OPD and medical students
of Burdwan medical college and hospital were enlisted after getting proper informed consent. Subjects with history of trauma or fracture of leg, achondroplasia or any congenital or hereditary bone disease were excluded. In total 480 subjects were included, but 10 were rejected due skeletal deformities.
The institutional ethics committee approved the study. Age, sex, standing height (by standard Stadiometer) and tibial length were recorded. For tibial length, subjects stood erect so that thigh and flexor surface of leg were at 90-degree angles. Distance between the medial most point on upper border of medial condyle of tibia, and tip of medial malleolus of tibia were measured. Data was used for simple regression or formulation of multiplying factors.
The bivariate pair (length of tibia and supine length was tested for linearity and the relationship between the pair i.e. the correlation coefficient (r) was calculated using the following formulae19
As a regression equation is represented by a straight-line y = a + bx, for computation of the slope or regression coefficient (b) the following formulae was adopted20
The intercept /constant or additive factor (a) was obtained
as follows are the sample means of y and x respectively.21
Replacing the values of ‘a’ and ‘b’ the regression equation of the sample population was obtained. Regression equations for male and female cadavers were obtained separately.
To determine how reliable these regression equations are likely to be, the confidence limits for ‘a’ and ‘b’ were calculated using the following formulae 22
a+ t (0.05) X Sa and b+t (0.05) X Sb
where Sa is the estimated standard error associated with the constant (a), Sb is estimated standard error of regression coefficient (b), and t(0.05) is the ‘t’ value at
0.05% level of significance.
The equation which has been formulated should be statistically significant in the sense that it should depend upon the regression coefficient (b); thus, b should not be zero. The null hypothesis b = 0 and new hypothesis that b >0 was set up to ascertain the dependency of the regression equations on the regression coefficient (b). 5% significance level was chosen for testing the hypothesis.
Testing whether ‘b’ was significantly greater than zero or not involved the following steps23
At first ‘t’ value was calculated using the formulae
This calculated ‘t’ value was then compared with the critical ‘t’ scores at 5% level.
Also, 95% confidence intervals of prediction of y values were calculated using the formulae19
Where x0 = some value of x (here minimum, maximum and mean values were taken).
Whether the regression coefficient of males and females were significantly different or not and hence the justification for the formulation of separate equations was tested by calculation of F values as follows20
The square of standard error of estimate of male sample and female sample were calculated and the squared standard error were compared using a F test. The F value
was calculated with 40 degrees of freedom (n-2 for males) in numerator and 30 degrees of freedom (n-2 for females) in the denominator as follows:
F= Larger squared standard error/Smaller squared standard error
The F value was then compared with the critical F values from the statistical table.
RESULTS
The study included 260 males and 210 females. Age of males and females ranged from 20 to 59 years (mean 31.3 years) and 20 to 49 years (mean 27.18 years) respectively. To find out whether stature (y) was related to tibial length (x), the correlation coefficient (ryx) was calculated by the formulae described in “Materials and methods. ryx was 0.94 for both males and females, which shows that x and y are highly correlated (Table 3).
Table 3: Descriptive statistics of the sample.
Statistical parameters Males Females
Sample size 260 210
Standing height
Mean 159.15 157.12
Range 141.6-176.2 139-175.5
Sample SD +7.76 +7.60
Population SD +7.593 +6.011
Tibial lengths
Mean 34.14 32.72
Range 27.2-41.8 26.8-39.8
Sample SD +3.06 +2.65
Population SD +2.730 +2.118
Correlation coefficient (ryx) 0.94 0.94
Standard error of estimate +0.19 +0.18
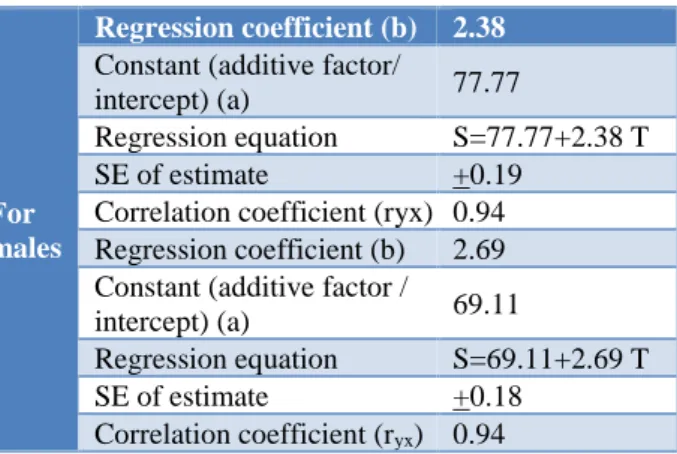
Similarly, regression equations were derived using formulae described in “Materials and methods’ (Table 4). The S.E. of estimate was quite low.
Table 4: Formulation of new regression equations of stature from tibial length.
For males
Regression coefficient (b) 2.38
Constant (additive factor/
intercept) (a) 77.77
Regression equation S=77.77+2.38 T SE of estimate +0.19
Correlation coefficient (ryx) 0.94 Regression coefficient (b) 2.69 Constant (additive factor /
intercept) (a) 69.11
Regression equation S=69.11+2.69 T SE of estimate +0.18
Hence, the scatter of data along the regression lines was minimal and goodness of fit of the data points in drawing the regression lines was easily achieved. Tests of significance of ‘a’ and ‘b’ were carried out and ‘t’ value calculated using formulae described in “Materials and methods’. For both males and females, ‘t’ was much higher than the critical values of ‘t’ (0.05) with 40 degrees of freedom (n-2) and 30 degrees of freedom (n-2) respectively. Hence, the null hypothesis was rejected. Thus, it is not realistic to assume that the regression coefficient of the population is zero.
The 95% confidence intervals for the predicted values of stature ‘y’ gives an idea of the range of values within which estimated stature as derived from the formulae, may lie for a given value of tibial length. Thus, after determining that tibial length and stature were positively correlated, the formulated regression equations were seen to be statistically significant.
DISCUSSION
There were 53% of subjects in this study were of age group 25 to 35 years. This has implications: for example, the regression equations that have been obtained are from data contributed mostly by this young age group. Some authors like Trotter and Gleser had suggested that, in estimating stature 0.06 x (age in years - 30) cm should be subtracted for aged subjects. Thus, the factor of decrease in stature with older age does not have much influence in the formulation of the present regression equations.
Sample SD of standing height for both males and females closely approximated the population sample SD (Table 3). Thus, the sample very closely represented the actual population from which it was drawn.
To test whether the correlation coefficients were significant or not the null hypothesis H: ρ=0 (ρ= population correlation coefficient) was set up. The computed ’f’ was found to be much greater than the critical ‘t’ value at the chosen level of significance. The null hypothesis (ρ=0) was ejected. The computed ryx for both males and females was thus considered significant (p<0.05).
This study tried to justify the formulation of two separate equations for males and females. This was important because most Indian researchers had formulated common/single regression equations or multiplying factors for both males and females. By comparing the squared standard error of males and females using an F test, it was found that the computed F exceeded the critical F value.
The null hypothesis was rejected and thus the regression coefficient male was significantly different from b female. Thus, the same formula cannot be used, and separate formulae as suggested, for males and females have to be used.
Regression equations for estimation of stature was calculated as follows:
For males: S = 77.77+2.38 T (SE of estimate + 0.19) For females: S = 69.11+2.69 T (SE of estimate + 0.18)
Regression lines were drawn with 95% confidence limits for direct estimation of stature from the given tibial length.
Some Indian authors had derived a common regression equation, which are closer to the stature calculated in present study. For example, stature (158.29cm, i.e. difference of -2.43cm) given by Joshi’s equation (S = 80.97+2.206 T) is quite close to that given by the present study.24 But Patel’s formula (S = 65.51+2.203 T) gives a
noticeable underestimation of stature (145.06cm, i.e. difference of-17.99cm).25 The reason for the difference
between the above mentioned studies and present study might be due to common regression equations formulated for both males and females in the studies, whereas in present study we have different formulae for the two sexes.
Stature calculated from regression equations formulated by Singh gives an intermediate value (150.44cm, which is -13.59cm less).26 Siddique’s regression equation also
gives a stature (151.16cm, which is-12.87cm less) neither close nor too distant from stature derived from the present study.27 Singh’s and Siddique’s values may vary
from ours because they both have multiplication factors for males only. Further, these studies were carried out on populations different from that of present study.
Stature calculated from regression equations formulated by most foreign authors are quite different from the stature derived from the present study.28-30 An exception
is Trotter and Gleser’s equation for Black Negroes which underestimated male stature by only 0.81cm and female stature by 1.27cm. Thus, Trotter and Gleser’s equation for Black Negroes closely corresponds with the estimation of stature as calculated from the present formula. Other popular formulae could not correctly estimate the stature of the population of eastern India.
Thus, the present regression equations, which has taken into consideration the racial, geographic, secular and gender differences of tibial length, could be employed for more accurate estimation of stature of the average population of Burdwan district of West Bengal.
Funding: No funding sources Conflict of interest: None declared
Ethical approval: The study was approved by the Institutional Ethics Committee
REFERENCES
Birgunj, Nepal. J Kathmandu Med Coll.
2014;3(2):58-62.
2. Gupta P, Kumar P, Gaharwar A, Ansari H, Hussein M. Correlation of percutaneous length of tibia with body height and estimation of stature in living North Indian males. Sch J App Med Sci. 2014;2(2D):848-52.
3. Khatun SS, Sharma N, Jain SK, Gupta A. Estimation of stature from percutaneous tibial length in Indian population. Int J Anat Res. 2016;4(3):2571-6.
4. Khatun SS, Sharma N, Jain SK, Gupta A. Estimation of stature from percutaneous tibial length in Indian population. Int J Anat Res. 2016;4(3):2571-6.
5. Mehta AA, Mehta AA, Gajbhiye VM, Verma S. Correlation of percutaneous tibial length with body height and estimation of stature in living Central India population. Int J Anat Res. 2015;3(2):1159-61. 6. Pelin IC, Duyar I. Estimating stature from tibia length: a comparison of methods. J Forensic Sci. 2003;48(4):708-12.
7. Pearson K. Mathematical contributions to the theory of evolution. V. On the reconstruction of the stature of prehistoric races. Phil Trans Royal Soc. 1899;9:169-244.
8. Trotter M, Gleser GC. Trends in stature of American whites and negroes born between 1840-1924. Am Jr Phy Anthropol. 1951;9:427-40. 9. Duperitus CW, Hadden JA. Ori reconstruction of
stature from long bones. J Phy Anthropol. 1951;9:15-54
10. Trotter M, Gleser GC. The effect of aging. Am Jr Phy Anthropol. 195;9:311-24.
11. Trotter M, Gleser GC. A reevaluation of estimation of, stature based on measurements of stature taken during life and of long bones after death. Am Jr Phy Anthropol. 1958;16:79-123.
12. Trotter M, Gleser GC. Estimation of stature from long bones of American whites and negroes. Am Jr Phy Anthropol. 1952;10:463-514.
13. Telkka A. On the prediction of human stature from the long bones. Acta Anat. 1950;9:103-17.
14. Genoves S. Proportionality of the long bones and their relation to stature among Mesoamericans. Am Jr Phy Anthropol. 1967;26:67.
15. Allbrook D. The estimation of stature in British and East African males based on tibial and ulnar bone lengths. J Forensic Med. 1961;8:15-28.
16. Lundy JK. Regression equations for estimating living stature from long bones in South African negroes. S African J Sci. 1983;79:337-8.
17. Pan N. Length of long bones and their proportion to body weights in Hindus. J Anat. 1924;58:374-8. 18. Nat BS. Estimation of stature from long bones in
Indians of the United Provinces: a medico-legal enquiry in anthropometry. Indian J Med Res. 1931;18:1245-3.
19. Rees DG, eds. Regression analysis. In: Essential statistics. London: Chapman and Hall. 1991:153-64 20. Williams RBG. Linear regression. In: Introduction
to statistics for geographers and earth scientists. London: Mac Milan Publishers; 1991:279-324. 21. Edwards AL, eds. Statistical methods. New York:
Rinehart and Winston; 1967:256-67.
22. Rao CR, eds. Advanced statistical methods in biometric research. London: John Wiley and sons; 1962:291-6.
23. Croxton FE, Cowden DJ, Kleen S, eds. Applied general statistics. New Delhi: Prentice Hall of India; 1969:230-6.
24. Joshi NB, Patel MP, Amin MG. Use of tibia and ulna in the estimation of total body height. Ind J Med Res. 1965;53(9):831-41.
25. Patel MP, Joshi NB, Dongre AV. Regression equation of height on tibial length. Ind J Med Res. 1964;52:531-4.
26. Singh B, Sohal HS. Estimation of stature from clavicle in Punjabis: a preliminary report. Ind J Med Res. 1952;40(1):67-1.
27. Siddiqui MAH, Shah MA. Estimation of stature from long bone of Punjabis. Ind J Med Res. 1944;32:105-8.
28. Didia BC, Nduka EC, Adele O. Stature estimation formula for Nigerians. J Forensic Sci. 2009;54(1):20-1.
29. Smith SL. Stature estimation of 3-10-year-old children from long bone lengths. J Foren Sci. 2007;52(3):538-46.
30. Serajlic N, Cihlarz Z. Diverse stature estimation formulae applied to a Bosnian population. Bos J Basic Med Sci. 2007;7(2):136-9.