REVIEw Of BuSINESS MANAGEMENT
© FECAP
RBGN
Received on
August 12, 2013
Approved on
March 17, 2015
1. Armando Cuesta Santos
PhD in Economic Sciences from the Instituto Superior Politécnico José Antonio Echeverría (CUJAE), Havana (Cuba)
Review of Business Management
DOI:10.7819/rbgn.v17i56.1736
Human Resources Management in the
Company, Performance and Sense of
Commitment
Armando Cuesta Santos
Department of Industrial Engineering. Instituto Superior Politécnico José Antonio Echeverría (CUJAE), Havana, Cuba
Responsible editor: João Maurício Gama Boaventura, PhD. Evaluation process: Double Blind Review
ABStRACt
Objective – The objective was to measure and to evaluate the
construct “sense of commitment”, to insert it in the activities of Human Resources Management (HRM).
Design/methodology/approach – The used methods were
interviews, mathematic modeling, and statistical correlation.
Findings – As the results, mathematical models were obtained
and used to process the application of instruments with theoretical support related to the studied construct, as well as its validation for the socio-cultural particulars of Cuban companies’ employees, along with its conceptual insertion in the activities of HRM for its planning and strategic management control.
Practical implications – Insertion of the “sense of commitment”
in the HRM activities of the company, considering its planning and strategic management control.
Contributions – The measurement of the “sense of commitment”, technically inserting it in the planning and control of the HRM activities in the company.
1 IntRODuCtIOn
Particularly related to the human resources management in the company, the contemporary scientific literature highlights the concern with the success of a high sense of commitment of employees regarding the organization, both considering the humanistic component of them being socially implicated or belonging to a community, as well as the economic component of them being associated to the increase of work productivity or to the high performance (Beer, 2009; Boxall & Macky, 2009; Boston Consulting Group [BCG]& World Federation of People Management Associations [WFPMA], 2010; Drucker, 1999; Montoya Monsale, & Montoya Naranjo, 2012; Picart, 2012; Schaufeli, Bakker, & Van Rhenen, 2009)
In the worldwide survey jointly reported in 2010 by the Boston Consulting Group (BCG) and the World Federation of People Management Association (WFPMA), comprising a total of 109 countries, four topics were highlighted as the most critical in regard to human resources: talent management, leadership development improvement, employees’ commitment reinforcement, and strategic human resources planning (BGC& WFPMA, 2010).
In the investigative experience attained by the author within the scope of human resources management (HRM) in the company, the sense of commitment, work-related competences, leadership, satisfaction, perception of perspectives were regarded as intangible assets (Cuesta Santos, 2010, 2011; Cuesta Santos & Valencia Rodriguez, 2010). The HRM model the author developed in 2005, applied to companies with the aim of strategically diagnosing, planning and controlling such management (Cuesta Santos, 2010, 2012), had as one of the results to attain the increase of the employees’ sense of commitment, considered as the most important one.
Measuring and evaluating such intangible asset in companies were considered a problem to solve, in order to relate it to the strategic HRM planning and to strategic management control.
This difficulty was also found in the literature, notwithstanding the existence of models or instruments to register the sense of commitment reported in such literature. This article has the aim of reflecting the results of an investigation in companies, regarding the measurement of the employees’ sense of commitment, relating it to the high performance, with the subsequent aim of planning the HRM activities, and of designing the strategic management control.
As the results, mathematical models were obtained and used to process the application of instruments with theoretical support related to the studied construct, as well as its validation for the socio-cultural particulars of Cuban companies’ employees, along with its conceptual insertion in the activities of HRM for its planning and strategic management control.
2 MAteRIAl AnD MethODS
The study material was two Cuban companies, which socio-cultural peculiarity of their employees was their high qualification, also having a strong investigation component in their final results or products. The used methods were the survey, mathematical modeling, and statistic correlation.
Three instruments (surveys) were used to measure the “sense of commitment”, and a mathematical model was applied to each of them in order to perform the evaluation, comparing them through statistical correlation to the performance in two classifying levels (low and high), in order to evidence the criterium validity in a concurrent manner and through experts, as well as the validity of the construct related to the supporting theory and its correlations.
of the author, results were obtained comprising the theoretical and methodological approach supporting the attainment of field results, in a second stage, by comparing the business practice, establishing the pertinent statistical correlations, all of which allowed to insert this construct, which is the commitment, into the planning and control of HR strategic management in the company.
3 ReSultS
3.1 Results regarding the theoretical methodological support
The study of the scientific literature allowed us to locate a set of authors that allow establishing the theoretical methodological support of the investigation – becoming one of the results of the study –, which will be mentioned as follows along with their contributions.
In the Human Resources Management (HRM) model developed by Michael Beer and the collaborators of the Harvard Business School (Beer, Spector, Lawrence, Mills, &Walton, 1985), four fundamental results to attain are highlighted, and one of them is the “commitment” of the employees. And they searched for the “high commitment”:
High degree of commitment meaning that the employees are motivated to listen, understand, and respond to the communications of the Management regarding the changes in the demands of the context, with the corresponding implications in wages, work practices, and competence requirements. The mutual confidence will contribute to provide the Management message with a higher credibility for the employees, and to allow the Management to respond before the legitimate interests of the employees as stakeholders (Beer
et al., 1985, p. 39).
In s u c h m o d e l , w h e n d e f i n i n g “commitment” – also offering a methodological conduction, from the question therein expressed, which was used by this author (Cuesta Santos, 2010) in planning the HRM –, they point out:
Commitment: To which extent the HRM policies work as to increase the commitment of people with their work and the organization? The reinforcement of the commitment can not only result in a higher degree of loyalty and a higher return to the company, but also in an increased self-esteem, dignity, psychological implication, and identity of people (Beer et al., 1985, p. 21).
It is noteworthy in which is expressed about the “commitment” that it is not only about the pursuit of a higher return, but also through the employee-organization reciprocity, indicated by “mutual confidence”, there is the pursuit to meet the legitimate interests of the employees, that is, it also includes the human aspect, the human development, expressed in the increased self-esteem, dignity, and psychological implication. And the “reciprocal motivation” is also highlighted in this pluri-dimensional construct that is the “commitment”. We can observe the similarity in the theories that support the instruments assumed from other authors whose investigative results are considered in the end of this investigation.
The theoretical conceptions implied in the HRM model of Beer and collaborators were very important to develop the human resources management in the company, from the acquired experience. Notwithstanding this theory, to the practical effects of measuring the “commitment”, such authors do not propose instruments. The investigations of Michael Beer have continued with this orientation, highlighting the link “high commitment – high performance” (Beer, 2009)
In the literature, there is a recent group of investigations and standards highlighting the importance of attaining a high sense of commitment from workers, both because of its implication to the human development (since the person is included in the social relations of an organization or community, thus psychologically growing), as well as to the productivity or performance increase (Beer, 2009; BGC& WFPMA, 2010; Chih-Hsun& Hui, 2010; Montoya Monsale, & Montoya Naranjo, 2012; Peralta Gómez, Santofimio, & Segura, 2007; Raufflet, Lozano, Barrera, & García, 2012), but no instrumentation for its evaluation is proposed. The concept or construct of the sense of commitment or of belonging to a work-related organization is contemporarily appraised as very important to the business management activities, in general, and in particular for the HRM, for strongly implicating the humanistic aspect, of human development, and also the economic aspect. The idea that the development is performed by people is increasingly more recognized. The United Nations Development Program (UNDP) insists on this in its Report on Human Development issued since 1990, and which in its 20th anniversary confirms this thesis (Programa de Desarrollo de las Naciones Unidas [PNUD], 2010). The support of the sustainable business improvement will increasingly come from the human development or improvement.
The measurement or practical appraisal of such construct is very necessary, and consequently for this author a fundamental methodological consideration is the definition of measurement, as verification of the practice or empyrean to reveal the concept, for its validation. This verification is of interest because this investigation is to perform business management, to transform or change the practice. There is identification with the following definition of measurement, designed “as the process of relating abstract concepts to empirical indicators” (Hernández Sampieri, FernándezCollado, & Baptista Lucio, 2006, p. 276). And also regarding measurement,
further in this same site, Roberto Hernández and collaborators point out:
The suggested definition includes two considerations: the first one from the empiric viewpoint, which briefly states that the center of attention is the observable answer (either an alternative of answer marked in a questionnaire, a behavior registered via observation, or an answer given to an interviewer). The second is from the theoretical perspective, stating that the interest is located in the non-observable underlying concept represented by the answer. (Hernández Sampieri et al., 2006, p. 276).
The previous considerations about the investigation methodology are also the basic assumptions to treat the following references, implicating instruments, contributed by authors who have developed theories about the construct at issue.
This construct of the sense of commitment evidences the human growth or development, as it meets the need of belonging, of being included in a community or organization – since the human essence grants the set of social relations that integrates the person –, and in turn, through this belonging or commitment, the working person tries to fulfill the fundamental goal of this work-related organization that is to attain higher performances, thus performing more or better. The later was the support of the commitment theory developed by Robert Eisenberger and collaborators.
The POS survey, preceded by the instruction, where the scale (Table 1) to consider in ranking is expressed, is shown in Table 2.
Robert Eisenberger, the collaborators and continuators, correlated the different items or questions (each of them independently) with the sense of belonging, and reported that these were statistically high. This author, by means of a mathematical model that reveals the evaluation of this instrument application with its set of items, correlated it with performance. And this can be further observed, through a proposal of
mathematical models or formulations, which also comprises the two instruments (surveys) which follow.
Instruction: In the following survey, there are items that represent possible opinions You can have about the organization where you are currently working. Please, indicate the degree with which You agree or disagree with each question or item, writing beside the number of the degree or ranking that You consider according to the following scale:
tABle 1 – Scale to use for ranking
0 1 2 3 4 5 6
Strongly
disagree Moderatelydisagree disagreeSlightly Not disagreenor agree Slightly agree Moderatelyagree Strongly agree Note: Adapted from “Perceived organizational support: a review of the literature”, of L. Rhoades, R. Eisenberger, 2002.
tABle 2 – Survey of Perceived Organizational Support (POS)
Item Ranking
1. The organization appreciates my contribution to its wellbeing. 2. The organization does not appreciate any extra effort from myself (R)* 3. The organization would ignore any discontent from myself (R) 4. The organization really takes care of my wellbeing.
5. If I did the work the best I could, the organization does not notice that (R) 6. The organization takes care of my general satisfaction at work
7. The organization shows little concern about myself (R) 8. The organization is proud of my achievements in the work *(R) means that the item or question is the reverse of the scale.
Note: Adapted from “Perceived organizational support: a review of the literature”, of L. Rhoades, R. Eisenberger, 2002.
From another study, with a long time span, conducted by the Gallup Consultant (Harter, Schmidt, Killham, & Asplund, 2006; Gallup, 2010), an evaluation instrument is also offered for the sense of commitment, however this author has not performed an empirical comparison so far.
Another instrument with this same direction of Eisenberger and collaborators is also highlighted, but the sense of commitment is not treated as to directly infer the “Perceived Organizational
Support”, but defining the “sense of commitment” by means of three components: vigor, dedication, and absorption. (Schaufeli et al., 2009).
and persistence before events and challenges; and the phrase characterizing this component is: “in my work, I always feel with energy”. The second component is dedication, with 5 items; and the same occurs when the worker implies a sense of importance to his/her work, a feeling that encourages him/her to produce better, and shows a feeling of inspiration and challenge, and which is represented by the following phrase: “I find in the work a complete meaning and purpose”. And the third component is the absorption, with 6 items, characterizing that the worker is completely immersed and satisfied with his/her work, overcoming difficulties, and time passes quickly, and the phrase reflecting this is the following: “when I am working, I forget any other thing around me”.
The UWES survey also has 7 ranges in its scale, but in this in relation to the previous one, a linearity or continuity is manifested in its valuation (the difference of the POS survey is insisted), which ranges from 0 to 6, the maximum “sense of commitment” being indicated by value 6.
In an investigation conducted by Gene Cherubin, the UWES survey with 17 items was used to evaluate the theory of commitment expressed by the survey of “Perceived Organizational Support” (POS) of 8 items. The POS was declared as an independent variable, and the committed employee was declared as a dependent variable measured through the UWES survey. The study revealed, through statistical correlation, that when employees have the perceived organizational support, the degree of commitment increases (Cherubin, 2011).
The instruction given by the authors, as well as the survey1 shown in Table 3, is presented
as follows.
Instruction: The following 17 items show how can You feel at work. Please, read each item carefully, and decide if You feel like this at work. If You have never had this feeling, mark (X) in zero (0). If You have had this feeling, indicates the degree or level marking the number (from 1: minimum, to 6: maximum).
tABle 3 – Utrecht Work Engagement Survey (UWES)
Item 0 1 2 3 4 5 6
1. In my work, I always have lots of energy.
2. I find in the work a complete meaning and purpose 3. Time flies when I am working
4. In my work, I feel strong and vigorous 5. I am enthusiastic about my work
6. When I am working, I forget what happens around me. 7. My work inspires me.
8. When starting the day, I feel I go to work 9. I feel happy when I am intensely working 10. I am satisfied with the work I do 11. I am immersed in my work
12. I can go on working for long periods of time 13. For me work is a challenge
14. I get what I want when I am working
15. In my work I am mentally very resilient (flexible) 16. I separate difficulty from myself in my work
17. In my work I always perseverates when something does not work
The author developed the following mathematical models or formulations to reflect, through an indicator, the evaluation of each of these surveys,
Ipos= [(∑ A / 4) – (∑ R / 4)] / 6 (N)
where,
Ipos: index of perceived organizational support.
∑A: sum of the points of each of the items (4) in Front (A) - ahead in front of or linear with the scale, increasing from 0 to 6 very positive.
∑R: sum of the points of each of the items (4) called R, in Reverse (R) –contrary to the scale, growing from 6 to 0 very positive.
N: total number of surveyed employees.
The Ipos index oscillates in continuous values between -1, 0, and +1. An Ipos=1 means the maximum perceived organizational support, and is what is intended as very positive. An Ipos= -1 means the minimum perceived organizational support (or the inexistence of such perception), and is what is avoided for being very negative. And the Ipos=0 means the neutral point, not negative nor positive (but its meaning depends on the classifying scale used, as observed as follows). Of course, the tendency to positive values near 1, or precisely 1, is the intention.
The modeled indicator of the “Utrecht Work Engagement Survey” is presented as follows:
Iuwes=(∑P/ 17 ) / 6 (N)
where,
Iuwes : work commitment index meeting the application of the Utrecht survey (UWES).
∑P: sum of the points received in each of the 17 items of the Utrecht survey
N: total number of surveyed employees.
The value that Iuwes can assume oscillates between 0 and 1. The tendency to 1 is the intention, meaning the sense of commitment with the work. The tendency to zero (0) means the lost or the absence of this sense of commitment to work. The classification range can be observed as follows, which necessarily contextualizes or qualifies what was previously stated.
And at last, also comprising theory and methodology, this author has been evaluating the Index of the sense of commitment (Isc) since the aforementioned HRM model designed in 2005 (Cuesta Santos, 2010, 2012). In the Isc designed by the author, five sub-indexes, attributes, or dimensions are considered, having as reference the argumentation about the “High degree of commitment” exposed by Michael Beer and collaborators of the Harvard Business School (Beer et al., 1985). The Instruction and the designed survey are presented as follows:
Instruction: Mark X in the range (1-2, 3-4,…9-10) comprised in one of the five following dimensions, where You locate yourself perceiving the sense of commitment to your institution or company.
1. Identification with the mission and values of the institution:
___________________________________________________________
1 2 3 4 5 6 7 8 9 10
None Little Medium Good A lot
2. Loyalty with the high management of the institution:
3. Motivation to listen to, understand, and respond to the communications of the management in regard to the changes in the context demands with their implications in wage, work organization, competence requirements, etc.:
___________________________________________________________
1 2 3 4 5 6 7 8 9 10
None Little Medium Good A lot
4. Willingness to work:
___________________________________________________________
1 2 3 4 5 6 7 8 9 10
None Little Medium Good A lot
5. Credibility in the essential aspirations of the institution and its leaders:
___________________________________________________________
1 2 3 4 5 6 7 8 9 10
None Little Medium Good A lot
e (-1) d (-0.5) c (0) b (0.5) a (1)
And this pondering and logic correspond to the following model:
∑a (1)+ ∑ b (0,5) + ∑ c (0) + ∑ d (-0,5) + ∑ e (-1)
Isc =___________________________________________________
N
O lo que es igual:
∑ b- ∑ d
∑ a+ ___________ - ∑ e
2
Isc =________________________________
n
where,
Isc: index of the sense of commitment of the employee i or of the group j.
3.2 Results regarding the field or empirical investigation
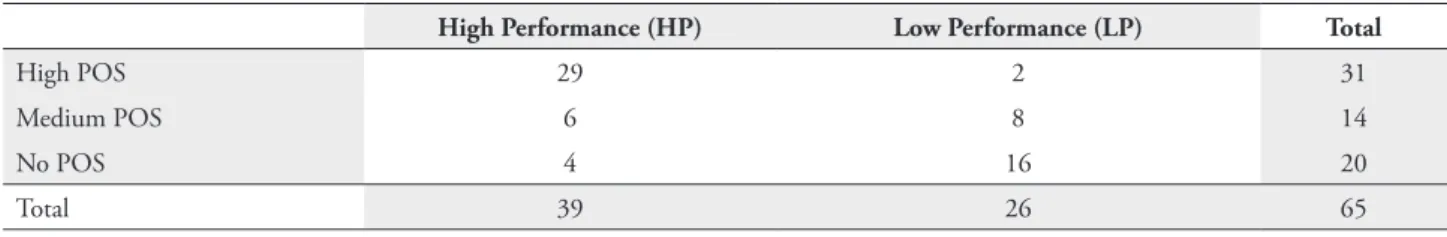
The survey “Perceived Operational Support” (POS) was applied to a representative sample of 65 (N) workers, where the POS index was related to the Performance level. Each interviewee was classified (in nominal scale) into two states: as of High Performance (HP) and of Low Performance (LP); and regarding the POS, the worker was classified in three alternatives: High POS, Low POS, and No POS. This allowed Table 4.
Attaining the values that the model designed to reflex POS can assume, namely:
Ipos= [(∑ A / 4) – (∑ R / 4)] / 6 (N), then the three assumed classification alternatives were the following:
High POS: 0.50 to 1.00; Medium POS: 0.01 to 0.49; No POS: -1.00 to 0.00.
How the Ipos of interviewees (1,2,…65) was determined, for subsequent classification, is shown as follows:
Ipos 1= [(24/4) – (0/4) ] / 6 (1) = 1
Ipos 2 = [(16/4) – (4/4) ] / 6 (1) = 0.50
Ipos 3= [(1/4) - (23/4) ] / 6 (1) = -0.91 …until Ipos 65, because N=65.
The validity of the instrument was pursued by means of several evidences, in particular by searching the concurrent validity and the validity by experts (Hernández Sampieri et al., 2006). The validity criterium for the evaluated performance was obtained from the integral evaluation of the annual performance at the discretion of the respective chiefs; in regard to the performance it was decided that this integral valuation was more
comprising (besides the return, also considering the responsibilities), and no other indicator such as work productivity or use of working hours, which would leave behind other attributes of the performance, particularly the responsibilities. The concurrent validity of the POS measurement was pursued, in addition to its correlation with performance, experts (chiefs) criteria about the survey result.
tABle 4 – Comparison of the POS with the performance of 65 interviewees
high Performance (hP) low Performance (lP) total
High POS 29 2 31
Medium POS 6 8 14
No POS 4 16 20
Total 39 26 65
To perceive the association or statistical correlation between POS and performance, the limitations of the measurement (nominal) scale which could be obtained were clear, to which it was added the impossibility of assuming a known distribution, and the parametric statgraphics were relegated to the effects of the statistical inference. The non-parametric statgraphics Coefficient of Contingency C (Siegel, 1974) was used, which is a measurement of the degree
of association or relation between two sets of attributes. This is singularly useful when there is only classificatory information (nominal scale) about one or both sets of attributes.
1143 Rev. bus. manag., São Paulo, Vol. 17, No. 56, pp. 1134-1148, Apr./Jun. 2015
Human Resources Management in the Company, Performance and Sense of Commitment
Insofar as the discrepancy between the expected values and observed values in the cells is bigger, the degree of association between the
two variables increases, and therefore, the value of C is bigger.
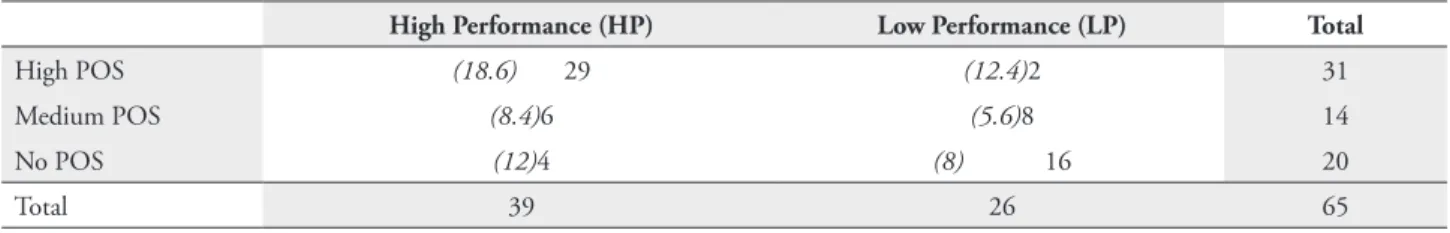
tABle 5 – Observed and expected frequencies of POS and Performance
high Performance (hP) low Performance (lP) total
High POS (18.6) 29 (12.4)2 31
Medium POS (8.4)6 (5.6)8 14
No POS (12)4 (8) 16 20
Total 39 26 65
c2 values given by the C formula are
approximately distributed as chi-square with gl= (r – 1) (k – 1), where r is the number of rows, and k is the number of columns in the contingency table. In Table 2, the expected frequency for the lower right cell of the table is E32= (26) (20)
/ 65 =8. Replacing the values of Table 2 in the expression of c2, we have: c2= (29 – 18,6)2 / 18,6
+ (2 – 12,4)2/ 12,4 + (6 – 8,4)2 / 8,4 + (8 – 5,6)2
/ 5,6 + (4 – 12)2 /12 + (16 – 8)2 /8 = 29,56.
Replacing in the model reflecting C, we have:
Medium POS (8.4)6 (5.6)8 14
No POS (12)4 (8) 16 20
Total 39 26 65
2
values given by the C formula are approximately distributed as chi-square with gl=
(r
– 1) (k – 1), where r is the number of rows, and k is the number of columns in the
contingency table. In Table 2, the expected frequency for the lower right cell of the table is
E
32= (26) (20) / 65 =8. Replacing the values of Table 2 in the expression of
2, we have:
2=
(29 – 18,6)
2/ 18,6 + (2 – 12,4)
2/ 12,4 + (6 – 8,4)
2/ 8,4 + (8 – 5,6)
2/ 5,6 + (4 – 12)
2/12 +
(16 – 8)
2/8 = 29,56.
Replacing in the model reflecting C, we have:
C=29,56= 0.559
65 + 29.56
Table C of critical chi-square values (Siegel, 1974) is used, by means of gl=2, comparing that
2obtained (29.56)
2theoretical (13.82). Therefore, Ho is rejected (there is no correlation
between POS and Performance) for =0.001.
The
Utrech Work Engagement Scale (UWES)
was applied to a sample of 56 (N) workers,
where the Iuwes was related to the Performance level. Each interviewee was classified (in
nominal scale) into two states: as of High Performance (HP) and of Low Performance (LP);
and regarding the Iuwes, the worker was classified into three alternatives: High, Medium, and
Low commitment.
The Coefficient of Contingency C was also used, and the arguments for that were the
same as those previously mentioned. And the way of obtaining it was the same, with the
results shown in Table 6. Attaining the values that can be assumed by the model designed to
reflex the UWES (Iuwes) Index, namely:
Iuwes=
(
∑P/ 17
)
/ 6 (N)
Then the three assumed classification alternatives were the following: High sense of
commitment 0.50 to 1.00; Medium sense of commitment: 0.25 to 0.49; Low sense of
commitment: 0.00 to 0.24. How the Iuwes of the interviewees (1,2,…56) was determined for
subsequent classification of each interviewee in one of the three alternatives, allowing Table
6, is presented as follows:
Iuwes
1= (4 * 17/17) /6 (1)= 4/6= 0.66
Iuwes
2= (6 * 17/ 17) /6 (1)= 6/6= 1
Iuwes
3= (1 / 17) /6 (1)= 0.059/6= 0.01 …until Iuwes
56, because N=56
Replacing the values obtained in Table 6 in the expressions of
2and C, 16.57 and
0.477 were respectively obtained. Using the aforementioned table C, by means of gl=2, we
have that
2obtained (16.57)
2theoretical (13.82). Therefore, Ho (there is no correlation
between Iuwes and Performance) is rejected for =0.001. The validity was obtained through
the same
modus operandi
used for the previous instrument.
Table C of critical chi-square values (Siegel, 1974) is used, by means of gl=2, comparing that c2 obtained (29.56) >c2 theoretical (13.82).
Therefore, Ho is rejected (there is no correlation between POS and Performance) for a =0.001.
The Utrech Work Engagement Scale (UWES) was applied to a sample of 56 (N) workers, where the Iuwes was related to the Performance level. Each interviewee was classified (in nominal scale) into two states: as of High Performance (HP) and of Low Performance (LP); and regarding the Iuwes, the worker was classified into three alternatives: High, Medium, and Low commitment.
The Coefficient of Contingency C was also used, and the arguments for that were the same as those previously mentioned. And the way of obtaining it was the same, with the results shown in Table 6. Attaining the values that can be assumed by the model designed to reflex the UWES (Iuwes) Index, namely:
Iuwes=(∑P/ 17) / 6 (N)
además de su correlación con el desempeño, con criterios de expertos (sus jefes) sobre el resultado de la encuesta.
Tabla 4
Contraste de la PAO con el desempeño de los 65 encuestados
Alto Desempeño (AD) Bajo Desempeño (BD) Total
Alta PAO 29 2 31
Mediana PAO 6 8 14
Ninguna PAO 4 16 20
Total 39 26 65
Para poder percibir la asociación o correlación estadística entre PAO y desempeño se tenían claras las limitaciones de la escala de medición (nominal) que pudo lograrse, a lo que se sumaba no poder asumir una distribución conocida, por lo que a los efectos de la inferencia estadística se relegaban los estadígrafos paramétricos, así como a otros no paramétricos más potentes que al menos exigían medición ordinal.
Se recurrió al estadígrafo no paramétrico Coeficiente de Contingencia C (Siegel, 1974), que es una medida del grado de asociación o relación entre dos conjuntos de atributos. Es singularmente útil cuando se tiene solamente información clasificatoria (escala nominal) acerca de uno o ambos conjuntos de atributos.
El grado de asociación entre dos conjuntos de atributos (“Percepción de Apoyo Organizacional”, PAO, y Desempeño Alto o Bajo), independientemente de la distribución de la población, puede descubrirse con una tabla de contingencia (Tabla 5) de las frecuencias mediante:
C= ___ 2___
N + 2
donde,
r k
2 = (O ij - Eij) 2 (probándose la Homediante esta expresión de 2)
i= 1 j= 1 Eij donde,
Oij: es el número observado de casos clasificados en la fila i de la columna j.
Eij: es el número de casos esperados conforme a Hoque que se clasificarán en la fila i de la columna j.
: indica sumar en todas las filas (r) y en todas las columnas (k), es decir, sumar en todas las celdillas.
A medida que la discrepancia entre los valores esperados y los valores observados de las celdillas es mayor, se incrementa el grado de asociación entre las dos variables y, por lo tanto, es mayor el valor de C.
Tabla 5
Frecuencias observadas y esperadas de PAO y Desempeño
where,
Oij: the observed number of cases classified in the row i of column j.
Eij: number of expected cases according to Ho that will be classified in row i of column j.
SS: indicates the sum in all the rows (r) and in all the columns (k), that is, to sum in all the cells. where,
Then the three assumed classification alternatives were the following: High sense of commitment 0.50 to 1.00; Medium sense of commitment: 0.25 to 0.49; Low sense of commitment: 0.00 to 0.24. How the Iuwes of
the interviewees (1,2,…56) was determined for subsequent classification of each interviewee in one of the three alternatives, allowing Table 6, is presented as follows:
Iuwes 1= (4 * 17/17) /6 (1)= 4/6= 0.66
Iuwes 2= (6 * 17/ 17) /6 (1)= 6/6= 1
Iuwes 3= (1 / 17) /6 (1)= 0.059/6= 0.01 …until Iuwes 56, because N=56
Replacing the values obtained in Table 6 in the expressions of c2 and C, 16.57 and
0.477 were respectively obtained. Using the aforementioned table C, by means of gl=2, we have that c2 obtained (16.57) >c2 theoretical
(13.82). Therefore, Ho (there is no correlation between Iuwes and Performance) is rejected for a =0.001. The validity was obtained through the same modus operandi used for the previous instrument.
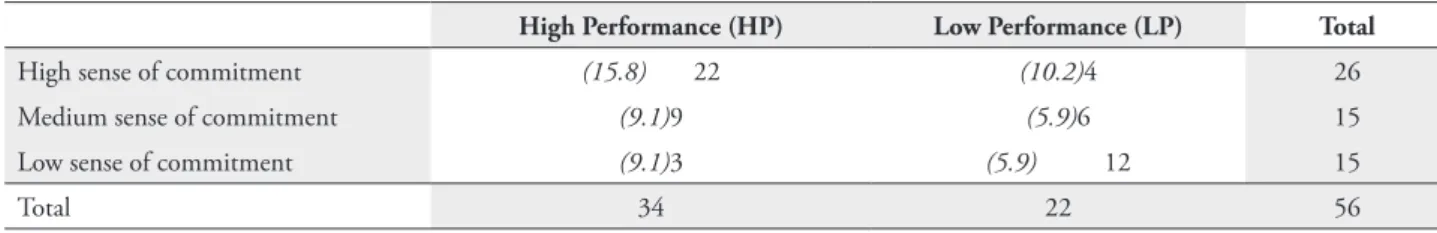
tABle 6 – Observed and expected frequencies of Iuwes and Performance
high Performance (hP) low Performance (lP) total
High sense of commitment (15.8) 22 (10.2)4 26
Medium sense of commitment (9.1)9 (5.9)6 15
Low sense of commitment (9.1)3 (5.9) 12 15
Total 34 22 56
At last, the empirical endorsement of the sense of commitment Index (Isc) survey was pursued. It was also validated through similar criteria. The arguments of the statgraphics and procedure used will not be mentioned, because they were the same. In this case, the survey was applied to the same workers of the company to whom the
Ipos survey was applied, although the answer of 11 interviewees was not received (who were not working at the company on those moments), and the results of 54 (N) could be processed. The obtained data are shown in Table 7.
When using the model, namely:
Isc= [∑a (1)+ ∑ b (0.5) + ∑ c (0) + ∑ d (-0.5) + ∑ e (-1)] / N
then the three assumed classification alternatives were the following: High sense of commitment: 2.50 to 5.00; Medium sense of commitment: 0.00 to 2.49; No sense of commitment: -5.00 to -0,01.
How the Iuwes of the interviewees (1,2,…56) was determined for subsequent classification of each interviewee in one of the three alternatives, allowing Table 7, is presented as follows:
Isc 1= 125 (1) + 50 (0.5) + 25 (0) + 25 (-0.5) +25 (-1) / 54= 2.08
Isc 2= 125 (1) + 115 (0.5) + 10 (0) + 20 (0.5) + 0 (-1)/ 54= 3.19
When determining c2, the value of 15.82
and a C=0.476 were obtained. The already mentioned table C was used, by means of gl=2, having c2 obtained (15.82) >c2 theoretical
(13.82). Therefore, Ho (there is no correlation between Isc and Performance) was rejected for a =0.001.
tABle 7 – Observed and expected frequencies of Isc and Performance
high Performance (hP) low Performance (lP) total
High sense of commitment (14.8) 23 (10.1)2 25
Medium sense of commitment (7.7)5 (5.3)8 13
No sense of commitment (9.4)4 (6.5) 12 16
Total 32 22 54
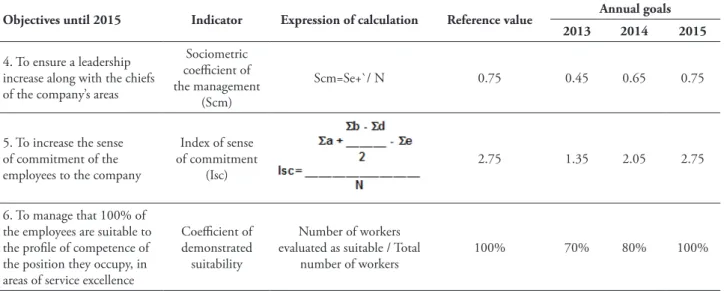
As pointed out in the beginning of this article, the measurement of the sense of commitment was necessary for planning the HRM and to control the management. In order to illustrate this, Figure 1 shows the Integral Command Table (ICT), as well as a fragment of the table where the planned objectives are detailed with their indicators (Table 8); these correspond
to the ICT conceived by Robert Kaplan and David Norton (Kaplan &Norton, 2004), where intangibles were considered as referring to the Isc, previously taken into consideration to plan them, pursuing their increase. The intangible indicators (4, 5 y 6) appear numbered, evidencing the causal connections or hypothesis between the different strategic objectives proposed.
Finances
Customer
Processes
Learning &
Growth Increase of leadership
(Csd) Guarantee 100% of services
Cost
reduction Increase of productivity
Increase of revenue
Logistic Process
Elaboration Process
Trading Process Increase of
quality delivery cycles Reduction of Customer
Satisfaction Customer Repetition
Increase of clientele
Increase of commitment
(Isc)
4 5 6
3
1
2
tABle 8 – Objectives, indicators, and expressions of calculation of a company
Objectives until 2015 Indicator expression of calculation Reference value Annual goals 2013 2014 2015
4. To ensure a leadership increase along with the chiefs of the company’s areas
Sociometric coefficient of the management
(Scm)
Scm=Se+`/ N 0.75 0.45 0.65 0.75
5. To increase the sense of commitment of the employees to the company
Index of sense of commitment
(Isc) 2.75 1.35 2.05 2.75
6. To manage that 100% of the employees are suitable to the profile of competence of the position they occupy, in areas of service excellence
Coefficient of demonstrated
suitability
Number of workers evaluated as suitable / Total
number of workers 100% 70% 80% 100%
It has to be pointed out that this instrument – as well as the other two – is defended by this author to establish “before-after” measurements of the HRM activities. Different from the instruments to measure tangibles, such as the °C thermometer or the measuring tape, which imply universality, in the case of instruments to measure intangibles, in general, they are regarded as casuistic, and in this “before and after” relation with regard to the same object of measurement, and in the specific strategic scenario. As known, we can use different work satisfaction surveys, which measure such variable, but they have different items and scales, and cannot be indistinctly used.
5 COnCluSIOnS
For the Human Resources Management, the indicator sense of commitment of employees to the organization has a major practical relevance, considering its relation with the high performance, and consequently with the high productivity. Besides this economic meaning, its practical relevance is revealed in the human development by implicating the belonging to or inclusion in a community, comprising the self-esteem, dignity, and human or psychological growth.
Thus it is very interesting to evaluate this sense of commitment, because of its implication
in the economic increase, and human growth or development. It is increasingly recognized that development is created by people. The sustainability of the company’s economic development will increasingly come from the human development that can be attained.
The mathematical models used to reflect the instruments to measure the sense of commitment have allowed their respective indicators, thus allowing their comparison (through the statistic correlation provided by the Coefficient of Concordance C) in the business practice with high and low performance, inferring that a high sense of commitment also corresponds to a high performance, and vice-versa. Such indicators can be planned, and should be included in the strategic management planning and controlling as intangible assets.
The relation of the intangible indicator that is the sense of commitment, with the tangible one that is the work-related performance in its full dimension (comprising not only productivity or effective working hours, but also responsibilities) has a methodological meaning for the empirical verification when understanding the statistical correlation.
validated), as well as the conception of strategic management control, in order to keep the direction and control of such a relevant indicator of economic development and human development.
nOte
1 Although the terms seem to be adjusted to the culture of our Latin American countries (a pilot was performed to check their intelligibility), they were only further detailed by adding the term “flexible” as similar to resilient to the item 15, and by specifying 1 = minimum and 6 = maximum in the instruction given by the authors.
ReFeRenCeS
Beer, M. (2009).High commitment high performance: How to build a resilient organization for sustained advantage. New York: Jossey-Bass.
Beer, M., Spector, B.,Lawrence, P., Mills, Q., & Walton, R. (1985).Human resource management: A general manager’s perspectiva. Text and cases. New York: Free Press Macmillan.
Boston Consulting Grup, & World Federation of People Management Associations. (2010). Creating people advantage 2010:How companies can adapt their hr practices for volatile times. Boston: Authors.
Boxall, P., & Macky, K. (2009). Research and theory in high: Performance work systems: progressing the high-involvement stream. Human Resource Management Journal, 19(1), 3-23. doi:10.1111/j.1748-8583.2008.00082.x
Cherubin, G. L. (2011). Perceived organizational support and engagement (Doctoral thesis). Disponible de Disertación y Tesis base de datos de ProQuest. (UMI No. 1509402). Recuperado de http://gradworks.umi.com/15/09/1509402.html
Chih-Hsun, C., &Hui, l. (2010). Strategic human resource management in service context: Taking care of business by taking care of employees and
customers.Personnel Psychology, 63(1), 153–196. doi:10.1111/j.1744-6570.2009.01165.x
Cuesta Santos, A. R. (2010). Gestión del talento humano y del conocimiento. Bogotá: ECOE Ed.
Cuesta Santos, A. R. (2011). Metodología de gestión por competencias asumiendo la norma cubana sobre gestión de capital humano. RBGN - Revista Brasileira de Gestão de Negócios,13(40), 300-311.
Cuesta Santos, A. R. (2012). Modelo integrado de gestión humana y del conocimiento: Una tecnología de aplicación. RVG - Revista Venezolana de Gerencia,17(57), 84-96.
Cuesta Santos, A. R., & Valencia Rodriguez, M. (2010). La productividad del trabajo del trabajador del conocimiento. REGE - Revista de Gestión, 17(4), 421-436.
Drucker, P. (1999). Knowledge-worker productivity: The biggest challenge. California Management Review, 41(2), 79-94.
Eisenberger, R., Stinglhamber, F., Vandenberghe, C., Sucharski, I., & Rhoades, L. (2002). Perceived supervisor support: Contributions to perceived organizational support and employee retention. Journal of Applied Psychology, 87(3), 565-573. doi:10.1037//0021-9010.87.3.565
Gallup. (2010). Employee engagement: What’s your engagement ratio? Washington, D.C.: Author. Recuperado de http://www.brentobannon. com/wp-content/uploads/2012/11/Customer_ Engagement_Overview_Brochure.pdf
Harter, J., Schmidt, F., Killham, E., & Aspulud, J. (2006). Q12 meta-analysis,Princeton: The Gallup
Organization.
Hernández Sampieri, R., FernándezCollado, C., & Baptista Lucio, P. (2006). Metodología de la investigación(4th ed). México: McGraw-Hill.
Montoya Monsale, J. N., & Montoya Naranjo, J. D. (2012). Grupo Semco y las prácticas de recursos humanos de alto compromiso, una ventaja competitiva. Innovar, 22(46), 21-38.
Morales Cartaya, A. (2006). Contribución para un modelo cubano de gestión integrada de recursos humanos (Tesis de doctorado). Facultad de Ingeniería Industrial de la CUJAE,La Habana, Cuba.
NC 3001: 2007.(2007). Sistema de gestión integrada de capital humano – Requisitos. La Habana: Oficina Nacional de Normalización (NC). Recuperado de www.nc.cubaindustria.cu
Peralta Gómez, M. C., Santofimio, A. M., & Segura, V. (2007). El compromiso laboral: Discursos en la organización. Revista Psicología desde el Caribe, (19), 81-109.
Picart, A. G. (2012). TRAYCO, pionera en la certificación por la NC 3001: 2007 del sistema de gestión integrada de capital humano. In D. Salazar Fernández (Coord.), La red de capital humano (pp.139-167).La Habana: Academia.
Programa de las Naciones Unidas para el Desarrollo. (2010). Informe sobre Desarrollo Humano 2010:La verdadera riqueza de las naciones: Caminos al desarrollo humano. Madrid: Mundi-Prensa. Recuperado de http://hdr.undp.org/sites/ default/files/hdr_2010_es_complete_reprint.pdf
Raufflet, E., Lozano, F., Barrera, E., & García, C. (2012). Responsabilidad social empresarial. México: Pearson Educación.
Rhoades, L., & Eisenberger, R. (2002). Perceived organizational support: A review of the literature. Journal of Applied Psychology, 87(4), 698-714.
Schaufeli, W., Bakker, A., &Van Rhenen, P. (2009). How changes in job demands and resources predict burnout, work engagement, and sickness absenteeism.Journal of Organizational Behavior, 30(7), 893-917. doi:10.1002/job.595