Experimental Investigation of Ice Accretion Effect On NACA
0018 Airfoil
P. Bhaskar Rao1P. Satish Reddy2Dr.K. Venkateswara Rao3Dr.M. Sri Rama Murthy4 PG Scholar, Assoc. Professor, Professor, Professor
Dept. of Mechanical Engineering, Prasiddha College of Engg & Technology, Anathavaram Dept. of Mechanical Engineering, Sir C.R. Reddy College of Engg, Eluru
[email protected], [email protected], [email protected], [email protected]
ABSTRACT
Accretion of ice on aircraft wing is one of the most significant hazards to the safe and efficient operation of aircraft as it can reduce aircraft performance in a number of ways. Ice particles adhere to the wing surfaces and become a part of the wings itself. This tends to change the profile of airplane wings and degrades their aerodynamic properties. It reduces aircraft efficiency by increasing weight, reducing lift, decreasing thrust, and increasing drag.
The present work focuses on the aerodynamic performance of a twin horn iced airfoil. In this, an artificial twin horn iced wooden layer is fabricated out of soft wood material which is mounted onto a NACA 0018 Airfoil which is suitable to test in the 30cm×30cm test section of low speed wind tunnel with different angles of attack from -20˚ to 20˚ for an
increment of 5˚. Experiments are carried out to study
static pressure distribution, drag and lift variations over blank airfoil and Twin Horn Iced Airfoil. Raw data from the wind tunnel is processed and pressure, lift and drag coefficients are calculated using mathematical equations. The aerodynamic performance of a blank airfoil proved to be considerably better compared to twin horn iced airfoil.
Keywords: Aircraft icing, Angle of Attack, NACA
0018 airfoil, Wind Tunnel, Coefficient of Pressure, Coefficient of Drag, Coefficient of Lift
Notations and Abbreviations
D = Drag
L = Lift
CD = Drag coefficient
CL = Lift coefficient
CP = Pressure coefficient
FL = Lift Force, N
FD = Drag Force, N
Α = Angle of Attack, degrees P = Static pressure, cm of water V = Velocity of air, m/s
A = Projected area of the airfoil, m2 C = Chord length, cm
LE = Leading Edge
air
= Air density, kg/m3 AOA = Angle of AttackPatm = Atm. pressure, cm of water
CAD = Computer Aided Design
q = Difference of manometer reading in Pitot tube, cm
NACA = National Advisory Committee for Aeronautics
NASA = National Aeronautics and Space Administration
I. INTRODUCTION
Aircraft icing is the accretion of super cooled liquid onto an airplane during flight. Accreted ice adversely affects flight; thus, it is an important component of an aviation weather forecast. It reduces aircraft efficiency by increasing weight, reducing lift, decreasing thrust, and increasing drag. Each effect tends to either slow the aircraft or force it downward. Icing also seriously impairs aircraft engine performance.
Icing occurs when super cooled water freezes on any part of the external structure of an aircraft during flight. Although the nominal freezing point of water is 0°C, water in the atmosphere does not always freeze at that temperature and often exists as a "super cooled" liquid. If the surface temperature of an aircraft structure is below zero, then moisture within the atmosphere may turn to ice as an immediate or secondary consequence of contact. Considerable quantities of atmospheric water continue to exist in liquid form well below 0°C. The proportion of such super cooled water decreases as the static air temperature drops until by about -40°C almost all of it is in solid form. The size of super cooled water droplets and the nature of the airflow around the aircraft surface, determine the extent to which these droplets will strike the surface.
1.1. ICE ACCRETION MECHANISM
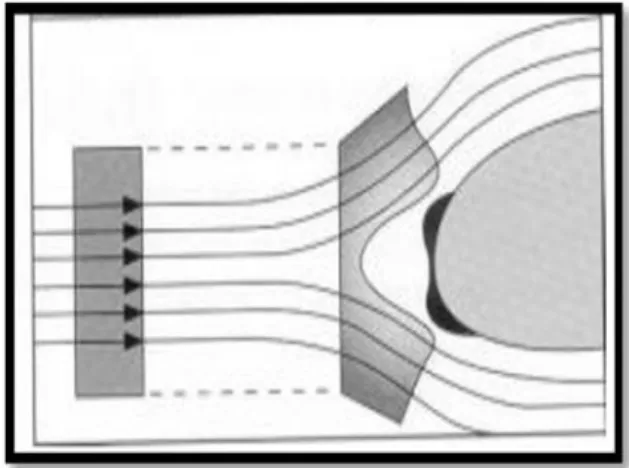
but many touching it (continuity of airflow). However, water droplets are much heavier than air particles and they do not pass around so easily. Some of them therefore impact on the leading edge (Figure 1.1). Also, it is a rule of super cooled water that it is unstable, and super cooled liquid water freezes immediately after the impact. Ice accretion results from the continuation of this process.
Fig 1.1: Twin Horn shape on wing LE 1.2. TWIN HORN SHAPE
The above process leads to an uneven distribution of water droplet impacts on the leading edge. It is easily conceivable that those which are right in the middle would not be deflected very much and would impact instead on the upper and lower sides of the leading edge.
Fig 1.2: Development of twin horn shape
This starts the double horn shape, which is a divergent process and which is further enhanced by ram effect. But if the droplets are very heavy, as in the case of freezing rain, deflection is limited, and ice accretion takes place in an arc shape.
1.3. ICE-SHAPE CLASSIFICATION
There are many types of ice accretion classified by the physics of the ice accretion process and these labels are more familiar to many engineers. These include rime ice, glaze or clear, ice, mixed ice, beak ice, runback ice, inter cycle ice and many others.
Fig 1.3: Aerodynamic effects for different ice shapes
Figure 1.3 qualitatively shows the four types of ice shapes with the vertical axis representing increased two-dimensionality and the horizontal axis representing increasing flow disturbance (and therefore degradation in aerodynamic performance). Roughness is in the lower left corner as the most 3D shape with low to moderate disturbance of the flow field. Stream wise, horn, and span wise-ridge ice are all more 2D and have increasing aerodynamic effect from stream wise ice with the least to span wise ridge with the largest effect. The circles representing the different shapes overlap representing the fact that some shapes have characteristics of more than one type.
1.4. EFFECTS OF ICING
Ice on an airfoil changes its properties, reducing lift and increasing drag for a given angle of attack. Ice on a propeller blade reduces the efficiency of the propeller and reduces thrust. In addition, the weight of the ice increases the aircraft weight and therefore the lift required. Because for a given air speed the angle of attack must be increased to provide the necessary lift, the critical (stalling) angle is reached at a higher air speed than when ice is not present.
II.WIND TUNNEL EQUIPMENT
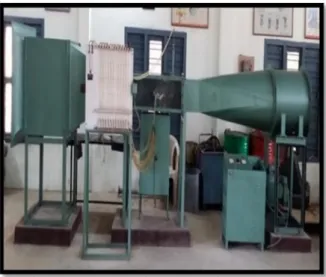
Experiments are carried out in a wind tunnel. In this experiment Altech open circuit wind tunnel is designed for use in student Engineering laboratories and other industrial and Government research facilities. This Wind Tunnel can be used to study the pressure distribution, lift and drag characteristics of airfoils, cylinder etc. Reynolds number up to 25, 00,000 can be achieved with this tunnel. The wind tunnel used for experimentation is shown in the Fig 2.1.
Fig 2.1: Experimental Setup
The wind tunnel is of suction type with an axial flow fan driven by a variable speed DC motor. It consists of an entrance section with a bell mouth inlet containing a flow straighter, screen and a straw honey combs. This section is followed by a contraction section, test section, a diffuser section and a duct containing the axial flow fan. The whole unit is supported on steel frame. The complete wind tunnel except the test section is constructed of mild steel iron sheets for strength and rigidity. The test section is made of teak wood and has glass window for visual observation of flow phenomena. The control of the DC motor is by a rectifier controlled variable speed drive
The speed control of the DC motor is done by a knob attached to the rectifier. The experiment has been carried out in subsonic wind tunnel with a test section 300 mm high 300 mm wide and 1000 mm long. The airfoil has been fixed along the width of the test section. A clamp with holes has been made and fixed along the side wall of the test section for lifting the airfoil from center towards upper wall of the wind tunnel to investigate the wall effect on fluid flow characteristics. Measurement of free stream velocity is performed using a Pitot tube and with a linkage mechanism transducer to determine drag force. A protractor is attached to the airfoil and is fitted in the side wall of the wind tunnel to measure the angle of rotation of the airfoil.
The objectives of the present work are as follows:
Design of Twin Horn Iced wooden layer in Auto CAD
Fabrication of Twin Horn Iced layer in carpentry and mount it onto a NACA 0018
Airfoil
Experiments were conducted in wind tunnel for both the Blank and Twin Horn Iced Airfoils
To calculate static pressure coefficients by measuring pressure distribution on the surfaces of both the test models
To attain relationship between the coefficient of pressure and the non-dimensional distance along the chord length and to compare the results for both the test models
To calculate drag and lift coefficients by measuring drag and lift force
To attain relationship between the coefficient of drag and different angles of attack and to compare the results for both the test models
To attain relationship between the coefficient of lift and different angles of attack and to compare the results for both the test models
III. BLANK AIRFOIL
A model of NACA0018 airfoil has been selected for this study in which there are two types of airfoils. One is NACA 0018 airfoil with a chord of 16 cm, a span of 30cm and maximum thickness 2.9cm with holes of 12 number of each 1mm diameter are drilled on the upper and lower surface of the airfoil. Flexible tubes are fixed at these 12 locations and connected to multi-tube manometer for measurement of static pressure distribution and the other airfoil with a chord of 16cm, a span of 25cm and maximum thickness of 2.9cm for measuring drag and lift force. The below figures shows the details of blank airfoil.
Fig 3.2: Blank Airfoil for measuring pressure distribution
Fig 3.3: Position of the sensors along the chord IV.TWIN HORN ICED AEROFOIL
The Twin Horn Iced Airfoil is formed by mounting a twin horn iced wooden layer on NACA 0018 Airfoil. The twin horn iced wooden layer is made by following two steps
1. Design of Twin Horn Iced wooden layer in Auto CAD
2. Fabrication of Twin Horn Iced wooden layer using wood
Design of Twin Horn Iced wooden layer
The design of the twin horn iced wooden layer includes
Import the Co-ordinates of NACA 0018 airfoil from Airfoil tools
The NACA 0018 Airfoil Co-ordinates are imported from Airfoil tools to .txt file and then exported to Excel.
Create CAD file in Auto CAD
The NACA 0018 Airfoil Co-ordinates are exported from Excel to AUTO CAD to get required airfoil.
Fig 4.1: Twin Horn Iced layer Fabrication of Twin Horn Iced wooden layer
Once the CAD model was created, a prototype of twin horn iced wooden layer was made in the carpentry. The twin-horn iced wooden layer made up of soft wood with 25 cm span. When the ice layer was completed, it was mounted onto a NACA 0018 airfoil.
Fig 4.2: Twin Horn Iced Airfoil for measuring drag and lift force
Fig 4.3: Twin Horn Iced Airfoil for measuring pressure distribution
V.WIND TUNNEL TESTS
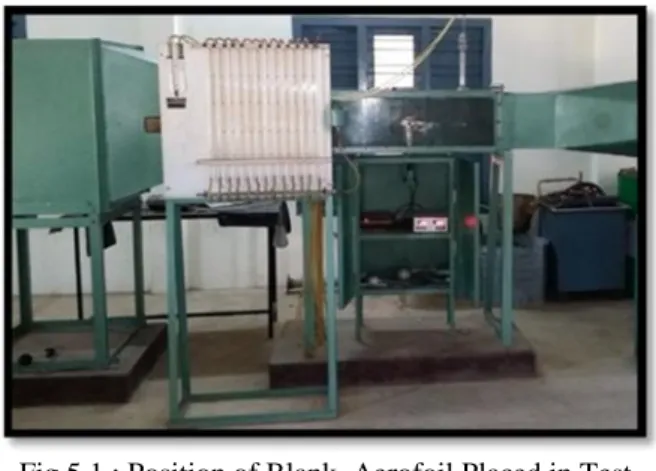
Fig 5.1 : Position of Blank Aerofoil Placed in Test Section for measuring drag and lift force
Fig 5.2 : Position of Twin Horn Ice Aerofoil Placed in Test Section for measuring drag and lift force
Fig 5.3 : Position of Twin Horn Ice Aerofoil placed in Test Section for measuring pressure distribution
Table 5.1 : Drag and Lift Force for Blank and Twin Horn Iced Airfoil
S.No AOA
α (Deg)
Blank Airfoil Twin Horn Iced Airfoil FD (kgf) FL (kgf) FD (kgf) FL (kgf)
1 -20 -0.9 -0.68 -0.62 -1.18 2 -15 -0.7 -0.87 -0.39 -1.34 3 -10 -0.59 -0.66 -0.26 -1.13 4 -5 -0.39 -0.25 -0.09 -0.57 5 0 -0.22 0.08 -0.05 -0.19 6 5 -0.36 0.44 -0.13 0.06 7 10 -0.57 0.76 -0.31 0.32 8 15 -0.73 0.94 -0.45 0.48 9 20 -1.01 0.45 -0.66 0.12
VI.MODEL CALCULATIONS
The drag coefficient, lift coefficient and pressure coefficient values are determined using the following relations for blank and twin horn iced airfoil.
For Blank Airfoil:
Angle of attack (α) =00
Difference of manometer reading in Pitot tube, (q) =2.8 cm
The air flow velocity is determined from Pitot tube using the equation
q
V
13
=132
.
8
=21.75 m/s Chord=16 cm=0.16 mSpan=25 cm=0.25 m
Area, A=chord length ×span=0.16×0.25=0.04 m2 Air density=1.225 kg/m3
-0.01898 04 . 0 75 . 21 225 . 1 2 1 22 . 0 2
1 2 2
A V F C air D D 3 -2 2 10 6.902 04 . 0 75 . 21 225 . 1 2 1 08 . 0 2
1
A V F C air L L
Atmospheric pressure, Patm=17.5 cm of water
Difference of manometer reading in Pitot tube (q) =4.2 cm
Static pressure, P=18.4 cm of water
2142
.
0
2
.
4
4
.
18
5
.
17
q
P
P
C
atm PVII. RESULTS AND DISCUSSIONS
The below discussion shows the results of experimental investigation carried out by means of wind tunnel for blank and twin horn iced airfoils. The variation of static pressure, lift and drag has been shown below for various angles of attack for both blank and twin horn iced airfoil.
7.1 COMPARISON OF DRAG AND LIFT COEFFICIENT FOR BLANK AND TWIN HORN ICED AIRFOIL
Graph7.2: Angle of attack vs Lift Coefficient for both Blank & Twin Horn Ice Airfoil
From Graphs 7.1 &7.2, it can be seen that the drag coefficient of twin horn iced airfoil gradually increases with increasing positive and negative angles of attack and the lift coefficient gradually decreases with increasing positive and negative angles of attack when compared to blank airfoil. The maximum drag and minimum lift occurred at α=00 and α=-150 respectively.
7.2 COMPARISON OF COEFFICIENT OF PRESSURE AT UPPER AND LOWER SURFACES WITH DIFFERENT AOA FOR BLANK AND TWIN HORN ICE AIRFOIL
The static pressure distribution on the upper and lower surfaces of a blank and twin horn iced airfoil has been measured by using multi-tube manometer. Pressure coefficient values are determined along the chord length for different angles of attack and graphs are drawn between the non-dimensional distance and Pressure coefficient for blank and twin horn iced airfoil at upper and lower surfaces with different angles of attack.
Graph 7.3: Relationship between Non-dimensional distance vs Coefficient of pressure at -50AOA at
upper surface
Graph 7.4: Relationship between Non-dimensional distance vs Coefficient of pressure at 00AOA at
upper surface
Graph 7.5: Relationship between Non-dimensional distance vs Coefficient of pressure at 50AOA at
upper surface
Graph 7.6: Relationship between Non-dimensional distance vs Coefficient of pressure at -50AOA at
Graph 7.7: Relationship between Non-dimensional distance vs Coefficient of pressure at 00AOA at
lower surface
Graph 7.8: Relationship between Non-dimensional distance vs Coefficient of pressure at 50AOA at
lower surface
From the graphs 7.3,7.4,7.5,7.6,7.7 &7.8, for an AOA -50, 00 and 50 it is observed that pressure coefficient increases on the upper surface and decreases on lower surface of the twin horn iced airfoil when compared to blank airfoil along the non–
dimensional distance.
From the graph 7.3, for an angle of attack -50, it is observed that the pressure coefficient varies with the non-dimensional distance for both the blank and twin horn iced airfoils. It is observed that Cp values are high for twin horn iced airfoil on upper surface and low on lower surface when compared with the Blank Airfoil. Almost all similar behavior was observed for the angles of attack 00, -50and 50as shown in the graphs 7.4, 7.5, 7.6, 7.7 and 7.8 respectively.
VIII.CONCLUSION
Wind tunnel experiments for blank and twin horn iced airfoils shows that the lift force is decreasing and drag force increases with varying angles of attack for twin horn iced airfoil when
compared to the blank airfoil. The maximum drag force is -0.05 kgf at α=00and minimum lift force is
-1.34 kgf at α=-150. The static pressure distribution is varying along the non-dimensional distance. Cp values are decreasing from LE on lower surface and increasing on upper surface for twin horn iced airfoil when compared to blank airfoil. The performance of a twin horn iced airfoil proved to be significantly worse when compared to a blank airfoil.
IX.FUTURE SCOPE
The "Experimental Investigation of Ice Accretion Effect on NACA 0018 Airfoil" can be enhanced by modifying the twin horn ice shape and size with different angles of attack and then results can be compared with blank airfoil. The same analysis can be carried out for different airfoil structures using any simulation software.
X.REFERENCES
[1]Kim H. Effects of Leading-Edge Ice Accretion Geometry on Airfoil Performance. MS thesis, Dept. of Aerospace Engineering, Univ. of Illinois, Urbana, IL, 2004.
[2] Olsen W, Shaw R, and Newton J. Ice Shapes and the Resulting Drag Increase for a NACA 0012 Airfoil. NASA TM-83556.
[3] Bragg MB, Khodadoust A. Experimental Measurements in a Large Separation Bubble due to a Simulated Glaze Ice Shape. AIAA Paper 88-0116, 1988.
[4]Blumenthal, LA. Surface Pressure Measurement on a Three-Dimensional Ice Shape. MS thesis, Dept. of Aerospace Engineering, Univ. of Illinois, Urbana, IL, 2005.
[4] Bragg MB, Gregorek GM. Aerodynamic Characteristics of Airfoils with Ice Accretions. AIAA Paper82-0282, 1982.
[5] Broeren AP, Addy HE, Bragg MB. Flowfield Measurements About an Airfoil with Leading-Edge Ice Shapes. AIAA Paper 2004-0059, 2004.
[6] Bragg MB, Gregorek GM. Wind Tunnel Investigation of Airfoil Performance Degradation Due to Icing. AIAA Paper 82-0582, 1982.
[8] Lee S, Dunn T, Gurbacki H, Bragg MB, Loth E. An Experimental and Computational Investigation of Spanwise-step-ice Shapes on Airfoil Aerodynamics. AIAA Paper 98-0490, 1998.
[9] Gurbacki H. Private Communications. Univ. of Illinois at Urbana-Champaign, Urbana, IL, April 2003.
[10] Lee S, Kim HS, Bragg MB. Investigation of Factors that Influence Iced-Airfoil Aerodynamics. AIAA Paper 2000-0099, 2000.
[11] Abbott IH, von Doenhoff AE. Theory of Wing Sections. New York: Dover, 1959.
[12] Hoerner SF. Fluid-Dynamic Lift. Brick Town, NJ: Hoerner Fluid Dynamics, 1975. pp. 4-19.
[13] Morgan HL, Ferris JC, McGhee RJ. A Study of High-Lift Airfoils at High Reynolds Numbers in the Langley Low-Turbulence Pressure Tunnel. NASA TM-89125, 1987.