ISSN 0956-8549-698
Borrow Cheap, Buy High? The Determinants of Leverage and Pricing in Buyouts
By Ulf Axelson Tim Jenkinson Per Strömberg Michael S. Weisbach
FINANCIAL MARKETS GROUP DISCUSSION PAPER 698
January 2012
Ulf Axelson joined the London School of Economics in 2009. Since February 2010, he is the Abraaj Capital Reader in Finance and Private Equity and the director of the MSc in Finance and Private Equity program. His research lies within the fields of private equity, financial innovation and security design, corporate finance, auction theory, and financial intermediation. His research has been published in leading finance journals and has been widely presented at leading universities as well as numerous conferences. He has won various prizes and his research was awarded the Henderson Award for Excellence in Economic Theory in 2000. He received his PhD in Financial Economics from Carnegie Mellon University and holds an MBA (civilekonom) from the Stockholm School of Economics. Tim Jenkinson is Professor of Finance at the Saïd Business School, and is Director of the Oxford Private Equity Institute. He is also Chairman of the economic consulting firm Oxford Economic Research Associates (Oxera), a director of the UK-listed investment fund PSource Structured Debt (LSE: PSD), and an academic advisor to KPMG's Global Valuation Institute. He has consulted for a large number of companies, regulators, government agencies and industry associations. He is a Professorial Fellow of Keble College, Oxford. He obtained a DPhil in Economics from Oxford. Per Strömberg is the SSE Centennial Professor of Finance and Private Equity at the Stockholm School of Economics. Starting December 2011, he is the director of the Swedish House of Finance (SHOF), a new Swedish national center for financial research, which is a cooperation between SIFR, the Stockholm School of Economics, and Vinnova. Strömberg joined SIFR in 2004 as a Senior Research Fellow and was director of SIFR between 2008 and 2011. He is also Adjunct Associate Professor of Finance at the University of Chicago Booth School of Business. He received his Ph.D. in Financial Economics from Carnegie Mellon University and holds an MBA (civilekonom) from the Stockholm School of Economics. Dr Michael S. Weisbach is the Ralph W. Kurtz Chair in Finance, as well as a Research Associate of the National Bureau of Economic Research. He has previously taught at the University of Illinois, the University of Chicago, the University of Rochester, and the University of Arizona. He is an editor of The Review of Financial
Studies, one of the leading academic journals in finance, and has been an associate editor of five other
academic journals. He is a senior advisor of The Brattle Group, a Cambridge, Massachusetts business-economics and litigation-support consulting firm. He has broad-ranging research and teaching interests in finance and economics, with specialties in corporate finance, corporate governance, and private equity. He obtained a PhD in Economics from the Massachusetts Institute of Technology. Any opinions expressed here are those of the authors and not necessarily those of the FMG. The research findings reported in this paper are the result of the independent research of the authors and do not necessarily reflect the views of the LSE.
Borrow Cheap, Buy High?
The Determinants of Leverage and Pricing in Buyouts
Ulf AxelsonLondon School of Economics and SIFR Tim Jenkinson
Saïd Business School, Oxford University and CEPR Per Strömberg
SIFR, Stockholm School of Economics, CEPR, and NBER Michael S. Weisbach*
Ohio State University and NBER
Abstract
Private equity sponsors pay special attention to designing capital structure, making buyouts an interesting setting for examining capital structure theories. In a detailed international sample of buyouts, we find that buyout leverage is unrelated to factors that drive public firm leverage, such as industry factors and other cross-sectional characteristics, contrary to what standard capital structure theories suggest. Instead, variation in economy-wide credit conditions is the main driver of leverage and pricing in buyouts, while having little impact on public firms. Higher deal leverage is associated with lower buyout fund returns, suggesting that acquirers overpay when access to credit is easier.
January 2012
Keywords: Private equity, capital structure, buyouts, credit cycles
* Contact information: Ulf Axelson, London School of Economics, Houghton St., London WC2A 2AE, UK, email:
[email protected]. Tim Jenkinson, Said Business School, Oxford University, Park End Street, Oxford. OX1 1HP, UK, email: [email protected]. Per Strömberg, SIFR, Drottninggatan 89, 113 60 Stockholm, Sweden, email: [email protected]. Michael Weisbach, 740 Fisher Hall, 2100 Neil Ave., Ohio State University, Columbus, OH 43210, USA; email: [email protected]. Earlier versions of this paper were circulated under the title “Leverage and pricing in buyouts: An empirical analysis.” We are very grateful to Steve Kaplan for sharing his data on 1980’s LBOs, and to Joakim Bång, Ji-Woong Chung, and Reimo Juks for excellent research assistance. We would also like to thank Viral Acharya, Malcolm Baker, Laura Bottazzi, Phil Canfield, Chris Collins, Marco DaRin, Francois Derrien, Chris James, Steve Kaplan, Steven Ongena, Morten Sorensen, David Sraer, Ayako Yasuda, as well as participants in numerous seminar presentations for valuable comments.
Private equity investors are expert, repeat, and largely financially motivated players in capital markets. Throughout a career of making leveraged buyouts (LBOs), they arguably make more decisions about firm capital structure than any other agents in the economy.1 Hence, private equity investors’ financing choices are potentially informative about theories of optimal capital structure. Yet, unlike publicly-traded firms, we know little about what determines leverage and pricing in these buyouts. Our goal in this paper is to fill this gap by documenting the factors that affect the financial structure of private equity backed buyout firms in detail, and to contrast these factors with those related to the capital structure of a matched set of publicly traded firms. In doing so, we shed light on both the particular functionings of the increasingly important private equity market, and also on capital structure questions more broadly.
A useful simplication for thinking about buyout capital structure is to contrast two broad views that have been expressed in both academic literature and the popular press. In the first view, most famously put forth by Michael Jensen (1989), private equity backed firms have superior governance to publicly traded firms. Together with active boards, high-powered management compensation, and concentrated ownership, Jensen argued that leverage is an essential part of the private equity governance model. Unlike public firms, private equity funds optimize the capital structure in companies they acquire, to take full advantage of the tax and incentive benefits of leverage, trading these benefits off against the costs of financial distress. An implication of this view is that characteristics related to the debt capacity of a given firm, such as its industry, the tangibility of its assets, and the volatility of its cash flows, should explain capital structure in buyouts.
A second view is that the most important factor in buyout capital structures is the ability of buyout sponsors to use cheap debt to take levered bets on firms. Private equity sponsors are uniquely positioned to time the market by arbitraging debt versus equity when leverage is relatively cheap, due to superior access to debt financing (as suggested by Ivashina and Kovner (2011) and Demiroglu and James (2010)). In addition, private equity sponsors have agency problems of their own that are likely to affect their choice of leverage in their portfolio companies. Axelson et al. (2009) present a model in which private equity sponsors tend to overinvest, undertaking value-decreasing investments in addition to value-increasing ones, because of their option-like compensation. If sponsors are capital-constrained, so that they must
raise external debt in order to complete deals, limited partners have some protection against this tendency of general partners to overinvest. However, the model predicts that when access to debt is “easy”, private equity funds will nonetheless have an incentive to lever up as much as possible and to overpay for deals.2 Both the market timing and the agency stories share the common prediction that time-series variables measuring economy-wide debt market conditions should explain buyout leverage better than cross-sectional firm characteristics.
To study the factors affecting buyout capital structure, we construct a new database containing detailed information about the financing of a large sample of buyouts. This sample contains 1157 buyouts, 694 of which were of North American firms, and the remaining 463 of which were of firms from 24 different countries outside North America, mainly in Western Europe. For each buyout in the sample, we obtain detailed information about the financial structure of the transactions. Unlike most previous work, our sample include buyouts of private companies, such as family firms, corporate divisions, and companies acquired from other private equity firms, in addition to buyouts of publicly-traded firms. The sample covers the period from 1980 through 2008, which allows a much longer temporal analysis than in most previous studies.3 Our data includes deals from a total of 176 distinct private equity sponsors and incorporates practically all the major investors active in the market during our period of study.
We first consider the issue of whether buyout leverage appears to be determined by the same factors as comparable publicly-traded firms using a matched sample of buyouts and public firms in the same industry, region, and time period. Very surprisingly (at least to the authors), there appears to be absolutely no relation between leverage in buyout fims and median leverage of public firms in the same industry-region-year, regardless of what leverage measure we use. This result holds when we match our LBO sample to subsamples of public firms that have adjusted their leverage significantly over the last years, or when we consider long-run LBO leverage using repayment schedules, alleviating concerns that the lack of relationship is due to an unrepresentative matching procedure. Furthermore, when we restrict our analysis to the
2 Consistent with this argument, Kaplan and Stein (1993) provide evidence suggesting that the booming junk bond markets of the late 1980s led to an overheated private equity market, with low private equity fund returns as a consequence. Ljungqvist, Richardson, and Wolfenzon (2007) find that buyout funds accelerate their investment flows when credit market conditions loosen, but do not address how the leverage or pricing of individual deals vary with credit market conditions. More recently, Gorbenko and Malenko (2009) present evidence that financial buyers bid more aggressively in auctions for firms when credit conditions are stronger.
3 Guo, Hotchkiss, and Song (2011) study a sample of U.S. public-to-private transactions from 1990 through 2006. Some recent studies have considered the motives of other kinds of buyouts: Boucly, Sraer and Thesmar (2011) and Chung (2011) examine the performance of buyouts of private companies, while Wang (2011) and Jenkinson and Sousa (2011) study secondary buyouts.
subsample of 142 public-to-private deals for which we have information about pre-LBO financials, we also find that there is no relationship between buyout leverage and pre-LBO leverage.
Given that the amount of leverage used by buyouts and matched public firms have little or no relation, what does determine leverage in buyout firms? Cross-sectional characteristics such as industry fixed effects or variables such as profitability, earnings volatility, and growth opportunities, which explain most of the variation in public company leverage, have little explanatory power for buyout leverage. Instead, most of the variation in buyout leverage is explained by time-series effects. The one robust predictor of LBO leverage we find is the prevailing condition of debt markets; the higher the credit risk premium of leveraged loans, measured as the high-yield spread over LIBOR, the lower the leverage used in the buyout transactions. As a consequence, leverage in the LBO deals is pro-cyclical, with leverage peaking during "hot" credit market conditions, such as in 2006-2007, and falling when debt markets deteriorate, such as in 2008-2009. In contrast to the procyclicality of buyout leverage, we find that a matched set of public firms exhibits countercyclical leverage.
We then examine whether the availability of leverage leads private equity funds to pay higher purchase price multiples for the firms they acquire. We find that this is indeed the case, with buyout pricing being strongly negatively related to current market interest rates on leveraged loans, even after controlling for pricing in public markets. We also show that the impact of debt markets conditions on buyout leverage and pricing holds in a time-series regression, controlling for a large set of macroeconomic variables, and using several alternative measures of debt market conditions.
The finding that both leverage and pricing in buyouts are strongly dependent on credit market conditions could potentially be explained because variation in our high-yield spread reflects variation in the economy-wide discount rate. When discount rates are low, real interest rates are low, so, for a given level of cash flow, firms should be able to take on more debt and still be able to meet interest payments. Similarly, when discount rates are low, price multiples should be high. However, the discount rate effect on price multiples should be similar for both LBOs and matched public firms. Since the high-yield spread is a strong predictor of LBO prices after controlling for public firm multiples, we find a pure discount rate explanation implausible. Instead, the results are more consistent with stories in which the extra leverage that LBO funds take on when credit market conditions are good makes them willing to pay higher prices, over
and above prevailing prices in public markets. This effect could occur either because private equity funds are particularly proficient at arbitraging cheap debt against equity, or because of agency problems between private equity sponsors and their investors.
To distinguish between these explanations, we estimate equations measuring the impact of leverage on fund returns. Contrary to the basic cost of capital prediction that, holding other factors constant, returns to equity should increase with leverage, we document that the leverage of the deals in a particular fund is negatively related to the return of that fund (measured relative to returns on public stock markets), controlling for other relevant factors. This finding is consistent with an agency story in which private equity funds overpay for deals at times when leverage is cheap.
As an additional test between the agency explanation and the story in which leverage occurs because of arbitrage between debt and equity markets, we split leverage into the component of leverage explained by variation in debt markets and residual leverage. If funds were able to arbitrage debt markets against equity markets when debt is “cheap”, we would expect the predicted component of leverage to have a positive impact on fund returns. However, we instead find that both components of leverage have a negative impact on returns, which is inconsistent with a market-timing story and in favor of the agency story.
Our findings contribute to the literatures on both private equity literature and capital structure. First, our findings contribute to the literature on private equity fund returns, e.g. Kaplan and Schoar (2005), and Gottschalg and Phalippou (2009). In particular, we document how excess leverage could have led to disappointing returns for many private equity funds.
Our paper also relates to the literature on LBO financial distress. Our results support the arguments of Kaplan and Stein (1993) that hot credit markets can lead to excess leverage, which can in turn lead to high subsequent default rates. Whether this imposes a major cost on the economy is an open question. Some evidence, e.g. Andrade and Kaplan (1998), Bernstein et al. (2010), and Hotchkiss et al (2011) suggests that these costs are not likely to be particularly large, but more research is needed here.
In terms of the broader capital structure literature, our paper is related to work by Berger et al. (1997) and others who analyze how the corporate governance of firms affects their capital structures. Our paper is also related to literature on market timing in capital structure (e.g. Baker and Wurgler (2002), and Welch (2004)), and to the recent literature emphasizing the importance of supply-effects for leverage (e.g. Leary (2009)). Our results suggest that taking advantage of
market timing or excess supply of funds can actually be value-decreasing for firms when owners have agency issues of their own.
The remainder of the paper is structured as follows. In the next section we describe the theoretical frameworks we use for analyzing capital structure. Section II describes our sample and the multiple sources from which we derive our data. Section III contains our empirical analysis, and Section IV concludes.
I. The Financial Structure and Pricing of LBOs and Public Firms: Theoretical Roadmap In this section, to motivate our empirical tests, we describe in more detail the theoretical frameworks that provide us with testableimplications about the factors affecting leverage. While most theories of capital structure were designed to explain financing in public firms, they could, in principle, apply to buyouts as well. We also discuss reasons why leverage could be chosen differently in buyouts than in public firms.
A. View 1: Leverage is driven by firm characteristics
Perhaps the most commonly used explanation for leverage is the trade-off theory, in which capital structure is chosen so that the tax and incentive advantages of debt exactly offset bankruptcy costs at the margin (see Myers (2001) for a detailed discussion). The trade-off theory is often augmented with some version of the pecking order theory of Myers and Majluf (1984), in which the issuance of securities is costly due to information asymmetries, leading firms to stray from the optimal target leverage.
Both the trade-off and the pecking order theories suggest that the capital structure of a firm should be tailored to the characteristics of that firm’s assets. For example, profitable firms with stable cash flows should have high leverage, since they are better at utilizing debt tax shields and have lower probabilities of financial distress, and costs of financial distress are likely to be higher for firms with more investment opportunities and more intangible assets.
The pecking order theory predicts that firms that have historically been more profitable, so that they have not needed to issue securities to finance investments, will end up with lower leverage, even if the pure tradeoff theory would suggest that more profitable firms should take advantage of debt tax shields and incentive benefits. The pecking order argument is less likely to explain leverage in buyouts than in public firms since buyout leverage is calculated at the time of
the transaction, so there will have been no time for the firm to drift away from the target capital structure.
If both LBO sponsors and managers of public firms act according to the trade-off theory, there should be a relation between LBO leverage and the leverage of public firms with similar characteristics. We test this idea below, and also relate LBO and public firm leverage to industry characteristics, the idea being that, according to the trade-off theory, the same industry-level factors determine leverage at the margin for both buyout and public firms. Therefore, changing one of these factors should have a qualitatively similar effect for both types of firms.
B. View 2: Leverage is driven by market-wide time-series characteristics (i) Market Timing
Baker and Wurgler (2002), among others, suggest that managers take advantage of mispricing in equity markets when issuing securities, so that they issue much more when equity markets are overpriced than when they are underpriced. Similarly, it is possible that debt markets periodically become “overheated”, leading investors not to receive the full interest rate corresponding to the fundamental underlying risk of a firm. Managers aware of this market imperfection should take advantage of it, and issue more debt when the debt markets are overvalued.4 The market-timing hypothesis is also consistent with the stated view of many private equity practitioners, who often argue that one of the ways in which private equity funds make money is by increasing leverage of deals in response to hot credit market conditions to arbitrage the conditions between debt and equity markets.5 In contrast, a CFO of a public company when asked the same question will usually discuss the importance of maintaining financial flexibility and express concern over distress costs (see Graham and Harvey (2001)). The market-timing story implies that buyout leverage should respond more to debt market conditions than to the firm characteristics suggested by the trade-off theory, and they should also be willing to pay higher prices when debt financing is “cheap”. This pattern should also hold for public firms, unless private equity sponsors are better at timing debt markets than the managers of stand-alone firms. Importantly, to the extent that the competition for deals between private equity funds is not strong enough to pass on all the value increase from cheap debt to target
4 Related to this argument, the results in Baker, Greenwood, and Wurgler (2003) suggest that public firms use debt market conditions in an effort to determine the lowest-cost maturity at which to borrow.
5 For example, Guy Hands, founder of private equity firm Terra Firma, stated: “We buy stuff with cheap debt and arbitrage on the difference with equity markets”. Financial Times, November 15, 2007.
shareholders, the market-timing hypothesis also predicts that fund returns should be higher when the private equity sponsors are able to use higher leverage to finance individual deals.
(ii) GP-LP Agency Conflicts
Just as there are agency problems between CEOs and owners that can explain leverage choices for public firms, there are potential agency problems between the private equity fund managers (the “GPs”) and the investors in the fund (the “LPs”) that could explain leverage choices in buyouts. In particular, because of the limited liability of GPs and the option-like carry contract they hold on fund returns, GPs are prone to overinvestment, and potentially will be willing to gamble by taking big levered stakes in portfolio firms.6 Axelson, Strömberg, and Weisbach (2009) provide a model in which these overinvestment tendencies of GPs are mitigated by capital constraints, so that it is optimal to require GPs to go to external capital markets and raise debt whenever they want to make an investment. When liquidity in debt markets is high and/or interest rates are low, GPs can add more leverage to their deals and invest more aggressively, increasing the value of their option and making them willing to overpay for deals relative to fundamental value. Similar to the market-timing theory, this agency story predicts that buyout leverage would be driven more by debt market conditions than by the characteristics of the underlying portfolio firm. In contrast to the market-timing story, however, the agency story predicts that increased leverage can harm investors in private equity funds, so that higher leverage should lead to lower fund returns on average.
II. Data Description
A. Data Sources and Sample Selection.
Our sample selection relies primarily on two commercial databases: Capital IQ and LPC/Dealscan. We use the Capital IQ database to construct a base sample of private equity transactions. The base sample contains all private placement and M&A transactions in Capital IQ in which the acquirer includes (at least) one investment firm that has a reported investment interest in one of the following stages: Seed/startup, Early venture, Emerging growth, Growth capital, Bridge, Turnaround, Middle market, Mature, Buyout, Mid-venture, Late venture,
6 The typical contract between GPs and LPs in a buyout fund is that GPs get a “carried interest” of 20% of all profits (after fees borne by investors) provided the rate of return (as measured by IRR on invested capital) exceeds a stipulated hurdle rate; but the GPs earn no carried interest if the fund does not exceed the hurdle rate.
Industry consolidation, Mezzanine/subdebt, Incubation, Recapitalization, or PIPES. From this sample, we select all M&A transactions classified as ‘leveraged buyout,’ ‘management buyout,’ or ‘going private’ that were announced between January 1986 and July 2008. Capital IQ contains information on the details of the transaction, such as the buyers and sellers, the target company identity, transaction size, and for a subset there is financial accounting information (primarily for public-to-private transactions and LBOs involving public bond issues).7
From the sample of Capital IQ buyouts we construct a list of all private equity firms that appear as acquirers in at least five LBO transactions. For each of these private equity firms we extract information from the LPC/Dealscan database on all syndicated loans for which one of these firms acts as a sponsor, producing a total of 5678 loans. From this list we exclude loans that did not back the original leveraged buyout transaction (i.e. refinancings and recapitalizations as well as loans financing subsequent add-on acquisitions by the LBO target), ending up with 2467 LBO loans.
Since Dealscan coverage improves substantially in the late 1990s, we are able to obtain loans for a larger fraction of the recent deals than of earlier ones. In addition, our sample probably oversamples larger deals, which are more likely to use syndicated debt than are smaller deals. Dealscan provides information primarily on the bank loan portion of the capital structure, but using the deal descriptions provided by Dealscan and Capital IQ, we also find information on other types of debt such as vendor financing, assumed debt, bonds, as well as equity used in the deal. We also use Capital IQ, SDC, Mergent, and Edgar filings to track down additional public bond issues. In a handful of cases, we infer information about additional subordinated debt from the difference between total debt and senior debt ratios in Dealscan.
To calculate our capital structure variables we also require information on the earnings (before interest, taxes, depreciation and amortization - or EBITDA) of the LBO target at the time of the buyout. For 649 observations this information is included in the Dealscan data, either explicitly or implicitly in terms of a multiple of total debt, or senior debt, to EBITDA. Using Capital IQ, Compustat, and Bureau van Dijk’s Amadeus database, we are able to find EBITDA information for another 425 observations.
Finally, we supplement our sample with the Kaplan (1989a, b) sample of 83 buyouts from the 1980s. These buyouts predated the development of the syndicated loan market, so would
clearly not have entered our sample otherwise.8 Through this process, we end up with a sample of 1157 buyouts occuring between 1980 and 2008.
An important part of our analysis is to match these private equity buyouts with comparable publicly-quoted companies. For public company financial information, we rely on the Compustat North America and Compustat Global databases to calculate matched median financial characteristics for public companies in the same year, region (North America, Western Europe, and Rest of World), and industry as the corresponding buyout transaction, using the Fama and French (1997) classification of firms into 49 industries. We date the buyout by the closing date of the syndicated loan package, as reported by Dealscan.
Our analysis also requires information about debt market conditions and other macroeconomic variables. Our debt market condition variables include the U.S. high-yield spread, defined as the U.S. high-yield rate for the corresponding month according to the Merrill Lynch High-Yield index (obtained through Datastream) minus U.S. LIBOR (obtained from the British Bankers’ Association); the S&P Earnings/Price ratio (obtained from Compustat) minus the high-yield rate, and a credit tightening measure, obtained from the Federal Reserve.9 We also obtain inflation and exchange rates from the IMF.10
Finally, we calculate various private equity sponsor characteristics, such as number of funds raised, fund sizes, and fund returns (public market equivalent measures, described below). Data on each fund’s inception date, size, and sequence number relative to other funds raised by the same sponsor are constructed by combining observations from Capital IQ and Preqin, both of which provide independently collected, and somewhat non-overlapping, data on these variables. Preqin has data on 9,523 buyout and venture funds as of June 2009, covering about 70% of all capital ever raised in the private equity industry and is also our source for fund returns. Traditional sources of data on private equity returns rely on self-reporting by GPs and/or LPs and are likely to suffer from sample selection biases. However, 85% of the data gathered by Preqin is
8 We are grateful to Steve Kaplan for providing us with this data.
9 We use the Senior Loan Officer Opinion Survey on Bank Lending Practices survey, which is conducted quarterly by the US Federal Reserve Board (source: http://www.federalreserve.gov/boarddocs/SnloanSurvey/). We focus on the net percentage of domestic loan officers at medium and large banks reporting a tightening of standards for loans. Lown, Morgan, and Rohatgi (2000) document that these survey results are strongly related to loan growth, with tightening standards being associated with slower loan growth.
10 We have also used average spreads on leveraged loans for the U.S. and European markets over LIBOR, obtained from Standard & Poor’s. We were only able to obtain these from 1997 and onwards, but for this period the results are virtually identical to those using the spread variable based on the Merrill Lynch High-Yield Index.
collected via Freedom of Information Act requests and consequently should not be subject to such self-reporting biases.
Direct information about which exact fund each deal belongs to is only available in about a third of the cases (through Capital IQ). When this information is not available, we match a deal to the sponsor fund that was actively investing in the time period and region of the deal. We match 1099 out of our 1157 deals to a particular fund. The unmatched deals are done by sponsors who do not use a fund structure for their investments.
B. Sample Characteristics and Representativeness
Out of our sample of 1157 buyouts, 694 (60%) are of North American firms, 463 (39%) are of Western European firms, and 10 (1%) are of firms located in the rest of the world. In contrast to previous papers that have focused on U.S. deals, our sample is more representative of the universe of all buyouts. Still, our sample overweights U.S. buyouts relative to the rest of the world for two reasons.11 First, our sample selection relies on Dealscan for capital structure information, which mainly covers syndicated bank loans. Deals outside of U.S. and Western Europe tend to be smaller and therefore rarely use syndicated loans. Second, our 1980s deals are taken from Kaplan (1989 a,b), whose sample is restricted to U.S. buyouts.
Unlike most previous research, our sample is not restricted to public-to-private deals. It does contain 368 (32%) public-to-private buyouts, but also contains 167 (14%) buyouts of independent companies, 320 (28%) divisional buyouts, and 293 (25%) buyouts of firms already owned by other private equity firms, called secondary buyouts. Because our sampling procedure tends to overweight large deals relative to small ones, our sample is still somewhat biased towards public-to-private deals (which tend to be larger) and against independent private companies (which tend to be smaller).
Around 75% of our sample transactions occurred between 2001 and 2008, compared to 63% in the Capital IQ population. This oversampling of deals for this period is probably indicative of the syndicated bank loan market becoming increasingly important over the last decade.
11 Strömberg (2008) presents data on the universe of buyouts reported in Capital IQ, where 47% are from North America, 45% are from Western Europe, and 8% are from the rest of the world. Also, 46.8% of the transactions in Capital IQ are independent private companies, while public to private transactions only account for 6.5% of the transactions.
Further information on the sample is contained in the Internet Appendix. Table IA.I provides breakdowns of the sample across region, time and type of LBO. Table IA.II provides breakdowns of the sample by country and industry. In addition to the U.S., the U.K. and France are the most common countries represented. The sample is widely distributed across industries, with no one industry representing more than 10%. Table IA.III shows that the sample is spread across a wide range of buyout firms. KKR is the most common sponsor, with 61 deals, but still represents only 5.3% of the total sample.
To summarize, although our sample is more representative of the buyout population than samples used in other studies, because it is constructed through information gathered through the syndicated loan market, the sample overweights larger deals, public-to-private transactions, U.S. transactions, and more recent buyouts. In our formal tests, we control for region, buyout type, and size, and we cluster our standard errors by deal year in our regressions.
III. Results
A. Descriptive statistics on leverage and valuation in buyout transactions
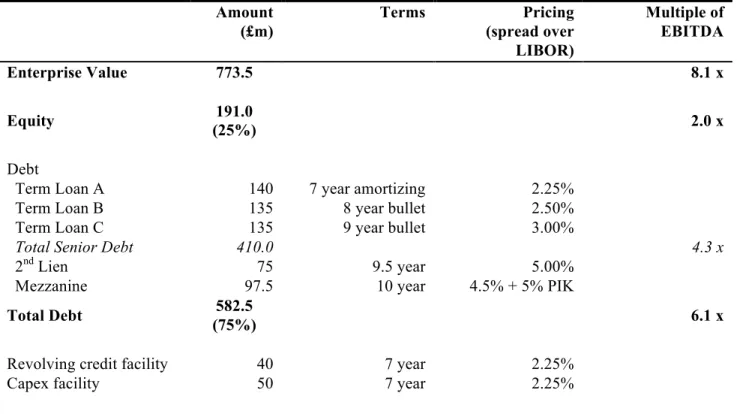
In Table I we present an example of a buyout capital structure using one of the transactions in our sample, the purchase of the U.K. tire and exhaust-fitting company Kwik-Fit in 2005. This transaction used a capital structure that was typical for buyouts conducted at that time and as such, we discuss this financial structure in some detail.
Kwik-Fit was bought by private equity house PAI for an enterprise value of £773.5m. The purchase was financed using £191m of equity (provided by funds advised by PAI) and £582.5m of debt. The initial debt/equity ratio was therefore 75% debt and 25% equity, which is typical for the buyouts in our sample. The debt was structured into senior and subordinated tranches. The senior debt was divided into three separate term loans of roughly equal sizes but with different maturities, payment schedules and seniorities. One tranche, called Term Loan A, had a 7-year maturity and was amortizing, while Term Loans B and C were not amortizing, with the principal being repaid in a final “bullet” payment at the end of the term (or at redemption if earlier). In addition to the term loans, the company obtained a revolving credit facility and a capex facility both of which, if drawn, would rank as senior debt.
In addition to the senior debt and facilities, the transaction was financed with two tranches of subordinated debt: a 2nd lien tranche of £75m, which was senior to a mezzanine tranche of £97.5m. 2nd lien tranches started to appear in buyouts during 2004, and are now a very common
feature of buyouts’ capital structures. The interest payments on mezzanine debt include cash interest of 4.5%, together with “pay-in-kind” interest of an additional 5% (i.e. instead of cash, the holders are issued additional notes equal to the value of 5% of the outstanding principal each year).
In practice, Term Loan A and the revolving facilities are usually kept on the balance sheet of the originating bank after the transaction, while bullet payment Term Loans B, C etc. as well as the subordinated tranches are often securitized or sold to institutional investors, such as hedge funds.
Table II details the debt structure for the whole sample. In our sample, 62.2% of deals use amortizing debt (Term Loan A), while 89.3% use bullet debt (Term Loan B). The use of amortizing debt declined noticeably in the years leading up to the financial crisis as lenders were increasingly prepared to lend on a non-amortizing basis. Table II also presents the fraction of debt financing accounted for by each type; amortizing bank debt averages 23.4% of total debt while bullet debt comprises 46.2%. Other important sources of debt are mezzanine (9.9%) and junior bonds (9.3%).
In some transactions loans are provided by the private equity fund itself (“Sponsor loans”), or by the seller in the buyout transaction (“Vendor loans”), and existing loans are sometimes retained rather than refinanced (“Assumed debt”). As Table II shows, these loans are, on average, not a particularly large part of the debt, representing in total around 2.5% of total debt financing. We also observe preferred equity in a few deals, which can have “debt-like” features, but we do not include preferred equity in our definition of debt.
Throughout our analysis we distinguish between “regular” or non-contingent debt, and contingent debt, such as revolving credit facilities, capital expenditure and acquisition lines of credit, or stand-by letters of credit. Most of the contingent debt is not drawn at the time of the transaction, but rather intended for future funding of working capital, add-on acquisitions or other types of investment. We do not include contingent debt in our definition of total debt when calculating our leverage ratios, since the draw-down of contingent debt would be concurrent with a subsequent investment in the firm, which in turn would involve a change in enterprise value (EV) and EBITDA. As is indicated in Table II, buyouts use substantial quantities of contingent debt; these additional facilities amount to nearly 18% of the value of total (non-contingent) debt.
Table II also documents the spreads on the debt and the proportion of the debt that is due in less than 5 years. Not surprisingly, the senior debt (the term loans and revolving credit
facilities) has a substantially smaller spread than the junior debt. Also, the effect of amortization is clear: the majority of the Term Loan A and the bridge loans have to be paid off in less than 5 years but a very small fraction of all the other types of debt are due that quickly. The maturity, and sometimes also the spread, is often missing for vendor and sponsor loans in our sample. When we need these to calculate leverage ratios we assume that (a) the interest rate on these loans equals the local LIBOR rate plus the U.S. high-yield spread over U.S. LIBOR, and (b) that the debt is non-amortizing. Although these assumptions are somewhat arbitrary, they have very little impact on our results given the small fraction of total debt these loans represent.
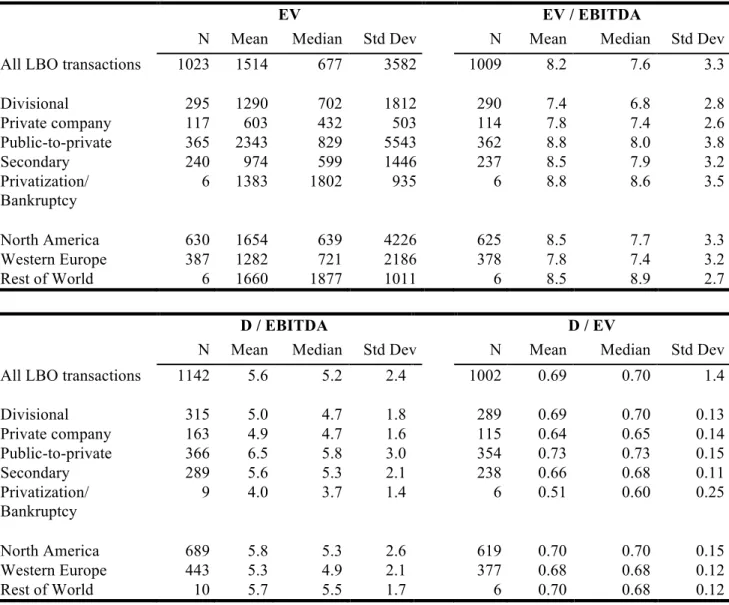
Table III documents the size of the buyout transactions, as well as the leverage and pricing of the buyout deals. As expected, our sample clearly contains very large deals; the average (median) LBO enterprise value is just over $1.5 billion 2008 U.S. dollars ($677 million) compared to an average (median) of $330 million ($63 million) for the entire Capital IQ sample (as documented by Strömberg (2008)). Public-to-private deals are the largest type, averaging over $2.3 billion in enterprise value, and include the sample’s largest deal, KKR’s buyout of RJR-Nabisco (enterprise value of $59.5 billion when measured in 2008 dollars). In contrast, independent private deals are the smallest type of deal in our sample, but still average over $600m in enterprise value.
We use two different measures of leverage: total debt divided by earnings before interest and depreciation (“D/EBITDA”) and total debt divided by enterprise value (“D/EV”).12 Our main measure of deal pricing is enterprise value divided by EBITDA. As expected, LBOs are indeed highly leveraged. The average deal in the sample raises 69% of its capital through debt of various forms and has a ratio of debt to EBITDA of 5.6. The EV/EBITDA-multiple paid is 8.2 for the average transaction. Public-to-private deals are the most highly levered, with 73% of capital raised through debt and a D/EBITDA ratio of 6.5. They are also the highest priced transactions, with an average 8.8 EV/EBITDA multiple. Table III also shows significant univariate variation for leverage and pricing across geographies, with U.S. deals (measured by enterprise value in 2008 U.S. dollars) having higher leverage and pricing multiples.
12 As noted earlier, we obtain EBITDA either from Dealscan or from pre-LBO financial statements. One concern is that the former EBITDA numbers could sometimes be pro-forma numbers or forward-looking projections. We have re-run our analysis for the subsamples with different sources, and our results are qualitatively the same.
B. Univariate comparisons with Public Companies
As discussed earlier, the literature has devoted considerable attention to financing choices, but almost always in the context of publicly traded corporations. In Section I, we argued that factors that affect capital structure in public companies could potentially apply to LBOs as well. In addition, other theories such as the market timing or the GP-LP agency-based explanations suggest that private equity firms could have different motivations for the choice of leverage in their portfolio companies than do publicly-traded companies.
To evaluate the extent to which common theories explain leverage in public companies and LBOs, we compare leverage choices in the buyouts in our sample with those in similar public companies. If the same theories explain leverage in both types of organization, we should observe common factors predicting leverage in both.
To perform this comparison, we construct a sample of public companies that are as similar as possible to the sample of LBOs. For each LBO, we take as a matching characteristic the median industry value among the public companies in the Global Compustat database in the same year, same region (North America, Western Europe, Eastern Europe, Asia, or Australia) and same Fama-French industry (using their 49-industry classification) as the LBO.13
For the public companies we calculate the corresponding measures of leverage and pricing as we used for the buyouts. For public company debt we use total long-term debt (including debt due within one year) minus cash and short-term investments. We estimate enterprise value as the market value of equity plus long-term debt minus cash and short-term investment. We calculate the matched median for D/EBITDA for all public companies in the same industry and region using the fiscal year that precedes the closing date of the LBO syndicated loan. When calculating matched EV/EBITDA and D/EV, we use the market value of equity for the public companies in the matched industry-region for the month preceding the closing of the buyout loan, and use the blended averages of EBITDA, cash and long-term debt for the fiscal years preceding and following the buyout loan closing date.14 We exclude public
13 The Fama-French industry classification was first introduced in Fama and French (1997) and has been updated in subsequent work. We used the most recent industry classification as of January 2009 according to Kenneth French’s web site at http://mba.tuck.dartmouth.edu/pages/faculty/ken.french/data_library.html.
14 For example, suppose a buyout closes in March 2000. For all publicly traded companies in the same industry and region, we first calculate the market value of equity at the end of February 2000. For simplicity assume that these publicly traded companies have fiscal years ending December 31. We then calculate blended values of long-term debt, cash, and EBITDA using a weight of 3/12 for the preceding fiscal year-end of December 31, 1999, and 9/12 for the following fiscal year-end of December 31, 2000. We then match the buyout with the median values of EV/EBITDA and D/EV across the publicly traded firms in this group.
companies with negative EBITDA when calculating the industry-region-date median values of D/EBITDA and EV/EBITDA.
Panel A of Table IV performs results from the following experiment: It sorts the matched public company median values into quartiles based on our two measures of leverage. It then presents the medians of the leverage measures for the corresponding buyouts in each of the public company quartiles. If the same factors determine leverage for both groups of companies, then the pattern of leverage across quartiles should be similar. This approach focuses on the cross-sectional pattern of capital structures; even if the buyouts all have higher leverage, there should still be a positive cross-sectional relation if factors related to industry and location have any effect on leverage choices.
By construction, leverage of the public companies increases with the quartile’s rank. Public company D/EV ranges from a median value of 0.19 in the lowest quartile to 0.54 in the highest quartile. However, for the corresponding buyouts there is virtually no difference in leverage across the public company quartiles, with a range of 0.69 to 0.71. The lack of relationship also applies using the D/EBITDA measure of leverage. Whereas the public company medians increase across the quartiles from 2.7 to 5.2, for the buyouts leverage actually decreases, from a median of 5.4 in quartile one to 4.8 in quartile four.
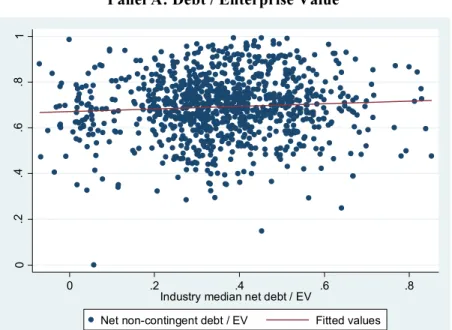
Figure 1 illustrates the (lack of a) relationship between LBO and public company leverage by plotting LBO leverage for each transaction against the matched public company median leverage. Again, for D/EV there is basically no relation (with an R-squared of 0.004) and for D/EBITDA the relationship is slightly negative (with an R-squared of 0.005).
These results suggest that there is virtually no relation between leverage in our sample of buyouts and in the matched public companies. However, it is possible that there is in fact such a relation in the data but we fail to detect it because our matching process is inaccurate. We explore several reasons for potential mismatching in Panels B through D of Table IV.
First, in a typical LBO, the excess cash flow that the firm is generating is used to pay down acquisition debt over time. Hence, it could be that private equity firms choose a higher leverage than their intended target at the time of the deal with the goal of paying down debt and reaching the appropriate target at some point in the future. The implication of this logic is that expected future leverage is a better measure of the firm’s optimal capital structure than leverage at the time of the buyout. To address this possibility, we estimate predicted debt and interest expense five years after the LBO transaction using debt amortization schedules. We then
calculate D/EV, and D/EBITDA based on predicted debt levels (and EV and EBITDA at the time of the transaction) and compare these to matched public company median ratios. The results, presented in Panel B in Table IV, show that there is virtually no relation between predicted LBO leverage and public leverage either and the results are very similar to those in panel A (although LBO leverage ratios are 10-20% lower on average).
Second, it is possible that the matched public companies are not at their optimal capital structure at the time we measure it. Given that firms incur transaction costs when adjusting capital structures, they should only do so infrequently. Consequently, a randomly picked public company could have drifted away from its optimal capital structure at the time when the sample’s capital structure was measured.15 To address this possibility, we consider an alternative set of matched firms, that are restricted to public companies that have adjusted their capital structures in a given year with a change in debt to book assets of more than ten percentage points in absolute value. For this “adjuster” sample, we calculate matched industry-region-year median values of leverage as before. Panel C of Table IV sorts buyouts using leverage quartiles for the adjuster sample. The results are very similar to those obtained before; as in the previous panels, there is no relation between public company leverage and LBO leverage.16
Finally, and related to the previous point, there may be significant heterogeneity in the debt capacity of companies even within an industry-region-year match. Given that LBO transactions rely on the ability of the company to take on debt, it is likely that private equity sponsors select targets within an industry and region that have particularly high debt capacity.17 Unfortunately, we do not observe pre-LBO characteristics for the majority of firms in our sample, since they were private at the time of the LBO. Of the firms that were publicly traded prior to the buyout, we were able to find pre-LBO financial information for a subsample of 166 firms that were purchased in public-to-private transactions. For this subsample, we calculate leverage ratios using the last financial statement available in Global Compustat before the LBO transaction date.
15 See e.g. Fisher et al (1989) and Strebulaev (2007) for theoretical models of costly adjustment, and Leary and Roberts (2005) for supporting empirical evidence for U.S. public companies.
16 Another potential reason for the lack of a relation could be that public companies are averse against taking on debt, e.g. because of agency problems (see Berger et al, 1997). To address this potential explanation we have also matched LBO leverage to that of public debt issuers, by restricting the sample of public firms to those that have issued debt of more than 10% of assets in a given year. Again, we fail to find any positive relation between buyout and public leverage (see internet appendix Table IA.IV, which makes similar comparisons using other variables, such as market-to-book ratios, sales growth, R&D-to-sales, profitability etc.)
17 For a sample of U.S. 1980’s public-to-private transactions Opler and Titman (1993) argue that LBO targets have worse investment opportunities and lower financial distress costs than other public firms. Stuart and Kim (2010) confirm these findings using a more recent sample, and find in addition that companies that have directors with prior LBO experience are more likely to undergo an LBO transaction.
Panel D of Table IV sorts buyouts according to quartiles of pre-LBO leverage. For D/EBITDA there is again no relation between pre-LBO and LBO leverage, while there is a slightly positive and marginally statistically significant for D/EV. The LBO D/EV distribution is much narrower than the pre-LBO leverage, however, and does not increase monotonically across pre-LBO quartiles.
To summarize, there does not appear to be any relation between LBO leverage and the leverage of comparable public companies. This lack of a relation does not appear to be due to measurement or matching issues; rather, buyout leverage appears to be determined by different factors than that of public companies.
C. LBO leverage and debt market conditions.
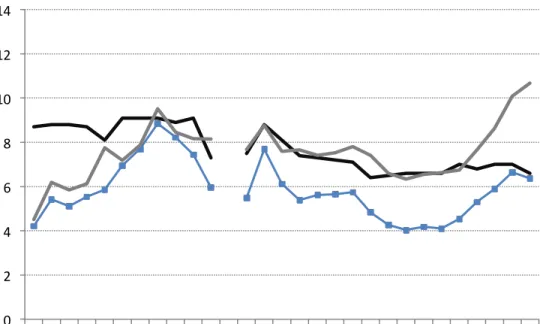
The market timing and agency stories suggest that buyout leverage should primarily be determined by time-series variation in debt market conditions. Figure 2 plots the time-series of valuation multiples and leverage for both LBOs and the matched public companies. Panel A clearly indicates that buyout leverage, especially D/EBITDA, exhibits a strong cyclicality. The periods in which leverage drops the most coincide with the fall of the junk-bond market in 1989-1990 and the internet crash in 2000-2001, while leverage peaks at the top of the business cycles in 1988, 1998, and 2007.18 This pattern suggests that macro-economic conditions affect LBO leverage in a highly pro-cyclical manner. In addition, there appears to be a strong relationship between leverage (especially D/EBITDA) and transaction prices (i.e. EV/EBITDA).
It is worth noting, however, that there is a decreasing trend in debt to enterprise value over our sample period, with an average D/EV of over 80% in each sub-period before 1994 and below 70% following 1995. One partial explanation for this trend is that many of the 1980s deals involved immediately selling off parts of the acquired company, the proceeds of which could be used to repay some of the debt (see Kaplan (1989b)).
Panel B of Figure 2 illustrates graphically the evolution of leverage and pricing over our sample period for the matched public company medians. In contrast to the pro-cyclical pattern for buyouts, public company leverage is counter-cyclical, peaking in the early 1990’s recession and again after the internet crash in 2000-2001. The counter-cyclical leverage of public companies is consistent with earlier research, such as Korajczyk and Levy (2003). In addition, the strong
18We have very few observations, between 0 and 3 per year, for the 1990-1993 period. Therefore, the large movements in leverage and pricing over this period are not statistically reliable.
positive relation between D/EBITDA and EV/EBITDA that is present in the buyout sample is not observed for public companies.
To explore the impact of debt market conditions further, we examine the relationship between leverage and the high-yield spread. Panel E of Table IV sorts leverage into quartiles based on the size of this spread, since a lower spread is likely to be indicative of better financial conditions and a more liquid market for high-yield debt. Consistent with procyclicality, buyout leverage decreases significantly as the high-yield spread increases. The relation is particularly pronounced for D/EBITDA, which decreases from six to four times EBITDA between the lowest and highest spread quartiles. Yet, the relation goes the opposite way for the public companies, for which each measure of leverage increases with the high-yield spread.
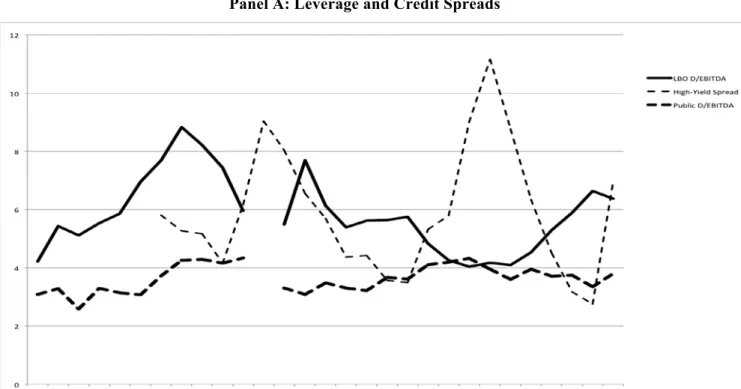
The relation between debt market conditions and leverage is shown graphically in Figure 3. Panel A plots annual time series of median D/EBITDA for our LBO deals, corresponding median D/EBITDA for the matched public companies, and the high-yield spread. When debt market conditions improve, as indicated by a decrease in the high-yield spread, buyout leverage increases. In contrast, public company leverage does not exhibit this pattern, and actually appears to decrease when high-yield spreads decrease.
In addition to the quantity of debt, we also examine the composition of debt as a function of debt market conditions. Panel B presents two measures of debt structure: the fraction of debt maturing in 5 years, and the fraction total debt that is made up of Term Loan A tranches (amortizing debt held by banks). We restrict the sample to deals from after 1994, since data on debt structure is scarce before 1994. This figure indicates that both the fraction of debt maturing in 5 years and the proportion of amortizing Term Loan A debt is countercyclical. During very liquid credit markets, when buyout leverage is generally higher, banks hold a lower fraction of the buyout debt as opposed to hedge funds, collateralised loan obligations (CLOs) and other non-bank financial institutions.19 A very similar pattern is found for the maturity of debt, measured as the proportion of total debt maturing in five years, with maturities being shortened when debt market conditions improve.
19Consistent with this finding, Shivdasani and Wang (2011) find that during hot credit conditions, CDOs provide a higher fraction of LBO credit, suggesting that the supply of non-bank debt fuel LBO activity.
D. Cross-sectional vs. time-series determinants of leverage
The univariate analyses suggest that debt market conditions affect buyouts capital structures very differently from the way they affect public companies’ capital structures. Moreover, the capital structures of buyouts and comparable public firms have little relation to each other, suggesting that different forces explain financing decisions in buyouts than in publicly-traded firms. In particular, buyout capital structures appear to be primarily driven by time-series variation in credit availability, as suggested by the agency or market timing explanations of buyout leverage, rather than by buyout firms optimizing leverage as a function of firm- or industry-specific characteristics.
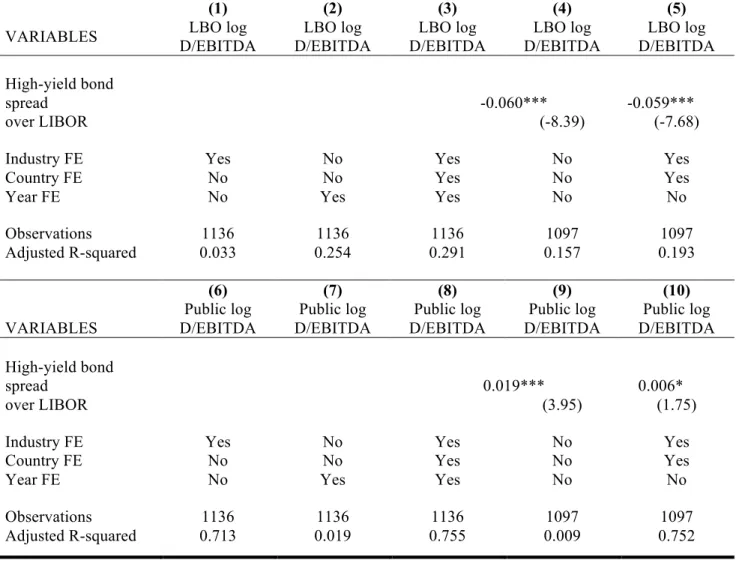
We next examine this idea using an econometric approach that allows for direct measurement of the effect of cross-sectional and time series factors on leverage ratios. In particular, we estimate equations, predicting buyout and public company leverage, measured as the log of D/EBITDA, on industry, region, and year fixed effects. We present estimates of these models in Table V.
Specifications (1) through (5) of Table V present estimates of the factors affecting buyout leverage. We first estimate buyout leverage as a function of only the Fama-French 49-industry dummies, yielding a very low adjusted R-squared of 0.03 (model 1). In contrast, a comparable equation estimating buyout leverage as a function of year fixed effects leads to an adjusted R-squared of 0.25 (model 2). Adding the full set of dummy variables (industry, country, and year) only increases R-squared marginally, to 0.29 (model 3). In other words, time-series effects have almost an order of magnitude larger explanatory power than cross-sectional industry effects. Models (4) and (5) include our main measure of debt market conditions, the high-yield spread, which is significantly negatively related to buyout leverage, and in itself accounts for a large part of the time-series variation.
Specifications (6) through (10) present the same analysis estimating matched public industry-region-year median D/EBITDA. In the estimates of these equations, in contrast to those for the buyouts, industry dummies explain the bulk of the variation (R-squared of 0.71), while year dummies explain very little (R-squared of 0.02). Including the high-yield spread now yields a positive and significant coefficient, but a very low R-squared (less than 0.01). Hence, public leverage seems to largely be driven by cross-sectional variation rather than time-series effects.20
20We also considered whether the lack of time series variation in the estimates for public firms is due to inertia by re-estimating the equations using only public firms that actively adjust their capital structure. These results are
In addition, public firms’ leverage ratios are positively related to the high-yield spread for public firms, in contrast to the negative relation between buyout leverage ratios and the high-yield spread.
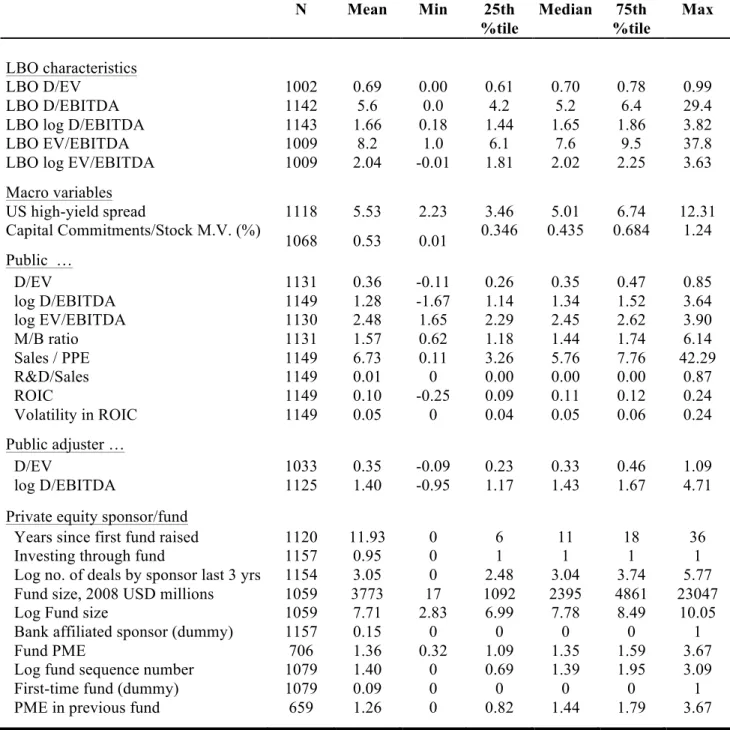
These results confirm the hypothesis that buyout leverage is primarily driven by time-series variation in debt market conditions, while public leverage is explained by cross-sectional characteristics to a larger extent. To explore this issue more rigorously, we estimate multivariate equations explaining capital structure choices for both LBOs and public companies. Descriptive statistics for the variables used in these equations are provided in Table VI.
Table VII presents estimates of these equations. The first two specifications of Table VII confirm the univariate findings that public and buyout leverage are largely unrelated. In regressions of LBO log D/EBITDA, public matched leverage is insignificant, while for LBO D/EV the public leverage is only marginally significant and with a very low coefficient (0.07). In contrast, the high-yield spread is consistently negative and statistically significant.21
In Specifications (3) and (4) we estimate both buyout and matched public leverage as a function of a number of characteristics that have been shown to explain capital structure in previous empirical work. Specifically, we estimate leverage as a function of the market-to-book ratio (typically thought of proxying for growth opportunities); sales divided by property, plant, and equipment (measuring asset turnover); R&D expense divided by sales (proxying for intangible assets); return on invested capital or ROIC, calculated as EBIT divided by the sum of book equity and long-term debt (as a measure of profitability); and earnings volatility, measured as the standard deviation of ROIC using five years of annual data (measuring operating risk). All these variables are measured as the median value among public firms in the corresponding Fama-French 49 industry, region and year (i.e. in the same way as the construction of the matched public leverage ratios). When estimating matched public leverage as a function of these characteristics (model 3), all industry characteristics are significant, and results are consistent with the findings in previous literature: public leverage decreases in operating risk, growth opportunities, and asset intangibility, consistent with the trade-off theory. Also consistent with presented in the Internet Appendix Table IA.V. We have also performed this analysis on the full set of public company region-year-industry median D/EBITDA, instead of restricting the sample to industry-region-years where a buyout occurs in our sample. In other words, we estimated median D/EBITDA in a panel of industry-region-year observations containing all Fama-French 49 industries in U.S. and Western Europe over the full sample period 1980-2008, or a total of 3822 observations. The results are very similar: estimating public leverage as a function of year dummies only leads to an squared of 0.04, while estimating it as a function of industry dummies only has an R-squared of 0.61.
previous literature public leverage is decreasing in profitability, which is inconsistent with the trade-off theory, but usually interpreted in favor of the pecking-order theory. The high-yield spread is not significant in the public leverage regression. In contrast, when using LBO leverage as the dependent variable (model 4), these industry characteristics have no explanatory power for buyout leverage, and the only significant determinant of leverage is the high-yield spread. It appears that the pattern is robust: public leverage is related to the factors from the trade-off and pecking order theories discussed in other work, while buyout leverage appears to be primarily a function of market conditions.
One concern may be that the firms targeted for leveraged buyouts are different from the rest of the industry, and that they have very different characteristics than the median industry firm. To address this concern we have undertaken the same analysis on the subsample of public-to-private deals, where we estimate buyout leverage as a function of the firms' own pre-LBO characteristics (market-to-book, profitability, etc.) rather than industry medians. The results of this analysis can be found in Table IA.VI of the internet appendix. Again, these estimates fail to provide any consistent evidence that firm characteristics affect buyout leverage in the way they do for public firms, and the high-yield spread is the only consistent predictor of buyout leverage. Additionally, the results suggest that the public-to-private target firms are representative of their industry before they are purchased, in that industry median leverage is a significant predictor of pre-LBO leverage.
The final specification in Table VII estimates buyout leverage as a function of a number of buyout and PE fund characteristics in addition to the high-yield spread. The characteristics include dummies for deal region, deal type (independent private, privatization/distress, public-to-private, and secondary, with divisional as the omitted category) and deal size measured by quartiles of transaction value (EV). Also, previous research, such as Demiroglu and James (2010) and Ivashina and Kovner (2011) present evidence suggesting that more reputable private equity funds have easier and cheaper access to debt. To account for this possibility, we include two measures of private equity fund reputation: the age of the PE firm and the number of private equity transactions undertaken during the last three years. We are able to find this information about the private equity firms, and their different funds, for about three-quarters of our overall sample of transactions. Since some of our PE investors do not use fund structures (e.g. such as evergreen funds and publicly traded PE firms) we also include a dummy for whether the PE invests through a fund. Finally, we include fund size and a variable indicating whether the private
equity firm is affiliated to a commercial or investment bank (which arguably could increase access to leverage) as additional controls.
The estimates in this equation indicate that none of the PE variables are statistically significant, with the exception of the dummy for whether the PE firm invests through a fund, which is weakly negatively related to leverage. Hence, we are unable to replicate the results of Demiroglu and James (2010) and Ivashina and Kovner (2011) in our sample.22 Deal size, however, is an important determinant of LBO leverage. Larger deals (measured by enterprise value quartiles) are significantly more highly levered than smaller deals. Moreover, public-to-privates (which tend to be larger than other transactions) and secondary buyouts tend to be more highly levered than other LBO types. Most importantly, debt market conditions, as measured by the high-yield spread, are consistently negatively related to leverage, and the coefficient is essentially unaltered across specifications.
Finally, we note that one potential explanation for the strong relation between low spreads and high leverage for LBOs could be that when rates are lower, firms can pay interest on a higher principal with the same cash flows. But this explanation would apply to public firms as well, and public firm leverage is robustly positively related to the high-yield spread.
E. Pricing of Deals
The results so far suggest that debt market conditions have a major effect on buyout leverage. An implication of the arbitrage and the agency explanations for buyout leverage is that buyers will pay more for deals when debt markets conditions are favourable, which we examine in this subsection.
Our measure of deal pricing is enterprise value divided by EBITDA, which we refer to as the “EV multiple”. In addition to being a natural valuation measure, it is also the most commonly-used metric for price in the private equity sector. As is shown in Panel A of Figure 2, deal pricing varies positively with leverage. Annual median EV multiples closely track median D/EBITDA ratios, and when leverage levels peak (as in the late 1980's, in the late 1990's, or in 2006-2007), pricing multiples peak as well. Panel B of Figure 2 shows that this positive relation
22 We have tried a number of different ways of measuring reputation, none of which seem to have much explanatory power. For example, instead of using the absolute measures above we have calculate the relative ranking of the sponsor according to these measures at the time of the deal, normalized between zero and one, in order to get a time-invariant measure (since LBO volume has increased over time). Since the relation between these rankings and our dependent variables is unlikely to be linear, we have also tried using dummy variables for whether the sponsor was relatively highly ranked according to these measures.
between leverage and valuation multiples is not present among public companies, where the correlation between EV multiples and D/EBITDA is, if anything, negative.
Table VIII estimates the relation between pricing in buyouts and in public companies in a multivariate setting. It presents estimates of equations predicting EV multiples as a function of company and market characteristics. The first two models consider the extent to which pricing in buyouts and in public firms are related to the high-yield spread. The results in these columns indicate that the spread has a negative and statistically significant impact on prices both of buyouts and public firms. Comparing the coefficients, however, the negative magnitude is significantly larger for the LBO multiple than the public company multiple, indicating that LBO pricing is more sensitive to debt market conditions than public company pricing.
The fact that public company valuations are related to the credit spread suggests that the spread not only proxies for debt market conditions, but also picks up changes in the economy-wide discount rate or risk premium. Hence, before we can conclude that debt market conditions drive LBO pricing, it is important to control for changes in discount rates. In the model (3) we do so by including the matched public company EV multiple in the equation predicting pricing in buyouts. Changes in the discount rate should be reflected in public company valuations. As expected (and in contrast to the leverage regressions) the coefficient on the median public company multiple is positive and statistically significant. Nonetheless, the credit-spread variable is negative and statistically significant as before, and the magnitude of the coefficient is approximately the same as in the previous columns. This result implies that the effect of credit market conditions on LBO pricing is fairly orthogonal to general changes in economy-wide discount rates. Model (4) adds a number of deal-level controls and finds a similar effect; credit market conditions have a strong relation with buyout pricing. Buyout pricing and buyout leverage both appear to be determined in large part by debt market conditions. These results are consistent with easier availability of leverage driving up LBO transaction prices.
The final two columns of Table VIII address this issue more directly by estimating the relation between LBO EV multiples and LBO leverage. Although Figure 2 documents that leverage and pricing in buyouts are positively correlated in our sample, this correlation does not necessarily imply that leverage has a causal impact on pricing, since both are likely to be functions of common, unobserved factors. In addition, measurement error by itself could lead to a positive correlation between our proxies for pricing (enterprise value) and leverage (total debt), since both are normalized by EBITDA.