Predictive Maintenance Using IOT
Vidhyashree.N1, S. Srividhya2
1,2Information Science Department, BNM Institute of Technology, Karnataka, India
Abstract: The Internet of Things(IoT) is a phenomenon where tiny machines have the ability to sense, respond, compute, and connect to the Internet, providing unprecedented access to control things and the environment around us. The 2nd generation Intel Galileo board provides a programmable control PCB for the maker community, students, and professional developers. Using IoT, an attempt is made to establish an effective predictive maintenance system for data centres. This system constantly reads, extracts and perform analysis on the data received from the Air-Conditioner’s by a Remote Transmission Unit(RTU) kept in the data centre. The RTU in this case is the Intel’s Galileo Gen2 board hat is physically attached to it. The whole setup is drawn in the lines of IoT technology.
Keywords: IoT, Galileo board, remote transmission unit, data centre, air conditioning unit
I. INTRODUCTION
The paper aims at establishing an efficient Data centre Health Management system. At Data centres, the AC (Air Conditioner) units must be monitored constantly to ensure that the data centre’s temperature is maintained at the apt temperature. The servers in the data centre runs constantly throughout the day and throughout the years. Therefore, there is a lot of heat generate by them. Data centre environmental control is a constructive generic framework for maintaining temperature, humidity, and other physical qualities of air within a specific range in order to allow the equipment housed in a data centre to perform optimally throughout its lifespan. The goal of AC's is to move heat from the indoor environment (the data centre) to the outside, thereby maintaining a temperature conducive to proper functioning and, preferably, long life of servers and other equipment.
To maintain the right temperature at data centres, maintenance of the huge AC’s is crucial. The AC units have to be up and running all the time. It is a tedious job if the AC units start malfunctioning. The data centre administrator cannot constantly monitor the AC units manually to ensure the health of the AC units and it is not advisable for an individual to wander in the data centre frequently since it can disturb its temperature. Therefore, there must be a way to monitor the data centre health and the AC units remotely. All of this is done using IoT[1].
.
II. LITERATURE SURVEY
The physical environment of a data centre should be rigorously controlled. This was achieved by some common methods like using motors fans, chillers and then came the highly efficient Air-Conditioners. These cooling methods must be up and running constantly to ensure the optimal temperature is maintained in the data centre. Any glitch in the cooling devices affects the working of servers due to over-heating. Any check in the cooling devices had to be done manually by the data centre administrator periodically. Frequent wandering in the data centre by any individual is not advisable for maintaining the health of data centres.
A. Existing system
1) Some of the concrete methods used were as follows: Distributed System Providing Scalable Methodology for Real-Time Control of Server Pools and Data Centres: It is a method for regulating resource usage by a plurality of programs running on a plurality of machines. The procedure involves providing a resource policy specifying allocation of resources amongst the plurality of programs, determining resources available at the plurality of machines. It also detected requests for resources by each of the plurality of programs running on each of the plurality of machines[2]. An extra fail safe to maintain the required temperature. It was a simple program running along with the operating system. The parallel program consumed extra space and investment into skilled programmers was an additional investment. The program had to be changed with every brand/company of chillers and coolers to establish compatibility.
Monalytics uses a typical threshold-based method for anomaly detection with the proposed EBaTmethod. It combines data collection and aggregation with arbitrary analysis tasks. Permits dynamic deployment and reconfiguration of monalytics graphs and operators and also extends analysis with local management functions .Monalytics works as a parallel software with the operating system and hence has the overloads the processor when there is huge burst of data. It is best suited for small to medium scaled data centres only.
3) Use of Liquid Coolant: Liquid cooling was an additional precaution to maintain the optimum temperature in data centres. Liquid cooling is a far more efficient method of transferring concentrated heat loads than air, due to much higher volumetric specific heats and higher heat transfer coefficients.
This acts an extra measure of cooling the servers along with the coolers and chillers. It is most useful during the peak performance periods of servers, providing instant cooling effect. It becomes more expensive to add the liquid coolants in the server rooms. The coolant has to be of the best and suitable quality and quantity. If the liquid coolant leaks it affects the chips and microprocessors inside server plates and destroys the server racks.
B. Proposed system
The proposed system introduces a system to regulate, monitor and analyze the cooling devices so as to predict and prevent the discrepancies/ malfunctions of the devices using IoT methodology. Using Intel’s Galileo Gen2 board[4] is the perfect combination with IoT as it provides universal compatibility with any electronic device.
III. IMPLEMENTATION
In process of implementing a predictive maintenance system there are four main steps. The implementation of the whole system includes everything from initializing the connection to the last step where the data centre administrator monitors the AC unit. The modules are explained in the below sections.
A. Data streaming
The data streaming module is the first step of execution. This module establishes a strong connection between the Galileo board and the AC unit. In this module the IP address of the user’s desktop/notepad is set in program running in the board which confirms the Galileo board about the authenticity of the admin. After a connection is established, MQTT(Message Queue Telemetry Transport) the begins streaming data from AC unit to board to user’s desktop.
B. Data storage
The data from the stream is stored in a database using mongoDB database. The data is stored in two separate collections- live-data and raw-data. The data from live-data collection is first processed into JSON(Java Script Object Notation) format from hexadecimal format and then sent for processing. Then the same data is used for training the algorithm which is used for analysis of data, continuous data display on the webpage. The data from raw-data collection is used only for periodic display of data. For example, data from the past week, month, year, etc. This data is denoted graphically or by count.
C. Data processing and analysis
The data obtained from the AC unit is hexadecimal format. It has to be converted to JSON format. Converting the data format to JSON helps in sending data to webpage. Analyzing the data as to what the data indicates about the state of the device, its performance and its efficiency, health status is done by using decision tree algorithm[5]. Then it can be determined whether a device is functioning efficiently or not.
D. User interface
The webpage shows the health status, efficiency and performance of the AC unit. The datacentre admin monitors the webpage. An alert is sent to the admin if there are any variations in the value. If the value of a parameter goes out of the acceptable range of value for that parameter, then an alert message is displayed on the monitor screen and an auto generated mail is sent to the registered e-mail id for the record and for future reference.All paragraphs must be justified, i.e. both left-justified and right-justified.
administrator. The AC unit it connected to the Intel’s Galileo Gen2 board. There is a SD card slot in hat board where the Linux Yocto operating system. This version of operating system is recommended for all Galileo boards. Linux is light-weight and much faster than Windows operating system. The security is very easier to maintain than in Windows operating system where, for example, virus intrusion is frequent and easy to corrupt the system. Therefore security is a very critical requirement and best security measures are taken by the Linux operating system.
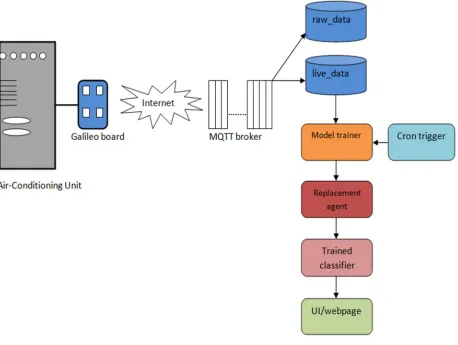
[image:4.612.85.543.215.560.2]The system architecture represents the entire structure of the system as shown in Fig. 1. The Intel’s Galileo board acts as a Remote Transmission Unit to read data from the AC unit. The SD card on the Galileo board has NodeJS and mongoDB installed in them. Thus, the admin can read the data by executing read data commands and access data at a remote location by running the program stored on the Galileo board.
Fig. 1 System architecture
The Intel’s web win master is an editing tool which is custom made for Galileo boards. By using web win master tool the program can be deployed ion two ways – one by using run-using-iot, wherein the IP address of the Galileo board has to be entered and the username and password have to be entered correctly to establish connection and run the program remotely, the second option is to log into the board using SSH(Secure Shell) with correct IP address and authentication.
When data from AC unit is pulled its is stored in mongoDB. Since the data stream has to run continuously and there is flow of data constantly, MQTT queue is used to transfer the data from Galileo board to the admin's webpage. MQTT is the best messaging queue used for huge data transfer. There is no drop of packets or loss of packets. Since there is a queue for huge data flow, congestion and latency are avoided.
power failure or otherwise.
The MQTT messaging protocol has a mechanism called publish and subscribe. The devices that have already subscribed to that MQTT IP address will alone get messages when MQTT publishes. Therefore, only the subscribed devices receive the data from AC unit as shown in Fig.
From MQTT data is sent to two collections in the data base, raw_data and live_data. The data for processing and analysis is taken as the data from live_data collection is formatted and processed into the required form, whereas the data is raw_data collection is kept as received. The data received live_data is fed into model trainer where the decision tree algorithm is present. The algorithm accepts data, trains the algorithm and keeps a result for the decision making process. The replacement agent replaces the old algorithm results with the new batch of results. The cron triggers the model trainer to train on new sets of data periodically as per the new data. Then the newly trained classifier has the correct data to display in the UI and send it to the webpage of the data centre admin.
IV.RESULT
[image:5.612.54.569.258.433.2]The monitoring system for data centre health management has every simple process. It is intended to be easy for the user. Since user/administrator of the data centre may not have strong technical background to understand the internal processes.
Fig. 2 Monitoring page of a data centre administrator
[image:5.612.46.568.512.712.2]If there is any anomaly or discrepancy in the working of the AC unit the an alert prompt as shown in Fig. 3. As shown in figure the temperature falling alert is show in the prompt window. The acceptable range of value for temperature is 15° to 30° Celsius. As shown in the figure the value show is 10° which is below the acceptable range. Therefore the temperature falling alert is shown to the admin. If the temperature falls below the predefined threshold value it affects the working of the system. the insides of the AC unit get lot cooler than required and affects other parts of the unit. There are also inter-dependencies in parameters. For example, if the temperature goes down then the water coolant flow is disrupted and heats up the devices. Thus the temperature parameter is very crucial and must be immediately attended to.
Fig. 4 Email notification
[image:6.612.63.548.475.644.2]When any fault is detected an auto-generated email notification is sent to the administrator's registered email id as shown in Fig. 4. The email is sent simultaneously when the fault occurs. The email contains the details of the fault like, the parameter name, AC unit name, timestamp of when the fault occurred, priority of the event and what action is to be performed to fix the fault.
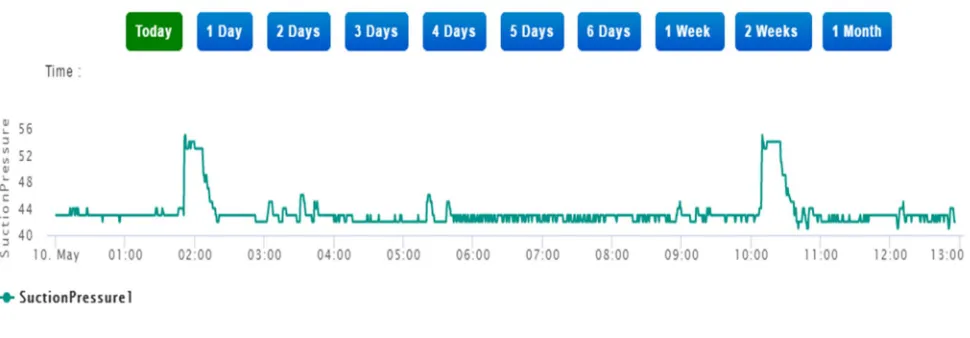
Fig. 5 One day performance graph
Fig. 6 One month performance of two parameters
The performance graph for two parameters, namely, condenser water in temperature and discharge pressure are shown for one month of data as shown in Fig. 6. This helps in predicting when the performance may go down again in future.
V. CONCLUSION
Many multinational companies now-a-days has its own data centre and therefore requires its own datacentre health management system. The system supports and monitors Air conditioning units used for cooling down the servers that are running in the data centre. The monitoring system successfully fetches data from Air-Conditioning unit and transfers the data to a remotely located device. This data obtained is parsed, processed and sent to a model for training and analysis. The actual data feed is displayed in a structured manner on the webpage for the administrator.
One main limitation of this system is that it is particular on the company of the AC unit. The parameter values for acceptable threshold range may differ from one company to another. Therefore compatibility issue may arise. In future, a generic system has to be developed that supports Air-conditioners different units. Also, the algorithm chosen for analysis can be changed and can include any other machine learning algorithms that may give even better performance and reliability.
REFERENCES
[1] IoT based Smart Home design using power and security management, Punit Gupta, JasmeetChhabra, International Conference on Innovation and Challenges in Cyber Security (ICICCS-INBUSH), 2016
[2] IBM TRIRIGA: The power of true integration in workplace management solutions, “Crossing the sustainability chasm: strategies and tactics to achieve sustainability goals”, 2011
[3] Monalytics: Online Monitoring and Analytics for Managing Large Scale Data Centres, MahendraKutare, College of Computing, Georgia Institute of Technology
[4] Intel Galileo and Intel Galileo Gen 2, Manoel Carlos Ramon, Springer, 2014