en
t
re
v
ie
w
s
re
ports
de
p
o
si
te
d r
e
sea
rch
refer
e
e
d
re
sear
ch
interacti
o
ns
inf
ormation
Pavel Tomancak
¤
*†‡
, Benjamin P Berman
¤
*§
, Amy Beaton
*¶
,
Richard Weiszmann
¶
, Elaine Kwan
*†
, Volker Hartenstein
¥
,
Susan E Celniker
¶
and Gerald M Rubin
*†#
Addresses: *Department of Molecular and Cell Biology, University of California, Berkeley, CA 94720, USA. †Howard Hughes Medical Institute, Cyclotron Road, Berkeley, CA 94720, USA. ‡Max Planck Institute of Molecular Cell Biology and Genetics, Pfotenhauerstr., Dresden, D-01307, Germany. §Department of Preventive Medicine, Keck School of Medicine of USC, Eastlake Ave, Los Angeles, CA 90033, USA. ¶Lawrence Berkeley National Laboratory, Cyclotron Road, Berkeley, CA 94720. ¥Department of Molecular Cell and Developmental Biology, University of California Los Angeles, Los Angeles, CA 90095, USA. #Janelia Farm Research Campus, HHMI, Helix Drive, Ashburn, VA 20147, USA.
¤ These authors contributed equally to this work.
Correspondence: Susan E Celniker. Email: [email protected]
© 2007 Tomancak et al.; licensee BioMed Central Ltd.
This is an open access article distributed under the terms of the Creative Commons Attribution License (http://creativecommons.org/licenses/by/2.0), which permits unrestricted use, distribution, and reproduction in any medium, provided the original work is properly cited.
Gene expression during Drosophila embryogenesis
<p>Embryonic expression patterns for 6,003 (44%) of the 13,659 protein-coding genes identified in the <it>Drosophila melanogaster </ it>genome were documented, of which 40% show tissue-restricted expression.</p>
Abstract
Background: Cell and tissue specific gene expression is a defining feature of embryonic development in multi-cellular organisms. However, the range of gene expression patterns, the extent of the correlation of expression with function, and the classes of genes whose spatial expression are tightly regulated have been unclear due to the lack of an unbiased, genome-wide survey of gene expression patterns.
Results: We determined and documented embryonic expression patterns for 6,003 (44%) of the
13,659 protein-coding genes identified in the Drosophila melanogaster genome with over 70,000
images and controlled vocabulary annotations. Individual expression patterns are extraordinarily
diverse, but by supplementing qualitative in situ hybridization data with quantitative microarray
time-course data using a hybrid clustering strategy, we identify groups of genes with similar expression. Of 4,496 genes with detectable expression in the embryo, 2,549 (57%) fall into 10 clusters representing broad expression patterns. The remaining 1,947 (43%) genes fall into 29 clusters representing restricted expression, 20% patterned as early as blastoderm, with the majority restricted to differentiated cell types, such as epithelia, nervous system, or muscle. We investigate the relationship between expression clusters and known molecular and cellular-physiological functions.
Conclusion: Nearly 60% of the genes with detectable expression exhibit broad patterns reflecting quantitative rather than qualitative differences between tissues. The other 40% show tissue-restricted expression; the expression patterns of over 1,500 of these genes are documented here for the first time. Within each of these categories, we identified clusters of genes associated with particular cellular and developmental functions.
Published: 23 July 2007
Genome Biology 2007, 8:R145 (doi:10.1186/gb-2007-8-7-r145)
Received: 8 March 2007 Revised: 5 June 2007 Accepted: 23 July 2007 The electronic version of this article is the complete one and can be
Background
A defining feature of multi-cellular organisms is their ability to differentially utilize the information contained in their genomes to generate morphologically and functionally spe-cialized cell types during development. Regulation of gene expression in time and space is a major driving force of this process.
A gene's expression pattern can be defined as a series of dif-ferential accumulations of its products in subsets of cells as development progresses. Patterns of mRNA expression are studied by two principal methods - microarray analysis [1] and in situ hybridization [2,3]. Microarray analysis provides both a quantitative measure of gene expression and an over-view of the temporal dynamics of gene expression regulation [4]. A major limitation of microarray analysis is that obtain-ing spatial information depends on the dissection or cell-sort-ing of specific tissues or cell types [5,6]. RNA in situ
hybridization has the potential to reveal both spatial and tem-poral aspects of gene expression during development. How-ever, RNA in situ hybridization is not quantitative [7]. For these reasons, we have used both methods in parallel and integrated the analysis of the resultant datasets.
There are several reasons for choosing Drosophila mela-nogaster as an organism for the global study of gene expres-sion during embryonic development. Genetic and molecular analyses have led to a deep understanding of many embryonic processes in this animal [8]. Classical embryology has pro-vided a solid framework for the anatomical description of embryonic stages [9] and robust high-throughput methods for assaying gene expression by whole mount in situ hybridi-zation have been developed [10-12]. In many cases, the wild-type gene expression pattern has informed the interpretation of the phenotype produced by its mutation [13]. Such studies have provided unprecedented insights into animal develop-ment; the process that governs the early embryonic pattern-ing of the Drosophila body plan is now the best understood example of a complex cascade of transcriptional regulation during development [14,15].
We have assembled an atlas of gene expression patterns dur-ing Drosophila embryogenesis. Taking advantage of non-redundant gene collections [16,17], we performed an unbi-ased survey of gene expression by using RNA in situ hybridi-zation of gene specific probes to fixed Drosophila embryos [12] and documented the patterns with a set of digital photo-graphs. We describe the tissue specificity of gene expression at each stage range using selected terms from a controlled vocabulary (CV) for embryo anatomy [18]. The CV integrates the spatial and temporal dimensions of the gene expression patterns by linking together intermediate tissues that develop from one another. It also integrates morphological and molecular description of development by allowing for struc-tures that are morphologically indistinguishable and can be defined only on the basis of gene expression. We show that
the genes sampled, representing 44% of the Drosophila
genes, are largely representative of the genome as a whole, allowing the global analysis of gene expression during the embryonic development of a multicellular organism. We organized the complex gene expression space by a hybrid fuzzy-clustering approach that uses microarray profiles to supplement the CV annotation of in situ patterns. We divided the resulting clusters into two categories, broad and restricted. Broad patterns are characterized by quantitative enrichment in tissues that are related by specific cellular states. Restricted patterns are highly diverse and provide a basis for defining gene sets expressed in related tissues and with related predicted functions.
Results and discussion
Annotation datasetThe starting point for our analyses is a collection of 6,003 genes whose embryonic expression patterns we have assayed by in situ hybridization and systematically annotated with CVs (Release 2.0). The number of genes in the dataset has more than doubled from Release 1 [12], from 2,179 to 6,003, and the accuracy of the annotation has been significantly enhanced by performing a full re-evaluation of every gene by a second, independent curator (Materials and methods; Addi-tional data file 1). Release 2.0, including 74,833 staged embryo images and accompanying CV annotations and microarray data, is publicly available via a searchable data-base [19], providing a convenient way to mine the dataset for particular expression patterns. To determine how represent-ative our sample is, we compared the distribution of selected Gene Ontology (GO) functional annotations (generic GO slim [20]) between the 6,003 genes in our subset and the 14,586 genes in the Release 4.3 genome (Additional data file 2). No major biases for a specific molecular function, component or process were detected. Our dataset is slightly enriched for genes with known or inferred GO functions, and is, therefore, slightly deficient for genes with unknown assignment. Genes in this category lack conserved sequence features that would relate them to genes in other organisms, and may be expressed at very low levels, leading to a relative under-repre-sentation in expressed sequence tag (EST) collections. We conclude that our dataset contains a largely representative
sample of gene expression patterns in the Drosophila
genome.
comm
en
t
re
v
ie
w
s
re
ports
refer
e
e
d
re
sear
ch
de
p
o
si
te
d r
e
sea
rch
interacti
o
ns
inf
ormation
which we call an 'anatomical signature', or 'anatogram'. Fig-ure 1 shows an anatogram for the set of 3,334 genes showing maternal expression. The relative enrichment or under-rep-resentation of CV annotations in this set of genes is indicated by the direction and height of the bar corresponding to each term, while the width of the bar indicates the genome-wide frequency of the term. Thus, commonly used annotation terms such as 'brain' (Figure 1, red asterisk) have wider bars than rare terms such as 'amnioserosa' (Figure 1, green aster-isk). We used the anatomical signature to summarize groups of genes in this paper and in the accompanying supplemen-tary online material [21].
Organization of gene expression data using a hybrid clustering approach
Of the 6,003 genes annotated, 4,759 (79%) showed detectable expression in the embryo, while the remaining 1,244 (21%) were annotated with only the 'No staining' CV term. By group-ing genes with identical annotations, the 4,759 genes with detectable expression in the embryo were subdivided into 205 multi-gene groups and 2,335 'singleton' groups (that is, groups consisting of a single uniquely annotated gene). By relaxing the criteria and grouping genes that had at least 75% of their annotation terms in common, we identified 393 multi-gene groups and 1,804 singletons. If we consider each of the multi-gene groups and each of the singleton groups to represent a distinct expression pattern, this method suggests that there are up to 2,197 distinct patterns within our dataset (Additional data file 6).
To further refine the number of expression categories, we developed a clustering strategy that allowed us to incorporate the quantitative temporal expression data obtained from the microarray experiments together with the qualitative, but spatially rich, data on expression patterns from the CV anno-tations. We implemented this approach within the framework of fuzzy c-means clustering [22,23] and developed a
similar-ity metric that assigns different weights to the contribution of the microarray and annotation data (Materials and methods). Our goal was to find a proper balance between the contribu-tions of annotation similarity versus microarray similarity to the overall similarity score. We desired a score that would minimize the contribution of microarray similarity for cases like those genes in Figure 2a, which have almost identical array profiles but incompatible annotation profiles. On the other hand, we wanted a score that would use array similarity to improve the reliability of clustering of broadly expressed genes that had similar but not identical annotation profiles, such as those in Figure 2b,c. We therefore used an asymmet-ric mixture function that varied the contribution of microar-ray data based on the similarity of the annotation data (Additional data file 7). Similarity for microarray profiles was calculated using a simple correlation metric, while similarity for in situ annotation profiles was calculated using a custom metric that independently weighted the contribution of each developmental stage range (Materials and methods).
[image:3.612.55.554.91.182.2]The fuzzy c-means algorithm is fuzzy in that each gene is assigned to one or more clusters [24]. As multiple independ-ent regulatory elemindepend-ents can drive the expression of a single gene in different tissues or at different times in development, this is a desirable property for this particular clustering prob-lem. However, despite extensive experimentation with differ-ent clustering parameters, the large diversity of expression patterns led to clusters with ambiguous boundaries. Replica-tion experiments using random initializaReplica-tion variables [25] resulted in clusters that were qualitatively similar but with numerous genes redistributed between neighboring clusters [26]. Therefore, each gene was assigned a score for each clus-ter, and this score was used to rank the most prototypical members of the cluster first and the most ambiguous ones last, and genes with high scores in multiple independent clus-ters were assigned to each cluster. This scoring allowed us to define a cutoff and determine the set of 'core' genes belonging Normalized anatomical signature - the anatogram
Figure 1
Normalized anatomical signature - the anatogram. A linear representation of the CV is used to show the enrichment of annotations within the set of all 3,334 maternally expressed genes versus the entire dataset of 4,759 genes expressed in the embryo. A vertical black line delimits stages, and each colored bar represents an individual CV term (an expanded color key is shown in Additional_data_fille 3). The width of each bar is proportional to the number of times a term was used in our entire dataset, and the height represents the relative enrichment of the given term within the particular gene set (in this case, all maternally expressed genes). Enrichment is given in units of standard deviation above or below the expected sample count based on the background frequencies (z-score). Terms with bars below the zero line are under-represented in the sample. The green asterisk corresponds to the 'amnioserosa' term, while the red asterisk corresponds to the 'brain' term. On the web supplement [21], the user can place the mouse pointer over any bar in the anatomical signature (arrow on the midgut bar in stage range 13-16) and obtain the gene count for the term in the entire dataset, the gene count within the particular set of genes under study, and a statistical p value of statistical over- or under-representation within the set (shown in the black bordered lavender box).
-8 -4 0 4 8
Stage 9-10 Stage 1 1-12 Enrichment
Under representation
Stage 7-8 Stage 4-6
Stage 1-3 Stage 13-16 Genome=1321
sample=1037 pval=7.1e-06
*
*
Ubiquitous Germ line Procephalic Ectoderm / CNS Foregut Ectoderm / Epidermis
Tracheal System Mesoderm / Muscle
Endoderm / Midgut
PNS
Hindgut / Malpighian tubules Head Mesoderm / Circ. syst. / Fat body
Salivary Gland
Amnioserosa / Yolk Maternal
most unambiguously to one and only one cluster (Materials and methods).
Of 4,759 genes expressed in the embryo, we had microarray expression data for 4,496. The best fuzzy c-means run grouped these genes into 39 clusters, and each cluster was designated as either 'broad' or 'restricted'. Clusters containing a significant fraction of genes annotated as 'ubiquitous' were designated as broad, as were clusters containing primarily genes with unrestricted maternal only expression (Materials and methods). We also decided to include as broad those clus-ters of genes exhibiting maternal expression early and mid-gut-only expression late. Many genes annotated in this way (Figure 2c) encode the mitochondrial ribosomal proteins and other presumably ubiquitous mitochondrial proteins. Using these criteria, 10 of the 39 clusters (Figure 3, 1B-10B) were designated broad, and 2,549 (56.7%) genes were assigned to these clusters. The remaining 1,947 (43.3%) genes exhibited highly restricted patterns and were assigned to 29 clusters designated restricted (Table 1) [21].
Broadly expressed genes
The ten clusters encompassing broadly expressed genes have relatively similar array profiles, but the diversity of annota-tions makes the boundaries between these clusters somewhat arbitrary (Figure 3). While there is significant ambiguity in determining the borders of these clusters, each has a distin-guishing expression profile. All broad clusters (Figure 4a-h) have maternal expression followed by ubiquitous or broad expression. Genes within these clusters have stereotypical cellular functions, which reveal the physiological and cell bio-logical states of different domains in the embryo during development.
[image:4.612.58.558.89.277.2]Cluster 1B is one of the several broad clusters characterized by peak microarray expression around hours 4-5 (stage 10; Fig-ure 4a). In situ hybridization showed continued ubiquitous staining throughout embryogenesis, with the heaviest stain-ing resolvstain-ing to the differentiated midgut, muscle, hindgut, foregut, and anal pads. Genes within this cluster exhibit diverse cellular functions, but within its core members are more than half of all genes known to be involved in nucleolar-based ribosome biogenesis (40 × enrichment, p = 5.8e-11; Microarray data can supplement, but not supplant, in situ gene expression patterns
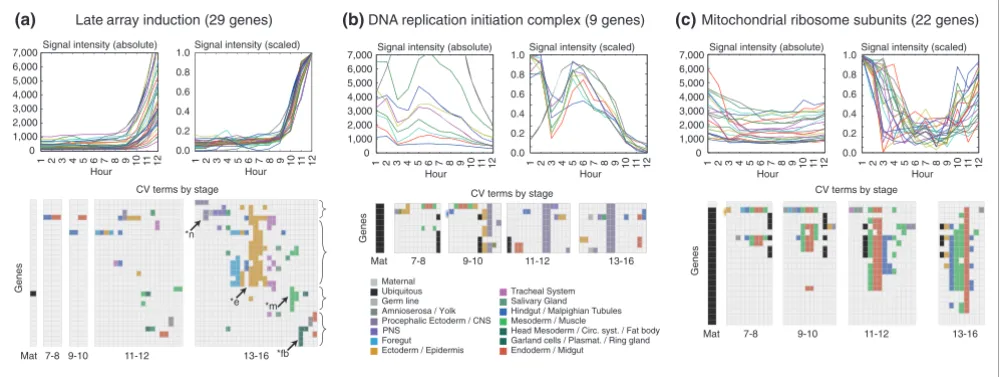
Figure 2
Microarray data can supplement, but not supplant, in situ gene expression patterns. Microarray data and the CV annotations are shown for genes (a) restricted to particular tissues late in embryogenesis, and (b,c) for broadly expressed genes encoding basic cellular protein complexes. Genes in (a) show strikingly similar array profiles but are expressed in quite diverse tissues. Late in embryogenesis half resolve to the epidermis (*e), and the other half are expressed in muscle (*m), fat body (*fb), and nervous system (*n). The genes of the DNA replication complexes, origin recognition complex and minichromosome maintenance complex display a characteristic pattern with peak expression at hour 5 (stage 10) and late expression in CNS (b). Similarly, the mitochondrial ribosomal genes decline during early embryogenesis but begin to rise around hour 10 (stage 13), with in situ hybridization most common in the midgut and muscle (c). For these broadly expressed gene classes the similarity of the microarray profiles is useful for supplementing the description of the in situ hybridization patterns using the CV annotations.
Ubiquitous
Ectoderm / Epidermis Germ line
Foregut
Procephalic Ectoderm / CNS PNS
Amnioserosa / Yolk Maternal
Tracheal System Mesoderm / Muscle Endoderm / Midgut Hindgut / Malpighian Tubules Head Mesoderm / Circ. syst. / Fat body Salivary Gland
Garland cells / Plasmat. / Ring gland
(a)
Mat 7-8 9-10 11-12 13-16 0
1,000 2,000 3,000 4,000 5,000 6,000
7,000Signal intensity (absolute)
0.4 0.6 0.8 1.0
Hour
1 2 3 4 5 6 7 8 9 01 11 21 0.0 0.2
Signal intensity (scaled)
Hour 1 2 3 4 5 6 7 8 9 01 11 21
s
e
n
e
G
Late array induction (29 genes)
CV terms by stage
*m
*fb *e *n
(b)
Mat 7-8 9-10 11-12 13-16 0
1,000 2,000 3,000 4,000 5,000 6,000
7,000Signal intensity (absolute)
0.4 0.6 0.8 1.0
Hour
1 2 3 4 5 6 7 8 9 01 11 21 0.0 0.2
Signal intensity (scaled)
Hour 1 2 3 4 5 6 7 8 9 01 11 21
CV terms by stage
s
e
n
e
G
DNA replication initiation complex (9 genes) (c)
13-16 Mat 7-8 9-10 11-12
0 1,000 2,000 3,000 4,000 5,000 6,000
7,000Signal intensity (absolute)
0.4 0.6 0.8 1.0
Hour
1 2 3 4 5 6 7 8 9 01 11 21 0.0 0.2
Signal intensity (scaled)
Hour 1 2 3 4 5 6 7 8 9 01 11 21
s
e
n
e
G
Mitochondrial ribosome subunits (22 genes)
CV terms by stage
Clustered gene expression data for broadly expressed genes Figure 3 (see following page)
comm en t re v ie w s re ports refer e e d re sear ch de p o si te d r e sea rch interacti o ns inf ormation
Figure 3 (see legend on previous page)
t u G di Mt n A. 2 1 − 1 1 t u G di Mt s o P. 2 1 − 1 1 o s e M k n ur T. 2 1 − 1 1 o s e M d a e H. 2 1 − 1 1 t u G o F. 2 1 − 1 1 t u Gi H. 2 1 − 1 1 Gl a S. 2 1 − 1 1 b u Tl a M. 2 1 − 1 1 qi b U. 2 1 − 1 1 ni ar Bt n e C. 2 1 − 1 1 dr o Ct n e V. 2 1 − 1 1 d a Pl a n A. 2 1 − 1 1 c s u M m o S k n ur T. 2 1 − 1 1 c s u M m o S d a e H. 2 1 − 1 1 c s u M c si V d a e H. 2 1 − 1 1 ll e C mr e G. 2 1 − 1 1 B F. 2 1 − 1 1 o n a h c e M _ S N P. 2 1 − 1 1 r P g a mItl u d A. 2 1 − 1 1 d n al G g ni R. 2 1 − 1 1 ni ar Bt n e C. 6 1 − 3 1 dr o Ct n e V. 6 1 − 3 1 qi b U. 6 1 − 3 1 d a Pl a n A. 6 1 − 3 1 t u Gi H. 6 1 − 3 1 c s u M m o S k n ur T. 6 1 − 3 1 c s u M m o S d a e H. 6 1 − 3 1 t u G di M. 6 1 − 3 1 b u Tl a M. 6 1 − 3 1 d a n o G. 6 1 − 3 1 c s a V oi dr a C. 6 1 − 3 1 B F. 6 1 − 3 1 c s u M c si V k n ur T. 6 1 − 3 1 c s u M c si V d a e H. 6 1 − 3 1 1B 2B 3B 4B 5B 6B 7B 8B 9B 10B 200 genes 1 r u o h 3 1 r u o h
CV annotation terms
Array signal
8 -7 s e g a t S 0 1 -9 s e g a t S 2 1 -1 1 s e g a t S 6 1 -3 1 s e g a t S 6 -1 s e g a t S A B t a M. 3 − 1 ll e C el o P. 3 − 1 d n Et n A. 8 − 7 d n Et s o P. 8 − 7 o s e M k n ur T. 8 − 7 o s e M d a e H. 8 − 7 t u Gi H. 8 − 7 qi b U. 8 − 7 t c E h p e c or P. 8 − 7 t c Et n e V. 8 − 7 dr o Ct n e V. 8 − 7 sll e C el o P. 8 − 7 kl o Y. 8 − 7 d n Et n A. 0 1 − 9 d n Et s o P. 0 1 − 9 o s e M k n ur T. 0 1 − 9 o s e M d a e H. 0 1 − 9 t u Gi H. 0 1 − 9 qi b U. 0 1 − 9 t c E h p e c or P. 0 1 − 9 dr o Ct n e V. 0 1 − 9 t c Et n e V. 0 1 − 9 t u G o F. 0 1 − 9 ni ar Bt n e C. 0 1 − 9 ll e C mr e G. 0 1 − 9 c s u M m o S d a e H. 0 1 − 9 c s u M c si V d a e H. 0 1 − 9 s e n e g UbiquitousEctoderm / Epidermis Germ line
Foregut
Procephalic Ectoderm / CNS PNS
Amnioserosa / Yolk Maternal
Tracheal System
Mesoderm / Muscle
Endoderm / Midgut Hindgut / Malpighian Tubules
Head Mesoderm / Circ. syst. / Fat body Salivary Gland
Additional data file 8).
Genes in cluster 2B and many in cluster 3B are characterized by peak expression levels around hour 12 (stage 15) and by in situ hybridization appear strongest in the differentiated mid-gut, muscle, hindmid-gut, and foregut (Figure 4b,c). Cluster 2B contains 33% of all genes annotated as being mitochondrial (7 × enrichment, p = 2.7e-48; Additional data file 8). Genes in 3B often appear restricted to the midgut, but this cluster was classified as 'broad' due to its apparent relationship to cluster 2B, both in its overall expression profile and its enrichment for mitochondrial genes (3 × enrichment, p = 1.6e-5). There is a significant correlation (p = 3.7e-9) between the genes in clusters 2B and 3B with genes shown in an RNA interference (RNAi) screen to be induced by the histone de-acetylase SIN3, suggesting a possible regulatory mechanism [27]. A substantial fraction of these SIN3-induced genes, about 25%, are classified as having diminishing maternal staining by our
in situ clustering (p = 2.6e-8 correlation with cluster 10B), suggesting that this common expression pattern is often beneath the level of detection by whole mount in situ hybrid-ization.
Clusters 4B and 5B are characterized by peak expression lev-els around hours 4-5 (stage 10) and often resolve to exhibit staining in the differentiated nervous system and midgut (Figure 4d,e). The two clusters are differentiated by expres-sion in the stage 13-16 gonad (Figure 4d). Both clusters are significantly enriched for genes with apparent functions in cell division, including genes required for DNA metabolism, 4B (4 × enrichment, p = 6.6e-5) and 5B (4 × enrichment, p = 5.6e-12), and the cell cycle, 4B (3 × enrichment, p = 4.9e-3)
and 5B (4 × enrichment, p = 5.8e-16). Consistent with this overrepresentation of cell-cycle regulated genes, there is sig-nificant overlap between the genes in these clusters and a set of 65 genes identified in an RNAi screen for dE2F transcrip-tional targets [28]. We have 41 of these genes in our dataset with 40% belonging to 5B (8 × enrichment, p = 2.2e-12) and 20% belonging to 4B (9 × enrichment, p = 1.4e-6).
Genes in cluster 6B are almost uniformly annotated as ubiq-uitous at all stages of embryogenesis and this annotation is supported by relatively high average array expression levels at all time points (Figure 4f). Cluster 6B contains over 80% of the genes encoding the components of the cytosolic ribosome (8 × enrichment, p = 1.1e-29) and other genes involved in pro-tein metabolism. Additionally, 40% of the 100 genes identi-fied as essential for viability based on a large RNAi screen [29] are included in this cluster (4 × enrichment; p = 2.6e-16).
The genes in clusters 1B-6B exhibit remarkably similar expression patterns during gastrulation and were most fre-quently annotated as endoderm and mesoderm anlagen (Fig-ure 4, green rectangle). This early pattern later resolves into endodermal and mesodermal derivatives for genes in clusters 1B-3B or into central nervous system (CNS) and midgut for genes in clusters 4B-5B (Figure 4, red rectangle).
[image:6.612.56.564.119.195.2]Clusters 7B-10B are composed of genes with maternally deposited transcripts that diminish after stage 7 (Figure 4g,h). Those in 7B (75 genes; Figure 3) appear to rise steadily until hour 9 (stage 12), while those in 8B (49 genes) come on strongly at 16 hours (stage 16), at a time when formation of cuticle prevents efficient RNA in situ hybridization. Genes in
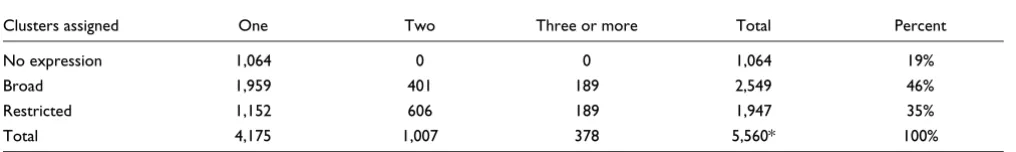
Table 1
Division of clustering results into broad and restricted expression patterns
Clusters assigned One Two Three or more Total Percent
No expression 1,064 0 0 1,064 19%
Broad 1,959 401 189 2,549 46%
Restricted 1,152 606 189 1,947 35%
Total 4,175 1,007 378 5,560* 100%
*Number of genes with valid microarray values for all time points. Genes assigned to both a broad cluster and any other cluster are counted only as broad.
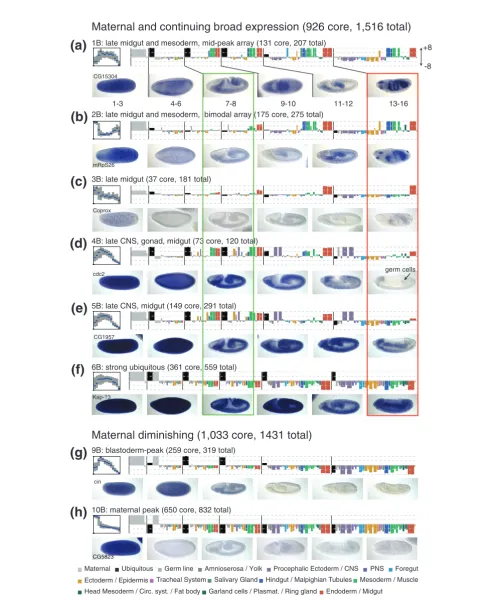
Overview of broad expression patterns Figure 4 (see following page)
comm
en
t
re
v
ie
w
s
re
ports
refer
e
e
d
re
sear
ch
de
p
o
si
te
d r
e
sea
rch
interacti
o
ns
inf
[image:7.612.56.553.89.697.2]ormation
Figure 4 (see legend on previous page)
cdc2 germ cells
Kap-?3
1-3 4-6 7-8 9-10 11-12 13-16
CG15304
cin mRpS26
2B: late midgut and mesoderm, bimodal array (175 core, 275 total)
Coprox
3B: late midgut (37 core, 181 total)
4B: late CNS, gonad, midgut (73 core, 120 total)
1B: late midgut and mesoderm, mid-peak array (131 core, 207 total) +8
-8
Maternal and continuing broad expression (926 core, 1,516 total)
CG1957
5B: late CNS, midgut (149 core, 291 total)
6B: strong ubiquitous (361 core, 559 total)
Maternal diminishing (1,033 core, 1431 total)
9B: blastoderm-peak (259 core, 319 total)
(a)
(b)
(c)
(d)
(e)
(f)
(g)
(h)
CG5823
Ectoderm / Epidermis Tracheal System Salivary Gland Hindgut / Malpighian Tubules Mesoderm / Muscle Ubiquitous Germ line Amnioserosa / Yolk Procephalic Ectoderm / CNS PNS Foregut Maternal
Endoderm / Midgut Head Mesoderm / Circ. syst. / Fat body Garland cells / Plasmat. / Ring gland
cluster 9B (650 genes) show a spike in expression during the blastoderm stage, correlating with the onset of zygotic tran-scription, and differ from those in clusters 7B, 8B, and 10B by their annotation as 'ubiquitous' through gastrulation. It is likely that for genes in cluster 7B and 9B, the diminishing maternal expression is augmented by zygotic expression; however, a method that specifically distinguishes between maternal and zygotic transcripts is required to categorize these patterns conclusively.
The genes and expression patterns in broad clusters have largely failed to attract the attention of developmental biolo-gists, as indicated by the fact that the embryonic expression of only 4.3% of them have been described in the scientific liter-ature [18]. Yet, they represent more than half of the genes expressed in embryogenesis. Our analysis of broad patterns provides a comprehensive and unbiased overview of these neglected genes and redefines the definition of ubiquitous gene expression during development. A major lesson learned from our in situ screen is that a CV annotation strategy is insufficient to describe these patterns fully.
Restricted expression patterns
While the diversity of expression patterns was considerable, our hybrid clustering approach identified a number of tissue or domain specific expression patterns shared among a sig-nificant number of genes. While these clusters are more easily categorized than the broad clusters, there is still considerable ambiguity between clusters (Figure 5).
Clusters 1R-4R contain 383 genes expressed in various com-binations of the yolk nuclei, fat body and blood related tissues (Figure 6a-c). Clusters 1R and 2R genes are more likely to be expressed in combinations of these different structures, while 3R genes are primarily expressed in the fat body, and 4R genes in the head mesoderm and related tissues. Interest-ingly, the tissues represented in these clusters derive from distinct developmental lineages, raising the question of whether a single coordinated expression program underlies expression in these seemingly unrelated developmental domains.
Clusters 5R-7R contain 1,160 genes expressed late in embry-ogenesis (stage range 13-16) in a number of epithelial struc-tures (Figure 6d-f), including the epidermis, hindgut, foregut, and trachea. The epithelial pattern (Figure 6d, CG7724, CG4702) is the most recognizable and most abundant tissue-restricted pattern in embryogenesis. The epithelial expres-sion pattern is frequently associated with expresexpres-sion in the
tracheal system (Figure 6e). A subset of genes (Figure 6f) also showed expression in mid-embryogenesis (stages 9-12), sug-gesting they play a role in development and morphogenesis. The differences between the late epithelial clusters (Figure 6d,e) and the early epithelial cluster (Figure 6f) are apparent not only in the CV annotations, but also in the average micro-array profiles of these clusters.
Clusters 13R-16R contain 525 genes expressed specifically in the central and peripheral nervous system (Figure 6g-j). In contrast to the genes in the broad clusters 4B and 5B that are also expressed in the nervous system, these genes lack mater-nally contributed transcripts and any detectable staining at or immediately after gastrulation. The CNS specific gene expres-sion (Figure 6g) begins at stage 11 and almost always includes both the brain and the ventral nerve cord. A subset of genes (Figure 6h) is also expressed in the midline, with a small number showing transcription before stage 11. Genes expressed exclusively in the midline were extremely rare. Many genes are expressed in both the central and peripheral nervous systems (Figure 6i), while a significant number are expressed in the peripheral nervous system alone (Figure 6j).
Clusters 18R and 19R contain 229 genes expressed in either differentiated somatic muscle (Figure 6k) or differentiated visceral muscle (Figure 6l). Most genes that were detected in the visceral muscle became active earlier in the mesoderm primordia. As with the head and trunk components of the nervous system, expression in trunk muscles was almost always accompanied by expression in head muscles.
Clusters 23R-29R contain 422 genes expressed in a domain-specific manner beginning in the blastoderm stage embryo and typically continuing in a tissue-specific manner through-out embryogenesis (Figure 6m-p). Many genes are assigned to more than one cluster with only 148 (35%) assigned to a single cluster. Often genes patterned in the blastoderm show tissue-specific restricted late expression primarily in the CNS and epidermis. The relationship between blastoderm-stage expression and later tissue-specific expression is elusive. While continuity of expression in particular lineage-specific regulatory genes is well-documented, we fail to detect any sta-tistically significant relationship between annotations at the blastoderm and later stages in our full, unbiased set of genes. While we cannot conclusively rule out that this is due to a lim-itation of our CV, it more likely indicates that expression of such genes is initiated independently at different stages of development rather then maintained through developmental lineages.
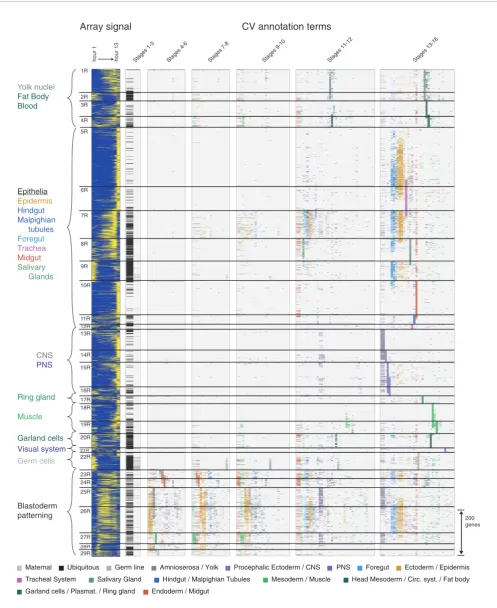
Clustered gene expression data for genes expressed in a restricted manner Figure 5 (see following page)
comm
en
t
re
v
ie
w
s
re
ports
refer
e
e
d
re
sear
ch
de
p
o
si
te
d r
e
sea
rch
interacti
o
ns
inf
[image:9.612.55.552.89.697.2]ormation
Figure 5 (see legend on previous page) 1R
2R 3R
4R 5R
6R
7R
8R
9R
10R
11R
12R
13R
14R
15R
16R 17R 18R
19R
20R
22R
23R 24R 25R
26R
27R
28R
29R
21R
Yolk nuclei
Fat Body Blood
Ring gland
Muscle
Garland cells
Germ cells
Blastoderm patterning Epithelia
Epidermis
Hindgut Malpighian tubules
Foregut
Trachea
Midgut
Salivary Glands
CNS
PNS
Visual system
1
r
u
o
h
3
1
r
u
o
h
8 -7 s e g a t S
0 1 -9 s e g a t S
2 1 -1 1 s e g a t S
6 1 -3 1 s e g a t S 3
-1 s e g a t S
6 -4 s e g a t S
200 genes
CV annotation terms Array signal
Tracheal System Salivary Gland Hindgut / Malpighian Tubules Mesoderm / Muscle Head Mesoderm / Circ. syst. / Fat body Ubiquitous Germ line Amnioserosa / Yolk Procephalic Ectoderm / CNS PNS Foregut Ectoderm / Epidermis Maternal
An additional eight clusters contain 349 genes with late tis-sue-specific expression (Additional data file 9a-h). Some of these contain genes expressed throughout development in a single tissue, like the cluster of genes expressed in pole and germ-cell (Additional data file 9h), while others, like the clus-ter of midgut-specific genes (Additional data file 9b), are pri-marily expressed in a particular tissue at a particular time.
Despite the significant number of genes that conform well to the patterns represented by the above clusters, a large frac-tion is expressed in unique combinafrac-tions of tissues or organs. Fuzzy clustering assigned these genes to the set of clusters that best described their expression patterns. Of the 1,947
[image:10.612.56.557.88.516.2]genes expressed in a restricted manner, 795 (41%) are assigned to more than one cluster (Table 1). We illustrate this by showing several examples of genes assigned to multiple clusters (Figure 7). By allowing genes to be placed into more than one expression cluster, we also hope to facilitate online searches of our dataset by representing the range of each gene's expression. The 29 restricted clusters can be viewed as distinct transcriptional programs and the numerous genes that are expressed in unique combination of tissues combine these basic programs. Such a view is consistent with our cur-rent understanding of how complex patterns of expression are generated by a set of independently acting cis-regulatory modules [30]. An interesting direction for future research will Overview of the restricted expression patterns
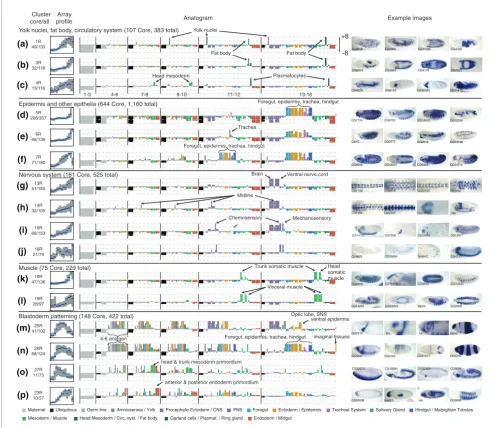
Figure 6
Overview of the restricted expression patterns. For unique genes in each cluster, we summarized the array profiles, diversity of annotation terms (as an anatogram), and number of total and core genes and show two to four embryo images. Whenever possible, genes with previously uncharacterized expression patterns were selected. Array plots show the distribution of scaled intensity scores: the blue line indicates the median value while the gray box gives the inter-quartile range. The most relevant annotation terms in each anatogram are labeled.
Epidermis and other epithelia (644 Core, 1,160 total) Foregut, epidermis, trachea, hindgut
CG4702
CG7724 CG14243 CG12268
5R 206/357
(d)
Yolk nuclei, fat body, circulatory system (107 Core, 383 total)
+8
-8
Fat body Yolk nuclei
Fat body
CG4306
Cyp6a8 CG2065 CG11395
1R 49/133
(a)
CG3999
CG6910 CG4145 CG7227
3R 32/118
(b)
7-8 9-10 11-12 13-16
4-6 1-3
Plasmatocytes Head mesoderm
CG4829 CG8193 CG32423 CG11415
4R 15/116
(c)
Nervous system (181 Core, 525 total) Brain Ventral nerve cord
CG32105 CG1732 CG6218 Obp44a
13R 51/185
(g)
Midline
Oatp26F tap CG1124 CG13248
14R 32/105
(h)
Foregut, epidermis, trachea, hindgut
CG8306 CG18507 CG9326 CG14110
7R 71/180
(f)
Trachea
Osi15 CG3777 CG2016 CG13196
6R 65/139
(e)
Chemosensory Mechanosensory
CG12869 CG7300 CG12911 CG14762
15R 66/153
(i)
Muscle (75 Core, 229 total) Trunk somatic muscle Head somatic muscle
CG2330 CG11658 CG6803 CG13424
18R 47/136
(k)
Visceral muscle
CG33253 Mp20 CG5080
CG14207
19R 28/97
(l)
Blastoderm patterning (148 Core, 422 total) Optic lobe, SNSventral epidermis
pdm2 toc
btd CG7312
25R 41/102
(m)
4-6 anlagen Foregut, epidermis, trachea, hindgut imaginal tissues
CG5249 CG31871 CG4702
CG3097
26R 68/124
(n)
CG10064 Tektin-C CG4133 CG18675
16R 21/79
(j)
CG32372 CG10391 CG32423 CG9005
27R 11/75
(o)
head & trunk mesoderm primordium
ImpE2
CG31038 dm CG5656
23R 10/57
(p)
anterior & posterior endoderm primordium
Tracheal System Salivary Gland Ubiquitous Germ line Amnioserosa / Yolk Procephalic Ectoderm / CNS PNS Foregut Ectoderm / Epidermis
Maternal Mesoderm / Muscle
Hindgut / Malpighian Tubules Head Mesoderm / Circ. syst. / Fat body Garland cells / Plasmat. / Ring gland Endoderm / Midgut
Cluster core/all
Array
comm
en
t
re
v
ie
w
s
re
ports
refer
e
e
d
re
sear
ch
de
p
o
si
te
d r
e
sea
rch
interacti
o
ns
inf
ormation
be to uncover the cis-regulatory modules that are associated with the individual restricted clusters and to examine whether or how these modules are utilized to achieve the observed diversity in gene expression.
Can we estimate the number of distinct expression patterns in
Drosophila embryogenesis? When we use a relatively con-servative measure, requiring that genes need to share 75% or more of their annotation terms to be considered 'indistinguishable', we identify 173 multi-gene groups and 1,141 singletons among the genes in our restricted clusters. Thus, by removing the broad genes, which are prone to incon-sistent annotation, the number of groups within our dataset based on this measure drops from 2,197 to 1,314, providing one estimate of the number of 'distinct' patterns (Additional data file 6). On the other hand, these patterns are not unre-lated. We consider the 29 restricted clusters the most promi-nent recurring patterns in the dataset, and we can only speculate where to place the biologically significant number of patterns within these two extremes. It is clear that the clus-ters are not homogenous since 41% of the genes exhibit com-posite patterns. If we look at all observed combinations of cluster assignments, we find 454 distinct combinations, and 287 of these cluster combinations consist of a single gene. We favor the idea that many of the composite patterns observed result from simple additive combination of the basic patterns driven by independently acting cis-regulatory modules. Direct examination of the patterns that each of these cis -reg-ulatory modules generates in transgenic reporter assays, rather than the patterns of entire genes, will be more powerful in revealing the underlying mechanisms and logic governing the generation and evolution of each gene's expression pattern.
Relatedness of distinct tissues
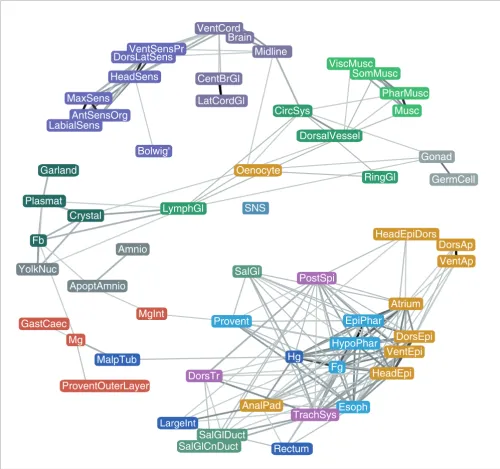
Besides grouping genes according to the similarity of gene expression patterns, we used our annotation dataset to define relatedness among tissues based on the similarity of the set of genes expressed in them. Figure 8 shows a network plot where tissues were connected by flexible links proportional to the fraction of commonly expressed genes and a force-directed layout was used to bring more similar tissues into proximity with each other. Tissues within individual organ systems, such as muscle (green), CNS (purple), and peripheral nervous system (violet), cluster tightly. The Bol-wig's organ is isolated from the rest of the tissues, highlight-ing its distinct set of expressed genes. Similarly, tissues such as germ cells and amnioserosa, ring gland, stomatogastric nervous system, Malpighian tubule, midgut and garland cells share relatively few expressed genes with other tissues. In contrast, the genes expressed in the posterior spiracle, despite forming their own cluster (Additional data file 9e), appear to be components of many other tissues. As noted above, yolk nuclei, fat body and plasmatocytes share expres-sion of a significant number of genes. In this representation, these structures are weakly related to lymph gland, which in turn shares expressed genes with the circulatory system. Many of the genes expressed in the oenocyte are also expressed in crystal cells, lymph gland, ring gland, midline, gonad and circulatory system.
[image:11.612.53.558.84.203.2]The largest, most interconnected set of structures roughly corresponds to the epithelial pattern defined by clusters 5R, 6R and 7R. Notably, the salivary gland duct is isolated from the salivary gland body, reflecting their functional divergence and differential gene expression. The salivary gland duct and trachea are linked by their shared expression of genes required for cuticle deposition. In terms of gene expression, the anal pads are more similar to the hindgut than to other epidermal structures. The large distance between neural and Genes classified in multiple clusters
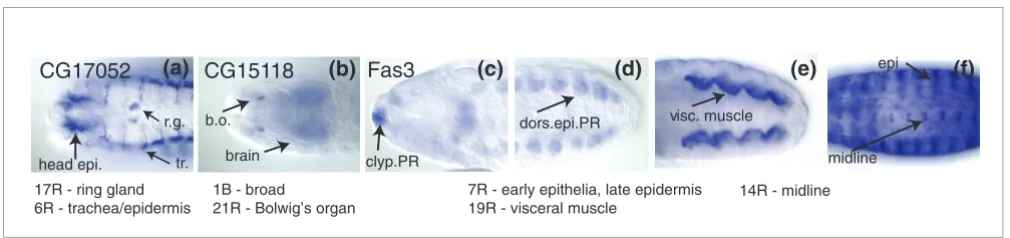
Figure 7
Genes classified in multiple clusters. (a) CG17052 is expressed in the ring gland as well as a number of epithelial structures at stage 14. It belongs to two clusters: 17R, the ring gland (r.g.); and 6R, the late epithelial pattern with trachea (tr.). (b) CG15118 is expressed specifically in Bolwig's organ (b.o.), along with broad staining in the brain, ventral nerve cord, anal pad, hindgut, and faintly throughout the embryo. It is classified as belonging to a broad cluster, 1B, as well as the Bolwig's organ cluster, 21R. (c-f) Fas3 has a complex expression pattern and is annotated with 27 individual annotation terms. At stage 12, it is expressed in various epithelia, including the clypeolabrum PR (clyp.PR) (c) and dorsal epidermis primordium (dorsi.epi.PR) (d), the visceral muscle PR (e) and the brain PR (not shown). At stage 15, Fas-3 is expressed in the central nervous system, including the midline, along with visceral muscle and various epithelial structures, including the trachea, hindgut, foregut, clypeolabrum, and epidermis (epi) (f). Fas-3 belongs to three clusters: 7R, the early epithelial pattern; 19R, visceral muscle; and 14R, the midline/CNS cluster.
Fas3
CG17052
CG15118
r.g.
tr. head epi.
b.o.
brain
dors.epi.PR
clyp.PR
visc. muscle
(d)
(e)
(f)
midline epi
17R - ring gland 6R - trachea/epidermis
1B - broad
21R - Bolwig’s organ
7R - early epithelia, late epidermis 19R - visceral muscle
14R - midline
(c)
(b)
other ectodermal derivatives suggests that specification of neuronal versus epidermal cell fate leads to profound genome-wide changes in transcription. Patterns within the digestive system are interesting - while hindgut and foregut expression are strongly correlated, midgut expression is markedly different despite its functional and spatial related-ness, reflecting its distinct developmental origin.
Relationship between expression and function
[image:12.612.57.557.87.556.2]Determining a gene's pattern of expression is a key step towards understanding its function during development. The functions of many genes have been determined, either by direct experimental analysis or by sequence homology and compiled by the GO consortium [20]. Additionally, the Uni-prot database catalogs Uni-protein domains and provides phylo-genetic relationships [31]. For each of our 6,003 genes, we Network representation of tissue relatedness
Figure 8
Network representation of tissue relatedness. Nodes represent collapsed annotation terms and edges represent the correlation between expression in each pair of terms. Only tissues that share a statistically significant number of genes are linked and the strength of the links is proportional to the number of genes the two tissues have in common. Tissues that share very few or no genes repel each other. The system is allowed to reach a low energy level in two-dimensional space under a physical spring model (force directed layout). Collapsed annotation terms are color-coded according to their organ system assignments as used throughout.
HeadSens
Fg
EpiPhar
HypoPhar
Esoph
Provent
ProventOuterLayer
Atrium
SalGlDuct
SalGlCnDuct
VentEpi
AnalPad
VentAp
VentSensPr
Midline
DorsEpi
DorsAp
Oenocyte
TrachSys
PostSpi
DorsTr
GastCaec
Hg
MalpTub
LargeInt
Rectum
Plasmat
Crystal
Garland
CircSys
DorsalVessel
LymphGl
Musc
PharMusc
SomMusc
ViscMusc
Fb
Gonad
GermCell
RingGl
HeadEpiDors
YolkNuc
HeadEpi
Mg
Amnio
MgInt
SalGl
SNS
VentCord
Brain
LabialSens
MaxSens
DorsLatSens
ApoptAmnio
CentBrGl
Bolwig'
comm
en
t
re
v
ie
w
s
re
ports
refer
e
e
d
re
sear
ch
de
p
o
si
te
d r
e
sea
rch
interacti
o
ns
inf
ormation
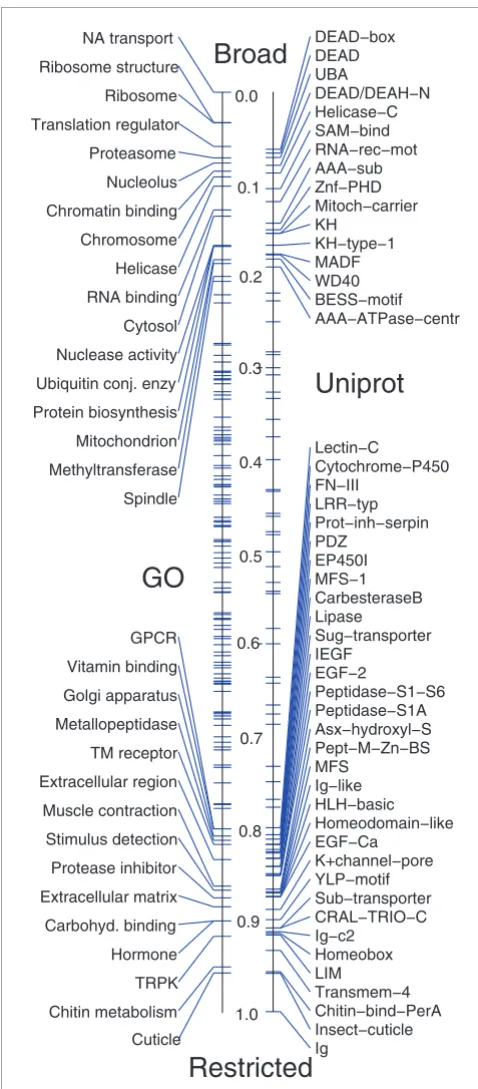
determined the relative distribution of these terms and domains within the broad versus restricted clusters (Figure 9), highlighting categories containing less than 20% or more than 80% restricted genes. As discussed before, broad clus-ters are heavily enriched for genes involved in core cellular processes, such as translation, protein degradation, cell divi-sion, energy metabolism and RNA binding proteins. The majority of transcripts for RNA binding proteins are depos-ited maternally into the early embryo, highlighting the neces-sity for mRNA processing prior to the onset of zygotic transcription. Restricted clusters are enriched in genes with sequence-specific DNA-binding domains and signaling mole-cules and also contain a large number of the genes involved in cuticle formation.
To examine the enrichment of GO and Uniprot categories in individual gene expression clusters, we performed exhaustive pair-wise comparisons [21]. We used the binomial test to evaluate the statistical significance of overlaps between sets of genes defined by the different data-sources. In order to cor-rect the significance estimates for multiple testing we determined the empirical chance distribution by performing a large number of random permutations of gene functional assignments and determining the rate at which we attained particular p values. We interpolated these results using a log-linear regression function to fit the empirical distribution (Materials and methods). The results of this analysis are shown in Additional data file 8, which lists all GO essential (Materials and methods [21]) and Uniprot categories signifi-cantly enriched in gene expression clusters (those with an adjusted p value of less than 0.05 and 3-fold or greater enrichment).
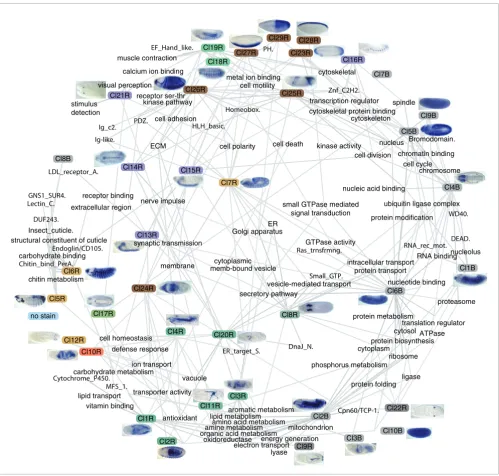
To summarize the functional associations of gene expression clusters, we created a force-directed layout network, which brings into close proximity clusters and GO/Uniprot catego-ries sharing a significant number of genes (Figure 10). In the force-directed layout, restricted and broad clusters separate robustly, with the notable exception of germ cell cluster 22R, which associates strongly with functions typical of broad maternal genes. This connection may be due to the fact that restriction of transcripts to the germ line lineage is often a consequence of protection of maternal message from degra-dation in early forming pole cells. Another cluster that vio-lates the broad versus restricted separation is cluster 8B, which shows maternal-only expression based on in situ pho-tographs but is enriched for genes involved in cuticle metab-olism. Since formation of the cuticle effectively prevents RNA
in situ hybridization, we propose that the genes in cluster 8B are likely expressed during late embryogenesis in a pattern resembling epithelial expression (similar to cluster 5R and 6R), although this pattern cannot be visualized by the stand-ard in situ protocol. The late spike in the average array profile of cluster 8B genes supports this notion.
[image:13.612.54.293.84.629.2]Distribution of GO annotations and Uniprot domains within broad versus restricted clusters
Figure 9
Distribution of GO annotations and Uniprot domains within broad versus restricted clusters. GO annotations (left) and Uniprot domains (right) are plotted on a number line according to the relative fraction of genes contained within broad versus restricted expression clusters. We label categories where at least 80% of the genes with patterns belong to either broad or restricted clusters.
DEAD−box DEAD UBA
DEAD/DEAH−N Helicase−C SAM−bind RNA−rec−mot AAA−sub Znf−PHD Mitoch−carrier KH
KH−type−1 MADF WD40 BESS−motif AAA−ATPase−centr
Lectin−C
Cytochrome−P450 FN−III
LRR−typ Prot−inh−serpin PDZ
EP450I MFS−1 CarbesteraseB Lipase
Sug−transporter IEGF
EGF−2
Peptidase−S1−S6 Peptidase−S1A Asx−hydroxyl−S Pept−M−Zn−BS MFS
Ig−like HLH−basic Homeodomain−like EGF−Ca
K+channel−pore YLP−motif Sub−transporter CRAL−TRIO−C Ig−c2
Homeobox LIM
Transmem−4 Chitin−bind−PerA Insect−cuticle Ig
0.0
0.1
0.2
0.3
0.4
0.5
0.6
0.7
0.8
0.9
1.0
Broad
Restricted
NA transportRibosome structure
Ribosome
Translation regulator
Proteasome
Nucleolus
Chromatin binding
Chromosome
Helicase
RNA binding
Cytosol
Nuclease activity
Ubiquitin conj. enzy
Protein biosynthesis
Mitochondrion
Methyltransferase
Spindle
GPCR
Vitamin binding
Golgi apparatus
Metallopeptidase
TM receptor
Extracellular region
Muscle contraction
Stimulus detection
Protease inhibitor
Extracellular matrix
Carbohyd. binding
Hormone
TRPK
Chitin metabolism
Cuticle
Uniprot
Interestingly, cluster 7R, containing genes with early (stage 12) onset epithelial expression, clearly separates from 5R and 6R, which contain genes with late epithelial expression (stages 13-16). Early epithelial expressing genes are
[image:14.612.59.558.84.560.2]associ-ated with GO terms for tissue specific functions, such as membrane trafficking, morphogenesis, cell polarity, motility and adhesion, which makes them similar to genes found in the early blastoderm patterning gene cluster (cluster 26R). In Network representation of the relationship between gene expression and gene function
Figure 10
Network representation of the relationship between gene expression and gene function. Thirty-nine gene expression clusters (broad and restricted) together with the most significantly enriched GO terms and Uniprot domains (italicized) are organized in two-dimensional space by a force directed layout as in Figure 9. The strength of links between expression clusters and GO/Uniprot terms is determined by the level of enrichment of the GO/Uniprot term within the expression cluster (using z-scores in Additional data file 8). The strength of links between pairs of expression clusters and pairs of GO/Uniprot terms are determined by comparing similarity with respect to the opposite class (so that expression clusters are compared with respect to the GO/ Uniprot terms they have similarity with, and vice versa; see Materials and methods). Expression cluster representative in situ images: Cl1B CG12792; Cl2B CG4567; Cl3B CG4078; Cl4B CG2656; Cl5B CG3227; Cl6B CG7375; Cl9B CG8464; Cl10B CG13349; Cl1R CG3246; Cl2R CG8066; Cl3R CG2233; Cl4R CG4829; Cl5R Osi14; Cl6R CG32209; Cl7R CG12676; Cl8R CG14756; Cl9R CG10527; Cl10R CG1246; Cl11R CG6337; Cl12R CG9468; Cl13R CG15651; Cl14R CG31764; Cl15R CG14762; Cl16R CG18675; Cl17R CG8888; Cl18R CG6429; Cl19R CG8780; Cl20R CG15209; Cl21R CG4468; Cl22R CG9925; Cl23R rib; Cl24R CG8147; Cl25R CG8965; Cl26R odd; Cl27R CG12177; Cl28R CG13653; Cl29R CG10967.
Endoglin/CD105.
Cpn60/TCP-1.
Bromodomain.
GNS1_SUR4.
ER_target_S. DUF243.
spindle
vitamin binding
EF_Hand_like.
antioxidant
DnaJ_N. Lectin_C.
vacuole
PDZ.
stimulus detection
HLH_basic.
PH.
cell homeostasis chitin metabolism
ECM
nucleolus
Chitin_bind_PerA.
lipid transport
DEAD. Ig_c2.
cell polarity
Golgi apparatus muscle contraction
structural constituent of cuticle
chromatin binding
Cytochrome_P450.
carbohydrate binding
MFS_1.
Insect_cuticle.
translation regulator
Ras_trnsfrmng.
Small_GTP. Ig-like.
ER
cell division
lyase
ubiquitin ligase complex small GTPase mediated
signal transduction
protein folding
GTPase activity RNA_rec_mot.
secretory pathway
WD40.
ribosome calcium ion binding
receptor binding
cytoskeletal protein binding
cytosol cytoskeleton cell motility
cytoskeletal
cell adhesion
vesicle-mediated transport nerve impulse
cell death
Znf_C2H2.
amino acid metabolism
ligase extracellular region
electron transport
ATPase kinase activity
ion transport
amine metabolism organic acid metabolism
RNA binding
defense response
cell cycle
carbohydrate metabolism
mitochondrion energy generation
protein biosynthesis protein transport
lipid metabolism
phosphorus metabolism intracellular transport
oxidoreductase
protein modification transcription regulator
nucleotide binding
transporter activity
metal ion binding
nucleus
cytoplasm membrane
nucleic acid binding
protein metabolism
Cl29R Cl28R
Cl27R
Cl25R
Cl24R
Cl23R
Cl22R Cl20R
Cl19R
Cl18R
Cl17R
Cl13R
Cl11R
Cl9R Cl6R
Cl4R
Cl3R
Cl2R Cl1R
Cl10B Cl8B
Cl3B Cl2B no stain
proteasome Cl6B
Cl12R
Cl9B
Cl5R
Cl21R
Cl7R Cl26R
Cl7B
Cl5B
Cl4B
Cl1B
Cl10R
Cl15R receptor ser-thr
kinase pathway
cytoplasmic memb-bound vesicle
Homeobox.
synaptic transmission
Cl16R
chromosome visual perception
LDL_receptor_A. Cl14R
comm
en
t
re
v
ie
w
s
re
ports
refer
e
e
d
re
sear
ch
de
p
o
si
te
d r
e
sea
rch
interacti
o
ns
inf
ormation
contrast, late epithelial clusters (clusters 5R and 6R) associ-ate clearly with cuticle formation in terminally differentiassoci-ated tissues. This is the best example in our dataset of separation between regulatory developmental genes and effector genes [32] of the terminal cell fates.
Genes in cluster 24R are expressed in yolk, mesoderm, dorsal ectoderm and anterior and posterior endoderm anlagen at the blastoderm stage. Consistent with this early expression, these genes are expressed later in differentiated midgut, yolk, fat body and plasmatocytes. The force directed layout
suggests that these genes are functionally related to clusters 1-4R, which contain genes expressed in yolk, fat body and blood and involved in metabolite transport. Cluster 24R clearly separates from other blastoderm stage clusters, sug-gesting that for these particular tissues, specific effector genes are required early in and throughout embryonic development.
[image:15.612.54.555.86.551.2]GO terms related to membrane trafficking, such as secretory pathway, vesicle transport, Golgi apparatus, and ER, assume a central position in the layout with numerous connections to Anatogram summary for selected GO and Uniprot categories
Figure 11
Anatogram summary for selected GO and Uniprot categories. Anatograms are used to summarize gene expression for selected (a-j) GO terms and (k,l) Uniprot protein domains. Categories related to transcriptional regulation (a-c) are boxed, as are two categories strongly enriched in clusters 5R and 6R representing epithelial patterns (k,l). Tissues discussed in the main text are labeled.
cell-adhesion (145 genes)
-8 -4 0 4 8
(d)
transcription-regulator (405 genes)
-8 -4 0 4 8
(a)
Homeobox.csv (34 genes)
-8 -4 0 4 8
(b)
zf-C2H2 (39 genes)
-8 -4 0 4 8
(c)
detection-of-stimulus (27 genes)
-8 -4 0 4 8
(g)
chitin-metabolism (28 genes)
-8 -4 0 4 8
(h)
kinase (194 genes)
-8 -4 0 4 8
(f)
structural-constituent-of-cytoskeleton (139 genes)
-8 -4 0 4 8
(e)
helicase (61 genes)
-8 -4 0 4 8
(j)
(k)
(l)
gonad
trachea PNS-photo CNS
epidermis foregut
muscle
[PF03103]-DUF243 (13 genes)
-8 -4 0 4 8
epidermis [SM00241]-ZP (8 genes)
-8 -4 0 4 8
epidermis
foregut trachea hindgut
Tracheal System Salivary Gland Ubiquitous Germ line Amnioserosa / Yolk Procephalic Ectoderm / CNS PNS Foregut Ectoderm / Epidermis
Maternal
Mesoderm / Muscle
diverse clusters both broad and restricted. This likely reflects the requirement of these core cellular processes in diverse cell types, but also indicates that there are tissue specific differ-ences in the utilization of these pathways. The modulation of these pathways is mediated by GTPases [33], which exhibit similar connectivity patterns in the force directed layout (Fig-ure 10).
CNS and muscle clusters associate with the expected GO terms for nerve impulse transmission and muscle contrac-tion, respectively. Interestingly, despite their clear functional specialization, both tissues show a common requirement for components of the extracellular matrix.
Another way to uncover relationships between gene expres-sion and gene function is to examine the representation of GO terms in individual tissues using the 'anatograms' (Figure 11). For example, transcriptional regulators are predominantly expressed in the developing and mature nervous systems (Figure 11a). Regulation of transcription initiation by sequence-specific transcription factors is the primary mecha-nism used to generate tissue-specific gene expression. We determined the gene expression patterns for 238 transcrip-tion factors with sequence-specific DNA binding domains; at least one transcription factor is expressed in every tissue type recognized by our annotation hierarchy. We examined the two most abundant transcription factor classes, those with C2H2 zinc finger domains (Figure 11b) and those with home-obox domains (Figure 11c), and found that these domains show similar overall distributions, suggesting that they are deployed to regulate a similar range of developmental processes.
Cell adhesion molecules are similar to transcription factors in that they are expressed early in development in a number of anlagen, and are later abundant in the nervous system. In addition, these molecules are moderately enriched in differ-entiated epidermal derivatives (Figure 11d). Cytoskeletal components are enriched in the nervous system and muscles, suggesting that the tissue relatedness observed between mes-odermal and neural derivatives is dictated by shared func-tional requirements of these cell types (Figure 11e). Interestingly, the tissue distribution of kinases is almost indistinguishable from the genome-wide average of all genes (Figure 11f). We also find strong and specific associations between genes with particular GO functions and the tissues in which they are expressed, such as stimulus and Bolwig's organ, chitin metabolism and late epithelial patterns, and hel-icases and gonads (Figure 11g,h,j).
Comparison of GO terms and gene expression data often leads to self-evident observations because many functional GO assignments are based on published gene expression patterns. We used the Uniprot catalog to correlate gene expression and protein domains (Figure 10). Figure 11 shows several domains expressed specifically in differentiated
epi-dermal derivatives. For example, the zona pellucida genes encode transmembrane glycoproteins that were recently shown to be critical for tracheal morphogenesis [34]. These and other zona pellucida genes are expressed in the 5R/6R epithelial pattern (Figure 11k), which is consistent with a prior study of zona pellucida embryonic expression [35]. A novel domain that apparently exists only in flies, DUF243, is found almost exclusively in proteins encoded by genes with the late 5R pattern (Figure 11l). These tight associations of functional sequence properties and patterns of gene expression provide useful insights into how regulatory strate-gies are dictated by gene function.
Conclusion
We have described the most complete set of data on spatial and temporal patterns of gene expression during embryogen-esis that has been compiled for any metazoan organism. The extent, quality, and unbiased nature of this dataset allowed us to describe and explore gene expression patterns during embryogenesis on a genome wide basis. Below we discuss three issues: how this data can be used as a resource by biologists; the inherent challenges in analyzing such a com-plex set of data; and what we learned about global strategies for regulating gene expression during embryonic develop-ment of a complex multi-cellular organism.
Utility of the dataset
The dataset we assembled can be used in several ways. First, it provides a rich source of candidate genes for further in-depth study. Researchers interested in a particular develop-mental process, for example, morphogenesis of the salivary gland, can search our annotations and retrieve a list of genes that are expressed in that structure. Such a gene set can be further subdivided by manual curation, using our primary image data. Second, the clustering classification allows one to address more abstract questions, such as: which genes are expressed in a regulated manner at cellular blastoderm? And which genes are involved in organogenesis in the late embryo? Finally, the dataset represents a starting point for an analysis of the sequence determinants of gene expression pat-terns. Clustering provides gene groupings based on spatio-temporal gene expression, ranging from unique patterns, through small tightly co-regulated gene sets, to large gene expression classes. These classes can be tested against cis -regulatory prediction pipelines to identify significant associations between gene expression specificity and genomic sequence features.