pufferfish are closely related to each other, and the zebrafish
is more closely related to the pufferfish than to mammals and
therefore shares a branch with the pufferfish on the
phyloge-netic tree. In several cases, for example Tab1 and Tab2, the
Tetraodon
sequences do not group with their counterparts
from
Takifugu
. In most of these cases this is due to internal
deletions or insertions, or terminal deletions or extensions in
the
Tetraodon
genes, which are most easily explained by
unreliable predictions for these genes based on faulty
assem-bly of the genome (see below for specific cases). We have not
investigated these cases further.
For the class II cytokine receptor family the orthology was
less clear (see Class II cytokines and their receptors, below) or
nonexistent, as has previously been noted [17]. For one group
of proteins, those containing NLRs, our comparison reveals
extensive, species-specific expansion of subfamilies (see
Intracellular pathogen sensors: the NACHT-domain family,
below).
Each of these groups of proteins is discussed individually
below.
Gene families with largely orthologous relationships
between teleosts and mammals
In the protein families of the immune kinases, the adaptors in
the TLR signaling pathway, the interferon response factors
(IRFs), the signal transducers and activators of transcription
(Stats), and the Trafs we found orthologous genes in fish for
almost all of the mammalian genes. This is summarized in
Figures 2 to 6. However, there were also occasional
duplica-tions or losses either in the fish or in the mammalian lineage.
The findings are briefly summarized below and in the figure
legends.
Kinases
[image:3.612.54.555.86.468.2]
The kinases were the family that exhibited the most apparent
orthologies between fish and mammals. For all of the
essen-tial kinases involved in signal transduction mediated by TLR,
Components of the TLR and IFN signaling pathways and intracellular pattern recognition receptors
Figure 1
TNF, and nucleotide oligomerization domain containing
pro-tein (Nod), we find orthologs in zebrafish and in most cases
also in pufferfish. IL-1 receptor associated kinase (IRAK)2,
which is thought to serve as an accessory protein in
[image:4.612.50.554.86.565.2]
combina-tion with IRAK1, was not found in any of the three fish. This
suggests that it has arisen from a duplication event that
occurred only within the mammalian lineage (Figure 3). The
alternative, loss of IRAK2, for example in the teleost lineage
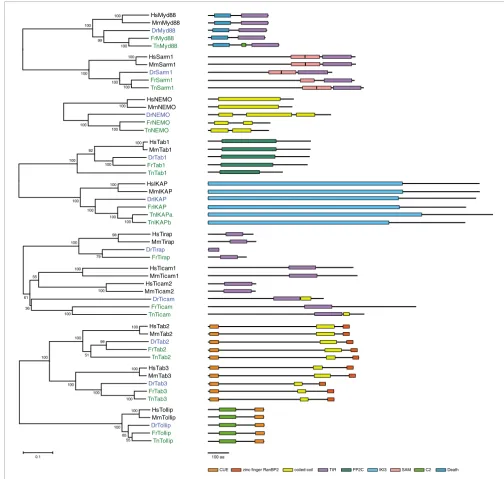
Phylogenetic trees of the innate immune signaling adaptors and diagrams of their protein structures
Figure 2
Phylogenetic trees of the innate immune signaling adaptors and diagrams of their protein structures. The fish protein names are highlighted in blue (Dr
[
Danio rerio
]) or green (Fr [
Takifugu rubripes
] and Tn [
Tetraodon nigroviridis
]). The numbers in the tree indicate the bootstrap values. Scale: interval of 0.1
amino acid substitutions. Hs,
Homo sapiens
, Mm,
Mus musculus
. Protein domains are shown as boxes based on identification by Pfam [55] or Smart [56].
Some domains were not recognized by these programs, although manual inspection indicated clear conservation of the domain within the protein family.
These domains are also shown as boxes in the diagrams. The identities of the domains are listed at the bottom. Scale bar = 100 amino acids. The
Tetraodon
version of the Ikap (IKK [Inhibitor of nuclear factor-
κ
B kinase] complex associated protein) gene contains two full repeats of the IKI3 domain. It is not
clear whether this prediction is due to an error in the genome assembly or whether the gene does indeed contain an internal duplication covering the
whole length of the gene found in other species. The two halves of the predicted gene were treated as separate peptides in the phylogenetic tree and the
diagram.
HsMyd88
MmMyd88
DrMyd88
FrMyd88
TnMyd88
HsSarm1
MmSarm1
DrSarm1
FrSarm1
TnSarm1
HsNEMO
MmNEMO
DrNEMO
FrNEMO
HsTab1
MmTab1
DrTab1
FrTab1
TnTab1
HsIKAP
MmIKAP
DrIKAP
FrIKAP
TnIKAPa
TnIKAPb
HsTab2
MmTab2
DrTab2
FrTab2
TnTab2
100
100
100
100
HsTollip
MmTollip
DrTollip
FrTollip
TnTollip
100
55
85
100
100
100
100
100
100
100
100
99
100
100
100
92
99
100
100
51
100
100
0.1
CUE
zinc finger RanBP2
coiled-coil
TIR
PP2C
IKI3
SAM
C2
Death
100 aa
HsTab3
MmTab3
DrTab3
FrTab3
TnTab3
100
100
100
100
HsTirap
MmTirap
DrTirap
FrTirap
HsTicam1
MmTicam1
HsTicam2
MmTicam2
DrTicam
FrTicam
TnTicam
98
100
79
100
100
100
55
36
61
100
100
100
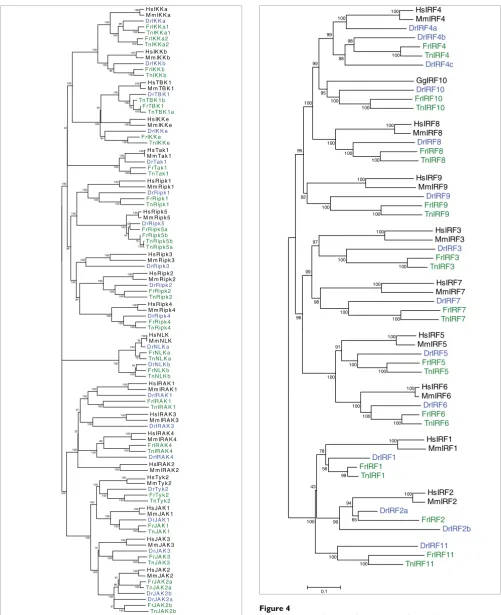
Phylogenetic tree of the kinases
Figure 3
Phylogenetic tree of the kinases. Details of the tree are as in Figure 2.
H s IK K a
M m IK K a
D rIK K a
F rIK K a1
TnIK K a1
F rIK K a2
TnIK K a2
100
100
99
100
100
100
100
H s IK K b
M m IK K b
D rIK K b
F rIK K b
TnIK K b
100
100
96
100
H s TB K 1
M m TB K 1
D rTB K 1
TnTB K 1b
F rTB K 1
TnTB K 1a
100
100
79
100
100
100
H s IK K e
M m IK K e
D rIK K e
F rIK K e
TnIK K e
100
50
100
84
100
H s Tak 1
M m Tak 1
D rTak 1
F rTak 1
TnTak 1
100
100
100
100
42
H s R ipk 1
M m R ipk 1
D rR ipk 1
F rR ipk 1
TnR ipk 1
100
100
100
100
100
H s R ipk 5
M m R ipk 5
D rR ipk 5
F rR ipk 5a
F rR ipk 5b
TnR ipk 5b
TnR ipk 5a
100
47
100
75
45
100
H s R ipk 3
M m R ipk 3
D rR ipk 3
100
100
100
99
H s R ipk 2
M m R ipk 2
D rR ipk 2
F rR ipk 2
TnR ipk 2
100
100
100
100
99
100
H s R ipk 4
M m R ipk 4
D rR ipk 4
F rR ipk 4
TnR ipk 4
100
100
100
100
H s N LK
M m N LK
D rN LK a
F rN LK a
TnN LK a
D rN LK b
F rN LK b
TnN LK b
100
76
75
100
54
100
100
H s IR A K 1
M m IR A K 1
D rIR A K 1
F rIR A K 1
TnIR A K 1
100
100
100
100
H s IR A K 3
M m IR A K 3
D rIR A K 3
100
100
57
32
H s IR A K 4
M m IR A K 4
F rIR A K 4
TnIR A K 4
D rIR A K 4
100
100
99
100
H sIR A K 2
M m IR A K 2
100
100
100
100
H s JA K 3
M m JA K 3
D rJA K 3
F rJA K 3
TnJA K 3
100
100
100
79
100
H s JA K 2
M m JA K 2
F rJA K 2a
TnJA K 2a
D rJA K 2b
D rJA K 2a
F rJA K 2b
TnJA K 2b
100
100
61
98
100
47
100
0.1
H s Ty k 2
M m Ty k 2
D rTy k 2
F rTy k 2
TnTy k 2
100
100
100
100
H s JA K 1
M m JA K 1
D rJA K 1
F rJA K 1
TnJA K 1
100
100
100
100
100
[image:5.612.54.555.82.697.2]
Phylogenetic tree of the interferon response factors
Figure 4
[image:5.612.304.553.88.666.2]
Phylogenetic tree of the interferon response factors. Details are as in
Figure 2. The chicken (Gg [
Gallus gallus
]) IRF10 was included to show its
relationship to fish IRF10, because no ortholog for this gene is found in
mammals. IRF, interferon response factor.
(it is also absent in
Medaka
and stickleback), is less likely
because a search of the ray and shark genomes did not
iden-tify any sequences for IRAK2. Conversely, we find
duplica-tions in the fish lineage for Jak2 (Janus kinase 2) and NLK
(nuclear factor-
κ
B [NF-
κ
B] essential modulator-like kinase),
and duplications in both pufferfish for IKKa (inhibitor of
NF-κ
B kinase) and Ripk5 (receptor-interacting protein kinase 5).
Adaptors
The adaptors that are involved in innate immune signaling
cascades are well conserved in fish, as was previously
observed for those interacting with the TLRs [6,7,23]. We find
orthologous genes in each of the three fish species for Myd88
(myeloid differentiation factor 88), Sarm1 (sterile
α
and
HEAT/armadillo motif containing protein 1), Tollip, IKAP
(IKK complex associated protein), NEMO (NF-
κ
B essential
modulator), Tab1, Tab2, and Tab3, and in the zebrafish and
Takifugu
for Tirap (Toll/IL-1 receptor associated protein).
For the mammalian Ticam (Toll-like receptor adaptor
mole-cule)1 and Ticam2 (also named TRIF and TRAM) genes, there
is only one homologous gene in each of the three fish, which
is equally distant to Ticam1 and Ticam2, indicating a
duplica-tion of an ancestral gene in the mammalian lineage and
sub-sequent divergence of the two copies (Figure 2). The
alternative interpretation, that Ticam2 was lost specifically in
the teleost lineage, does not fit with the fact that it is also not
present in the genomes of
Xenopus
and chicken [28]. An
apparent contradiction to our observation is a report of both
Ticam1 and Ticam2 in
Hydra
[29]. However, cnidarians too
have only one Ticam, because the gene cited as Tram is in fact
not the TRAM (TRIF-related adaptor molecule) that is
synon-ymous with Ticam2, but encodes an unrelated protein, the
translocation-associated membrane protein, which has the
same acronym.
IFN response factors
For IRF1, IRF3, and IRF5 to IRF9, clear orthologous
relation-ships are found between mammals and fish. In each fish
spe-cies we also find an additional gene, which we call IRF11 and
which is equally distant to both IRF1 and IRF2. DrIRF4b,
which is most closely related to the IRF4s found in the
puffer-fish, maps to a region of the genome that is syntenic with the
region containing IRF4 in mammals and in the two
puffer-fish, indicating that these are orthologous genes. In addition
to the homologs of the IRFs in mammals, we find an
addi-tional IRF in each of the fish, which we named IRF10, because
it groups with a similar gene from chicken. It appears that this
gene has been lost in mammals (Figure 4).
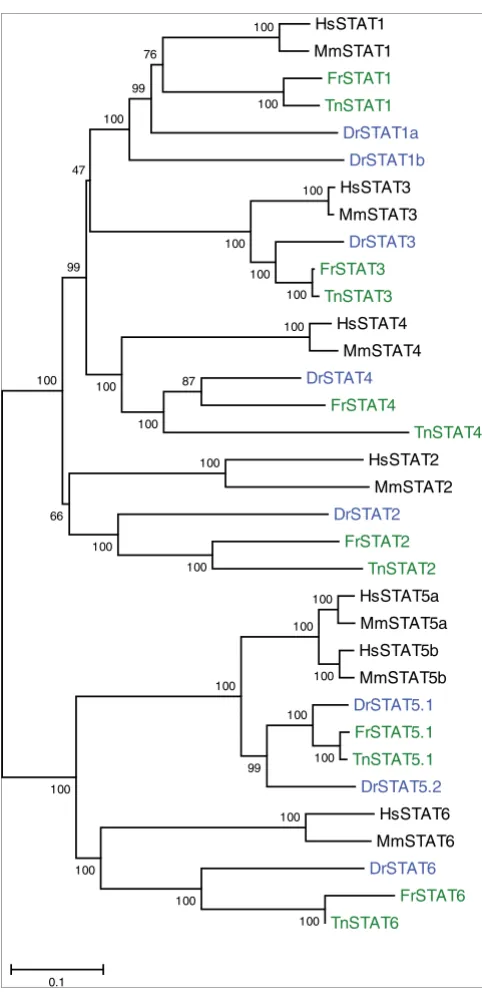
Signal transducers and activators of transcription
[image:6.612.54.295.81.582.2]
Mammalian Stat2, Stat3, Stat4, and Stat6 have clear
orthologs in all three fish species (Figure 5). Stat5 has been
independently duplicated in mammals and in zebrafish [21].
The group of Stat1 genes contains one gene from each
puffer-fish with a good match to mammalian Stat1, but two genes
from zebrafish that are surprisingly divergent but still
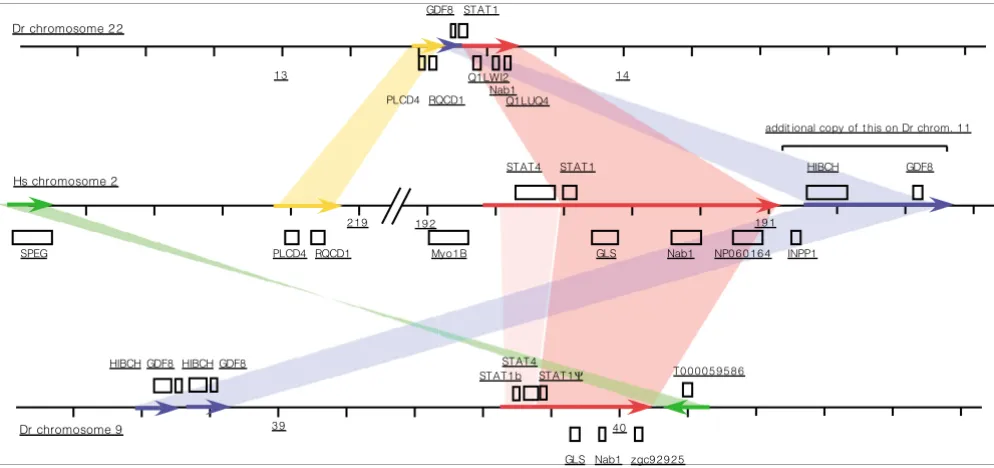
resem-ble Stat1 more than the other Stats. The duplication event that
led to this situation is recognizable in the genome, because
the whole region containing the gene is duplicated and
syn-tenic with the same region in human (Figure 7). The positions
of flanking genes in the human and zebrafish genome are
indications of a number of rearrangements. On chromosome
9 in the zebrafish these have been associated with a further
Phylogenetic tree of the STAT proteins
Figure 5
Phylogenetic tree of the STAT proteins. Details are as in Figure 2. STAT,
signal transducer and activator of transcription.
HsSTAT1
MmSTAT1
FrSTAT1
TnSTAT1
DrSTAT1a
DrSTAT1b
HsSTAT3
MmSTAT3
DrSTAT3
FrSTAT3
TnSTAT3
HsSTAT4
MmSTAT4
DrSTAT4
FrSTAT4
TnSTAT4
HsSTAT2
MmSTAT2
DrSTAT2
FrSTAT2
TnSTAT2
HsSTAT5a
MmSTAT5a
HsSTAT5b
MmSTAT5b
DrSTAT5.1
FrSTAT5.1
TnSTAT5.1
DrSTAT5.2
HsSTAT6
MmSTAT6
DrSTAT6
FrSTAT6
TnSTAT6
100
100
100
100
100
100
100
99
100
100
100
100
100
100
100
100
100
100
100
100
100
87
100
100
76
99
100
100
66
100
47
99
duplication of part of the Stat1 gene, resulting in a
pseudog-ene (ENSDARG00000040710; STAT1
Ψ
in Figure 7).
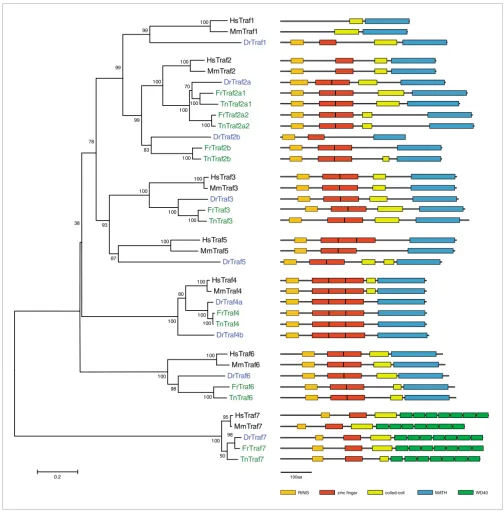
TNF-receptor associated factors
All of the Traf protein family members Traf1 to Traf7 are
rep-resented in fish (Figure 6). For Traf3, Traf6, and Traf7 we find
one gene in each of the three fish species, in all cases with the
[image:7.612.52.556.84.597.2]
same protein structure and a high degree of similarity. Traf1
and Traf5 are present in zebrafish, but no predictions exist for
these genes in the pufferfish genomes. It is interesting that
zebrafish Traf1 differs from mammalian Traf1 in that, like the
other family members, it contains a Ring finger and a zinc
fin-ger (Figure 6), indicating that the absence of these domains in
mammalian Traf1 is due to a loss that occurred specifically in
Phylogenetic tree of the TRAFs and diagrams of their protein domain structure
Figure 6
Phylogenetic tree of the TRAFs and diagrams of their protein domain structure. Details are as in Figure 2, except that the scale shows 0.2 amino acid
substitutions. TRAF, tumor necrosis factor receptor-associated factor.
98
HsTraf7
MmTraf7
DrTraf7
FrTraf7
TnTraf7
95
50
100
HsTraf4
MmTraf4
DrTraf4a
FrTraf4
TnTraf4
DrTraf4b
100
100
100
80
100
HsTraf6
MmTraf6
DrTraf6
FrTraf6
TnTraf6
100
100
98
100
DrTraf5
HsTraf5
MmTraf5
100
87
DrTraf1
HsTraf1
MmTraf1
100
99
99
HsTraf2
MmTraf2
DrTraf2a
FrTraf2a1
TnTraf2a1
FrTraf2a2
TnTraf2a2
DrTraf2b
FrTraf2b
TnTraf2b
100
100
100
100
70
100
100
83
99
78
HsTraf3
MmTraf3
DrTraf3
FrTraf3
TnTraf3
100
100
100
100
93
38
0.2
100aa
the mammalian lineage. Traf4 is duplicated only in zebrafish
[30], whereas there have been several duplication events in
the fish lineage for Traf2.
In summary, for the families described thus far, clear
orthol-ogies exist between the teleost and mammalian lineages, with
a few duplications for some of the gene family members.
Class II cytokines and their receptors
Class II cytokine receptors
Mammals have two distinct, heterodimeric receptors for type
I and type II IFNs, as well as a set of closely related receptors
for other class II helical cytokines. Although a large group of
this type is found in fish, there are no simple orthologies
between the receptors of this class in mammals and teleost
fish [16,17,31]. A previous analysis identified 11 genes in
Tetraodon
, named cytokine receptor family B (CRFB)1 to
CRFB11 [17]. The authors found that the genomic region
con-taining IFN-
α
receptor (IFNAR)chain 2, IL-10 receptor
(IL10R)chain 2, IFNAR1, and IFN-
γ
receptor (IFNGR)chain 2
in mammals is syntenic with a region containing six class II
cytokine receptor genes in
Tetraodon
[17] (see Figure 8).
However, sequence comparison allowed no clear assignment
of the fish genes to their mammalian counterparts, with the
exception of the genes encoding tissue factor (TF), which is
duplicated in
Tetraodon
(TF1 and TF2). A subsequent study
[31], which included all available sequences throughout the
animal kingdom, came to a slightly different conclusion
regarding the phylogenetic relationships. In this study the
authors subdivided the genes into groups encoding
ligand-binding and non-ligand-ligand-binding chains before conducting
their phylogenetic analysis. However, the justification for the
assignment of particular fish genes that have no clear
orthologs in mammals to one or other group is not obvious,
especially because no sequence data were given in this study
that unambiguously identify the genes analyzed. We
therefore revisited the phylogeny of class II cytokine
recep-tors in teleosts and mammals.
The family is defined by the presence of the D200 domain,
which consists of two immunoglobulin domain-like
sub-domains of the fibronectin type III class, SD100A and
SD100B. As has previously been pointed out [17], the
bioin-formatic identification of class II cytokine receptor genes is
not trivial, and it is therefore unsurprising that Ensembl [24]
contained predictions for only ten such genes in zebrafish.
Three of these do not encode class II cytokine receptors but
for thrombopoietin and titins, which have similar domains.
To identify further receptor genes we searched the zebrafish
genome and all available zebrafish ESTs for the subdomains
SD100A and SD100B (see Materials and methods, below).
We identified 22 candidates, of which seven had incomplete
D200 domains or exhibited only spurious resemblance to
D200 domains. These and the three genes encoding the
D200-containing proteins thrombopoietin and titin were
eliminated from further analysis. Gene predictions were
available for eight of the remaining 12 genes. Of the four genes
[image:8.612.57.554.86.320.2]
Synteny between regions containing STAT4 and STAT1 genes on human chromosome 2 and
Danio rerio
chromosomes 22 and 9
Figure 7
Synteny between regions containing STAT4 and STAT1 genes on human chromosome 2 and
Danio rerio
chromosomes 22 and 9. Genes transcribed on the
top or bottom strands are shown above and below the lines representing the chromosomes. Homologous regions are shown by colored arrows. A
further duplication of the region containing HIBCH and GDF8 is found on
Danio rerio
chromosome 11. Numbers represent nucleotide positions in the
genome in megabases based on the Zv6 assembly. Gene names are Swissprot, Zebrafish Information Network, or Ensembl identifiers.
1 9 1
1 9 2
HIBCH
GDF8
STAT4
STAT1
Nab1
NP0 6 0 1 6 4
INPP1
GLS
Myo1 B
SPEG
PLCD4
RQCD1
2 1 9
HIBCH GDF8
STAT4
STAT1 b
Nab1 zgc9 2 9 2 5
GLS
3 9
STAT1
Ψ
4 0
T0 0 0 0 5 9 5 8 6
HIBCH GDF8
RQCD1
PLCD4
1 3
1 4
GDF8
STAT1
Nab1
Q1 LUQ4
Q1 LWI2
addit ional copy of t his on Dr chrom. 1 1
Dr chromosome 2 2
Hs chromosome 2
that had not been predicted by automated annotation tools,
two (CRFB15 and CRFB16) were found only in the as yet
unplaced whole genome shotgun sequences. We re-annotated
all 12 genes using the known gene structure of class II
cytokine receptor genes and homology to known class II
receptor genes as support. We used these sequences for a
phy-logenetic analysis, which, in addition to the mouse and
human sequences, also included
Takifugu rubripes
and
Tetraodon nigroviridis
CRFB1 to CRFB11 and IL20R2, as
well as an additional gene, the product of which we shall call
CRFB13 (Ensembl: NEWSINFRUG00000164405 and
GSTENG0003154300). A set of recently described zebrafish
class II cytokine receptor genes included two genes not
iden-tified by us (DrCRFB2 and DrCRFB6), which we have added
to our analysis [18]. Finally, DrCRFB14 was found by Georges
Lutfalla, who generously contributed its sequence for
inclu-sion in this analysis.
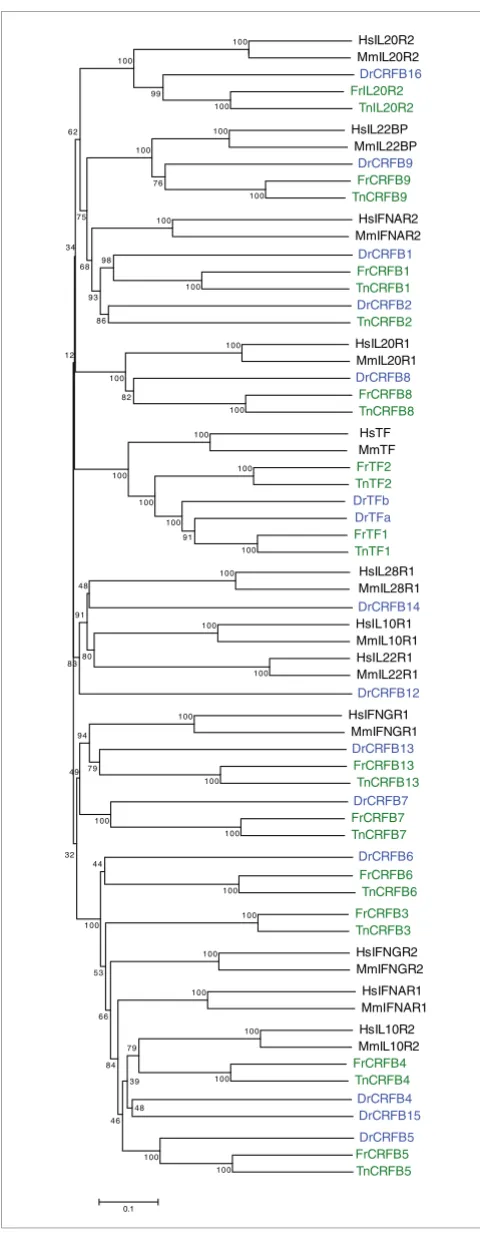
The phylogram of the class II cytokine receptors (Figure 9)
corroborates previous conclusions that this gene family has
undergone independent gene duplications and divergence in
teleost fish and mammals. Some of the fish genes cannot be
matched to likely orthologs in mammals, and
vice versa
, with
four exceptions in which high bootstrap values justify the
interpretation of the genes sharing direct common ancestors.
The genes encoding TF in mammals cluster with two genes
from each fish. The phylogeny indicates independent
duplica-tion events in the pufferfish and zebrafish lineage. The other
set of genes that reliably group together are those encoding
IL20R1, IL20R2, and IL-22 binding protein (IL22BP), with
one representative in each of the mammals and fish.
For the other relationships between mammalian and fish
genes the bootstrap values are so low that the relationships
discussed below must be considered with caution. Several
mammalian genes have no plausible orthologs in the three
fish genomes analyzed here, and others have more than one.
We therefore sought further evidence for evolutionary
rela-tionships by analyzing the genomic context of the genes. A
summary is shown in Figure 8. Two sets of genes are linked
both in mammals and in the two pufferfish. The first is the
IFNAR2, IL10R2, IFNAR1, and IFNGR2 complex and its
syntenic complex described by Lutfalla and colleagues [17] for
Tetraodon
. This synteny is also maintained in
Takifugu
and
[image:9.612.57.553.86.339.2]
in all three cases continues outside the class II cytokine
recep-Syntenic organization of classII cytokine receptor genes
Figure 8
Syntenic organization of classII cytokine receptor genes.
(a)
Diagram of the structures of the mammalian receptor chains, with the blue and green
rectangles representing the S100A and S100B domains, the red rectangle the intracellular domain of the ligand binding chains, and the gray rectangle the
intracellular domain of the non-ligand-binding chains and TF (after Renauld [57]).
(b)
Synteny between regions containing class II cytokine receptor genes
in mammals and fish. Fat horizontal lines indicate chromosomes in the four species. The brackets above the human genes show evolutionary relationships
between the paralogs. Vertical broken lines indicate suggested evolutionary relationships between the genes in the different species, based on the tree in
Figure 9. Color coding of names: red = long intracellular domain; black = short intracellular domain; blue = no intracellular domain; and pink =
intermediate length intracellular domain. Circled names indicate ligand binding chains. Round brackets denote groups of genes in cases where there are no
clear orthologous relationships of individual members with genes in the other species.
IL2 0 R2
IL1 0 R1
TF
IL2 8 R1
IL2 2 R1
IL2 0 R1
IL2 2 BP
IFNGR1
IFNAR2
IL1 0 R2
IFNAR1
IFNGR2
IL2 0 R2
TF2
TF1
CRFB8
CRFB9
CRFB1 3
CRFB7
CRFB1
CRFB2
CRFB3
CRFB4
CRFB5
CRFB6
Tn
IL2 0 R2
TF2
TF1
CRFB8
CRFB9
CRFB1 3
CRFB7
CRFB1
CRFB3
CRFB4
CRFB5
CRFB6
Fr
CRFB16
TFa
TFb
CRFB14
CRFB15
Hs
Dr
CRFB8
CRFB9
CRFB7
CRFB1
CRFB2
CRFB4
CRFB5
CRFB6
(a)
Structure of the mammalian receptor chains
(b)
Chromosomal organization
tor complex, in that the gene neighboring IFNGR2 is Tm50b
in all cases, followed by Nnp1. However, the corresponding
genes in the zebrafish are no longer linked (although they all
lie on the same chromosome).
The synteny is roughly reflected in the sequence similarities,
in that IFNAR2 is most similar to CRFB1 and CRFB2 and that
the IL10R2/IFNAR1/IFNGR2 group clusters with the
CRFB3/4/5/6/15 group. In particular, the IL10R2/IFNAR1/
IFNGR2 and CRFB3/4/5/6/15 genes encode receptors with
short cytoplasmic domains, whereas IFNAR2 and CRFB1 and
CRFB2 have long cytoplasmic tails. However, within the
group orthologies are not clear. It is therefore not possible to
conclude whether the ancestral complex that existed before
the split of the teleosts and tetrapods contained two genes (a
precursor for IFNAR2 and a precursor of the IL10R2/
IFNAR1/IFNGR2 group) with subsequent independent
duplications in teleosts and mammals, or four genes, with fast
divergence in the IL10R2/IFNAR1/IFNGR2 and the CRFB3/
4/5/6/15 groups obscuring their common origin.
The second region in which a syntenic arrangement of genes
is retained is the one containing IFNGR1, IL20R1 and IL22BP
in mammals, and CRFB9 and the previously undetected
CRFB13 in
Tetraodon
and
Takifugu
. Again, the closest
rela-tives of these genes (CRFB9 and CRFB13, respectively) are
not syntenic in zebrafish. Notably, fish CRFB9 proteins share
the absence of a transmembrane domain with the
mamma-lian IL22BPs. In view of this and the syntenic arrangement,
the most reasonable interpretation is a homology of IFNGR1/
CRFB13 and IL22BP/CRFB9.
In summary, teleost fish have approximately the same
number of class II cytokine receptors as mammals, but the
genes have evolved rapidly and independently since the
sepa-ration of the species. We shall leave the discussion at this
point, because the current set of data does not support further
speculation. A statement about which of these receptors are
functionally equivalent will have to await experimental
anal-ysis, as has been conducted for two of the zebrafish CRFBs
[18]. It will be interesting to determine whether fish
distin-guish between viral and bacterial induced IFN signaling
path-ways in the same way as mammals.
Class II cytokines
[image:10.612.54.294.82.701.2]
IFNs have been reported in several fish species with an
ambiguous nomenclature [32-40]. We find ten class II
cytokine genes in zebrafish, and five in each pufferfish (Figure
10). The large group of mammalian type I IFNs cluster
together on one branch of the phylogenetic tree that does not
include any fish cytokines. This fits with the view that the
gen-erally intronless type I IFN genes are the product of a
retro-transposition event [17], which occurred after the split of
teleosts and tetrapods. Apart from the clear fish orthologs of
the mammalian type II IFNs, the remaining fish class II
cytokines are more similar to the mammalian ILs and type III
Phylogenetic tree of the class II cytokine receptors
Figure 9
Phylogenetic tree of the class II cytokine receptors. Details are as in figure
2.
HsIL20R2
MmIL20R2
DrCRFB16
FrIL20R2
TnIL20R2
HsIL22BP
MmIL22BP
DrCRFB9
FrCRFB9
TnCRFB9
HsIFNAR2
MmIFNAR2
DrCRFB1
FrCRFB1
TnCRFB1
DrCRFB2
TnCRFB2
HsIL20R1
MmIL20R1
DrCRFB8
FrCRFB8
TnCRFB8
HsTF
MmTF
FrTF2
TnTF2
DrTFb
DrTFa
FrTF1
TnTF1
HsIL28R1
MmIL28R1
DrCRFB14
HsIL10R1
MmIL10R1
HsIL22R1
MmIL22R1
DrCRFB12
HsIFNGR1
MmIFNGR1
DrCRFB13
FrCRFB13
TnCRFB13
DrCRFB7
FrCRFB7
TnCRFB7
DrCRFB6
FrCRFB6
TnCRFB6
FrCRFB3
TnCRFB3
HsIFNGR2
MmIFNGR2
HsIFNAR1
MmIFNAR1
HsIL10R2
MmIL10R2
FrCRFB4
TnCRFB4
DrCRFB4
DrCRFB15
DrCRFB5
FrCRFB5
TnCRFB5
100
100
98
86
93
68
100
100
76
100
75
100
100
99
100
62
100
100
82
100
34
100
100
100
91
100
100
100
12
100
48
100
100
80
91
83
100
100
79
94
100
100
49
100
44
100
100
100
100
100
79
48
39
100
100
46
84
66
53
100
32
IFNs. Like these, they are mostly encoded by genes with four
phase 0 introns, supporting the view that this constitutes the
gene structure of the ancestral class II cytokine gene.
Among these class II cytokines, IL-10 exhibits an apparent
orthology between fish and mammals [41,42]. This is also
supported by the genomic locations of the IL-10 genes, which
are situated adjacent to and on the opposite strand of the
Mapkap2 genes in all five species (Figure 11). The genes that
had been annotated as IL-20 in the zebrafish (Refseq:
NP_001076424.1) and
Tetraodon
(Uniprot: Q7SX60), and
initially as IL-19 and then changed to IL-24 in
Takifugu
(Ensembl: SINFRUG00000154816) are equally related to
mammalian IL-19 and IL-20. The previous automated
nam-ing of the fish genes should therefore be amended. In
con-cordance with the nomenclature rules for vertebrate gene
families, this gene has therefore been given the next available
number in the IL series (IL-34). The fish IL-34 genes and the
mammalian IL-19, IL-20, and IL-24 genes are located in the
vicinity of the IL-10 genes (in the zebrafish this gene has not
yet been placed on a chromosome), but duplications and
inversions have broken up the syntenic relationships
down-stream of IL-10. The phylogenetic tree argues for a common
precursor for these genes that has duplicated in mammals,
yielding IL-19 and IL-20. Whether IL-24 is the product of a
second local duplication or of an older duplication of a larger
segment of the genome is not clear, but it shows a higher
degree of similarity to the class II cytokine genes found in a
complex on a different chromosome in all five species (Figure
11).
A second group of class II cytokines exhibiting high sequence
similarity are the mammalian IL-22, IL-24 and IL-26, and
two pufferfish interleukins annotated as 'IL-24' in
Tetraodon
(Uniprot: Q7SX82) and 'homologous to IL-24' in
Takifugu
(Ensembl: SINFRUG00000156387). Again, the phylogram
shows that this name is problematic, because if anything
these proteins are more similar to IL-22, and their genes
exhibit the same syntenic relation to the flanking MDM1 gene
as the IL-22 genes do in mammals (Figure 11). However, the
zebrafish gene in the same position (RefSeq:
NP_001018628), annotated as IL-22 [33], is highly divergent
in sequence. Because frequent duplications and loss of genes
as well as rapid sequence divergence appear to operate within
this family, originally orthologous genes may no longer be
recognizable. This is further illustrated by the flanking IL-26
gene in the human genome. The mouse genome has lost this
gene; in the zebrafish a class II cytokine gene described as
IL-26 [33] is present in this position, but it does not cluster with
the IL-22/24/26 group. Although the IL genes between
MDM1 and IFN-
γ
are in apparently orthologous positions in
all five species, there is no indication that the mammalian
arrangement MDM1/IL-22/IL-26/IFN-
γ
represents the
[image:11.612.54.296.82.695.2]
ancestral cluster, rather than the IL genes having arisen by
independent duplications in mammals and teleosts. Because
the names given to the fish cytokines of this group are
Phylogenetic tree for the classII cytokines
Figure 10
Phylogenetic tree for the classII cytokines. Details are as in Figure 2. See
text for gene names.
HsIFN
α
8
HsIFN
α
17
HsIFN
α
4
HsIFN
α
10
HsIFN
α
21
HsIFN
α
7
HsIFN
α
14
HsIFN
α
1
HsIFN
α
2
HsIFN
α
5
HsIFN
α
6
MmIFN
α
2
MmIFN
α
11
MmIFN
α
4
MmIFN
α
9
MmIFN
α
1
MmIFN
α
5
MmIFN
α
6
MmIFN
α
7
MmIFN
α
10
MmIFN
α
12
HsIFN
ω
HsIFN
κ
MmIFN
κ
HsIFN
ε
1
MmIFN
ε
1
HsIFN
β
MmIFN
β
DrIFN
φ
6
HsIFN
λ
1
HsIFN
λ
2
HsIFN
λ
3
MmIFN
λ
1
MmIFN
λ
3
MmIFN
λ
2
HsIL10
MmIL10
DrIL10
FrIL10
TnIL10
HsIL19
MmIL19
HsIL20
MmIL20
DrIL34
FrIL34
TnIL34
HsIL26
HsIL24
MmIL24
HsIL22
MmIL22
FrIL35
TnIL35
HsIFN
γ
MmIFN
γ
DrIFN
γ
1
DrIFN
γ
2
FrIFN
γ
TnIFNγ
DrIFN
φ
2
DrIFN
φ
3
DrIFN
φ
4
DrIFN
φ
1
FrIFNφ
TnIFN
φ
DrIFN
φ
5
extremely confusing and suggest relationships for which
there is no evidence, we again propose a new nomenclature,
as shown in Figures 10 and 11 (IFN-
ϕ
6 for zebrafish IL-22,
IFN-
ϕ
5 for zebrafish 26, and 35 for the pufferfish
IL-24).
Four of the remaining fish class II cytokine genes cluster with
the mammalian INF-
γ
genes and the rest do not group with
any of the mammalian genes. The pufferfish each have one
IFN-
γ
gene, whereas the zebrafish has two, namely IFN-
γ
1
and IFN-
γ
2 [33,34], which lie in tandem in a position in the
genome that has retained its synteny between mammals and
teleosts (Figure 11).
Finally, a group of teleost class II cytokines, some of which
had previously been called IFN-
λ
, cluster on a branch without
mammalian cytokines. Because they are not more related to
mammalian IFN-
λ
than to other cytokines, we call them
IFN-ϕ
1 to IFN-
ϕ
4. IFN-
ϕ
1 has previously been described as
'zebrafish interferon', 'IFNab', and 'IFN-
λ
' [17,18,32], and
IFN-
ϕ
2 and IFN-
ϕ
3 as 'type I IFN 2' and 'type I IFN 3' [43].
Only one gene of this type, most closely related to the
zebrafish IFN-
ϕ
1 gene, is found in the two pufferfish. This
may be due to the difficulty in identifying these genes, and it
would not be surprising if further class II cytokine genes were
found in the pufferfish genomes.
In summary, like the receptors, the class II cytokine genes
have duplicated and diverged independently in fish and
mammals. It remains to be tested experimentally which class
II cytokines are responsible for which immune function.
Intracellular pathogen sensors: the NACHT-domain
family
A large family of cytoplasmic proteins, characterized by the
presence of a nucleotide-binding domain, the NACHT
domain [44,45] or the closely related NB-ARC domain [46],
has been implicated in inflammation and innate immune
sig-naling in animals and plants. Some of them have been shown
to recognize intracellular pathogen-associated molecular
pat-terns through their carboxyl-terminal leucine-rich repeats
(LRRs). They differ in their amino-terminal effector domains
(for example, CARD or pyrin domains), which mediate signal
transduction to downstream targets, leading to the activation
of NF-
κ
B or the apoptotic pathway.
An initial search in the fish genomes for homologs of the
known mammalian NLR proteins of the Nod subfamily found
homologs for Nod3 and Nod9 in all three fish species: Nod2
in zebrafish and
Takifugu
, and Nod1 in
Takifugu
. Three
genes in zebrafish, two in
Takifugu
, and one in
Tetraodon
[image:12.612.55.554.87.302.2]
were annotated as 'Nalps' (NACHT, leucine rich repeat and
PYD containing proteins) but did not group with the
mamma-Genomic organization of two class II cytokine gene clusters
Figure 11
Genomic organization of two class II cytokine gene clusters. Chromosomes are shown as lines with the positions of the region marked in megabase pairs
underneath. Genes transcribed on the top strand are shown above the line, and those transcribed in the opposite direction are shown below. Class II
cytokine encoding genes are shaded in gray. In the left diagram the syntenic regions and duplications, and inversions surrounding the IL-10 locus are shaded
in red and blue. The human IL-10 gene is located on chromosome 1 and the region shows the same arrangement as in the mouse. The current zebrafish
genome assembly Zv7 does not yet contain the recently sequenced clone CU459075, which places IL-34 into the interval between IL-10 and prolargin
(IL-34 is included in Zv7 on the unplaced contig Zv7_NA1656). There are therefore no coordinates for the right end of the interval. The two pufferfish show
the same arrangement both for the region around IL-10 and for the MDM1/cytokine/IFN-
γ
region. The names for the fish genes are explained in the text.
IFN, interferon; IL, interleukin.
2 0 .3
mapkap2
Ikbke
prolargin
f ibromodulin
IL1 0
Dyrk3
Rassf 5
IL3 4
2 0 .5
8 .9 6 Mb
8 .8 6
mapkap2
Ikbke
IL1 0
Dyrk3
prolargin
f ibromodulin
IL3 4
1 3 3 .1
1 3 2 .7 Mb
mapkap2
Ikbke
IL1 0
Dyrk3
IL1 9
IL2 0 IL2 4
Rassf 5
1 3 5 .7
1 3 5 .8
prolargin
f ibromodulin
Dr chromosome 11
Mm chromosome 1
Tn chromosome 11 ( and Fr scaff _ 7 9 )
11 7 .9
Mb
IL2 2
IFN-g
MDM1
11 7 .5
1 9 .2 4 6
IL3 5
IFNg
MDM1
1 9 .2 6 0 Mb
1 4 .0 6
1 3 .9 9 Mb
IFN-phi6
IFNg2
MDM1
IFN-phi5
IFNg1
IL2 2
IFN-g
MDM1
6 7 .0 0
IL2 6
6 6 .8 0 Mb
Dr chromosome 4
Mm chromosome 1 0
lian Nalps on a phylogenetic tree. We found no homologs for
any of the mammalian Nalps in fish. We therefore screened
the whole zebrafish genome for sequences encoding
NACHT-domains. This revealed a large number of additional
sequences encoding NACHT domains. Most of these were not
within genes found by the automated gene prediction
algo-rithms, because the number of and similarity between the
genes was so high that they had been masked as repeats. We
therefore annotated these genes manually using ESTs as
guides and identified a large set of novel NACHT-domain
containing genes. After we had completed our initial
annota-tions, automated predictions for 205 NACHT-domain
encod-ing genes were deposited at the National Center for
Biotechnology Information (NCBI). These showed only a
par-tial overlap with our sequences. Many were incomplete or
contained two NACHT domains, indicating incorrect
annota-tions. We therefore re-screened and re-annotated the
zebrafish genome and have found more than 200 genes of this
class (the complete list is given in Additional data file 9).
These are numbered sequentially by chromosome number
and by their order on the chromosome. We have not been able
to produce perfect gene models for all of them. As discussed
below, they have novel amino-terminal sequences, and in the
absence of sufficient EST evidence we were unable in all cases
to draw reliable conclusions regarding the 5' end of the gene.
Similarly, the LRRs in the carboxyl-terminal region are
diffi-cult to predict reliably. Extensive experimental work will be
needed to characterize these genes. For our analysis here we
have selected a set of 70 representative sequences.
We also searched the two pufferfish genomes for members of
this gene family to find out whether the group we found in
zebrafish was specific to this species, or whether the massive
gene duplication had occurred early in the fish lineage. We
found 70 members of this family among the annotated genes
in the genome of
Takifugu rubripes
. A large number of
matches found in the
Tetraodon
genome were not parts of
[image:13.612.55.294.89.726.2]
predicted or annotated genes, as had been the case in the
zebrafish. Again, these sequences had been masked as
repeats. We manually assembled a set of sequences using
Figure 12
Hs
Mm
Dr
Fr
Tn
Nod1
Nod2
CIITA
Nod9
mammalian Nalp
Apaf 1
NACHT-P1
Ipaf
Nod3
Fr/ Tn expansion
Dr expansion
Fr expansion
Tn expansion
Fr/ Tn expansion
Overview of a phylogenetic tree of 277 NLR proteins
Figure 12
Overview of a phylogenetic tree of 277 NLR proteins. Each sequence is
assigned a background color to illustrate species relationships: pink =
human, yellow = mouse, blue = zebrafish, green =
Takifugu
, and turquoise
=
Tetraodon
. The 'canonical' proteins Nod1, Nod2, Nod3, Nod9, CIITA,
and Apaf, which show clear homologous relationships between the five
species, cluster at the top (rainbow colors). The mammalian Nalp proteins
cluster together (pink/yellow region). Each fish has a large group of
species-specific proteins (blue, green, and turquoise regions). In addition,
Takifugu
and
Tetraodon
share several apparently orthologous gene pairs
cat-Figure 13
(see legend on next page)
HsNod1
MmNod1
DrNod1
FrNod1
TnNod1
HsNod2
MmNod2
DrNod2
FrNod2
TnNod2
HsCIITA
MmCIITA
FrCIITA
TnCIITA
DrCIITA
HsIpaf
MmIpaf
HsNaip
MmNaip1
MmNaip6
HsApaf1
MmApaf1
DrApaf1
FrApaf1
TnApaf1
HsNACHT-P1
MmNACHT-P1
DrNACHT-P1
FrNACHT-P1
TnNACHT-P1
HsNod9
MmNod9
DrNod9
FrNod9
TnNod9
HsNod3
MmNod3
DrNod3
FrNod3
TnNod3
FrNACHT-P2
TnNACHT-P2
HsNalp10
MmNalp10
FrNACHT-P3a
FrNACHT-P3b
HsNalp6
MmNalp6
HsNalp1
MmNalp1
MmNalp1 like
MmNalp1c
HsNalp3
MmNalp3
HsNalp12
MmNalp12
HsNalp14
MmNalp14
HsNalp5
MmNalp5
HsNalp13
HsNalp8
HsNalp2
HsNalp7
MmNalp2
HsNalp11
HsNalp9
MmNalp9a
MmNalp9c
MmNalp9b
HsNalp4
MmNalp4b
MmNalp4d
MmNalp4f
MmNalp4a
MmNalp4c
MmNalp4e
MmNalp4e like
100
100
100
100
100
100
100
100
100
100
100
100
100
100
100
100
100
100
100
100
100
100
100
100
100
100
100
100
97
100
100
100
100
100
100
100
77
100
92
100
100
100
100
100
100
100
100
100
100
100
99
100
100
100
100
100
100
99
82
94
87
52
35
84
85
39
99
75
34
23
62
98
60
33
95
0.1
100aa
CARD
NB-ARC
NACHT
LRR
WD 40
PYD
[image:15.612.56.551.84.711.2]