International Journal of Emerging Technology and Advanced Engineering
Website: www.ijetae.com (ISSN 2250-2459,ISO 9001:2008 Certified Journal, Volume 4, Issue 5, May 2014)
748
PSO and PSO-BFO Based Tuning of PID Controller: A
Comparative Evaluation
Sapna Gupta
1, Rajeev Gupta
2Department of Electronics Engineering, University College of Engineering, Rajasthan Technical University, Rajasthan, India
Abstract—The aim of this paper is to study the tuning of a PID controller using swarm optimization techniques. In this paper, comparative performance of PSO and BF-PSO based PID controller is analyzed. PSO algorithm converges rapidly during the initial stages of a global search, but around global optimum, the search process slows down. In order to overcome this problem and to further enhance the performance of PSO, this paper implements a hybrid algorithm (BF-PSO) combining the features of Bacterial Foraging Optimization (BFO) and Particle Swarm Optimization (PSO) for tuning of PID controller. The simulation results show that the hybrid (BF-PSO) algorithm has less settling time and less overshoot than PSO algorithm. BF-PSO algorithm is better than Z-N tuning method and PSO in terms of set point tracking, simplicity, consistency, search and computational efficiency.
Keywords— BFO, BF-PSO, PID, PSO
I. INTRODUCTION
PID control is one of the most efficient and widely used feedback control strategy. This is due to its simplicity and satisfactory control performance. PID controller was introduced in 1910 and is widely used in oil refineries, chemical plants, and paper and pulp industry. Its use and popularity had grown particularly after the Ziegler–Nichols empirical tuning rules in 1942.
The optimally combined three terms functioning of PID controller can provide treatment for both transient and steady state responses. In fact, optimal control performance can only be achieved after identifying the finest set of three gains, that is, proportional gain (Kp), integral gain (Ki) and
derivative gain (Kd). Proportional gain reduces the
overshoot, integral gain reduces the steady state error and derivative gain makes the controller act faster. Many approaches have been reported in literature for tuning parameters of PID controller [1-2]. The conventional PID tuning techniques include Z–N, Cohen Coon, and relay feedback methods. The modern techniques are based on artificial intelligence techniques such as neural network, fuzzy logic and evolutionary computation.
In Zeigler-Nichols tuning method, ultimate gain and time period is calculated and from the above information, PID parameters are calculated.
But the calculated gains of PID controller may or mayn’t be optimal for practical purposes. Therefore, researchers have used evolutionary algorithms [3] and swarm optimization based techniques [4-6] for PID tuning. Out of many swarm optimization algorithms hybrid particle swarm optimization is one of the emerging algorithms because of its faster convergence and optimal results. This paper presents a comparative performance analysis of PSO and BF-PSO algorithms for optimal PID tuning of shell and tube heat exchanger system. The simulation results show that the hybrid (BF-PSO) algorithm is performs better than particle swarm optimization algorithm (PSO) algorithm in terms of time and frequency domain specifications.
II. PARTICLE SWARM OPTIMIZATION
Particle Swarm Optimization (PSO) is one of the stochastic optimization technique based on the movement and intelligence of swarms. PSO applies the concept of social interaction to problem solving. It uses a number of agents (particles) that constitute a swarm moving around in the search space looking for the best solution. Each particle is treated as a point in N-dimensional space which adjusts its “flying” according to its own flying experience as well as the flying experience of other particles. The position corresponding to best fitness is called pbest and overall best out of all the particles is called gbest. Initial position of
pbest and gbest are different. However using different directions of pbest and gbest all agents are gradually get close to the global optimum [7-8].
The modified velocity and position of each particle can be calculated using current velocity and the distance between
pbest
j g, andgbest
g as per the following equations 1
, , 1 1 , , 2 2 ,
t t t t
j g j g j g j g g j g
v wv c r pbest x c r gbest x
1 1
, , ,
t t t
j g j g j g
x
x
v
1, 2,...,
International Journal of Emerging Technology and Advanced Engineering
Website: www.ijetae.com (ISSN 2250-2459,ISO 9001:2008 Certified Journal, Volume 4, Issue 5, May 2014)
749
n
Number of particles in a swarmm
Number of components in swarmt
Number of iterations (generation),
t j g
v
gth component of velocity of particle j atiteration t
,
t j g
x
gth component of position of particle j atiteration t
j
pbest
pbest of particle jg
gbest
gbest of the group1
,
2c c
Cognitive and social acceleration factor1
,
2r r
Random numbers uniformly distributed in the range of (0,1)w
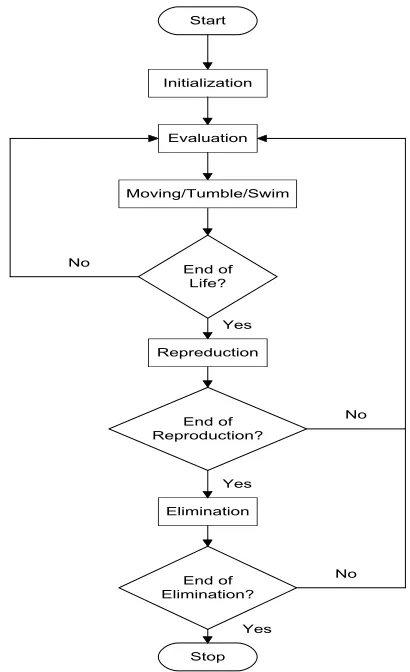
Inertia weight factor [image:2.612.340.545.279.615.2]The general flow chart of PSO is shown in figure 1.
Fig.1. Flow chart of Particle Swarm Optimization
III. BACTERIA FORAGING ALGORITHM
Bacteria foraging (BF) algorithm is one of the efficient population based stochastic search technique. The idea in this algorithm was adopted from biological and physical living behavior of E.coli bacteria existing in the human intestine.
[image:2.612.83.254.336.603.2]In principle, bacteria try to reach the nutrients and to avoid noxious materials and to find a way to exit the neutral and noxious nutrient environment. Therefore, understanding their behavior model helps engineers to use it for any nonlinear optimization problem. The foraging process of a bacterium, E.coli, living in the intestine, is modeled through four steps of chemotactic, swarming, reproduction, and elimination and dispersal. The BF algorithm is dependent on random direction which slows down the optimal solution process. Therefore, particle swarm optimization (PSO) algorithm is used to solve this drawback. So BF-PSO algorithm is used.
Fig. 2. Flow chart of Bacteria Foraging Algorithm
IV. BACTERIA FORAGING-PARTICLE SWARM
OPTIMIZATION ALGORITHM
International Journal of Emerging Technology and Advanced Engineering
Website: www.ijetae.com (ISSN 2250-2459,ISO 9001:2008 Certified Journal, Volume 4, Issue 5, May 2014)
750
Random direction may lead to delay in reaching the global solution. In "BF-PSO" algorithm the unit length random direction of tumble behavior can be decided by the global best position and the best position of each bacterium. Where pbest is the best position of each bacterium and gbest is the global best bacterium.
During chemotaxis loop, tumble direction is updated by
j 1
w
j c pbest1
pcurrent
c rand gbest2
pcurrent
A. Pseudo Code for BF-PSO [9]
1. Initialization
a.
P
dimension of search spaceb.
S
total number of bacteria in population c.N
c number of chemotactic steps d.N
sswimming lengthN
c
N
se.
N
re number of reproduction steps f.N
ednumber of elimination-dispersalevent
g.
P
ed probability of elimination-dispersal h.
i is location of ith bacteriumi.
C i
size of steps taken by random directionj.
c c w
1,
2, ,
PSO parameters 2. Elimination-dispersal loopl
l
1
3. Reproduction loop
k
k
1
4. Chemotaxis loop
j
j
1
for
i
1, 2
S
(take a chemomatic step for bacterium as follows)a. Tumble using
j 1
w
j c pbest1
pcurrent
c rand gbest2
pcurrent
S1:
1, ,
, ,
i i
j
k l
j k l
C i
j
b. Computer Objective function (Obj) c. Swim
i.
m
0
for swim counter ii. Whilem
N
s1. Let
m
m
1
2. If
,
1, ,
lastObj i j
k l
Obj
Update S1
end if loop
end while loop
Go to “a” for next bacterium (i+1) if
i
S
5. If
j
N
c, go to step 46. Reproduction
7. If
k
N
re, go to step 3 8. Elimination-Dispersal 9. EndB. BF-PSO based PID Tuning
In BF-PSO tuning of PID controller, optimal value of [kp, ki and kd] are obtained which exhibits less overshoot,
has a moderate level of settling time, low rise time and zero steady state error. The objective function of BF- PSO consists of these terms and minimizes the objective function.
Objective function of BF-PSO considered in this paper is
, ,
min
1
p i d p ss s r
K K K
W K
e
M
e
e
t
t
Subject to,
max
0
K
p
K
pmax
0
K
i
K
imax
0
K
i
K
i
is weighing factor,M
p is peak overshoot,e
ssis steady state error,t
s is settling time andt
r is rise time.max
,
max,
maxp i d
K
K
K
are maximum values of,
,
p i d
International Journal of Emerging Technology and Advanced Engineering
Website: www.ijetae.com (ISSN 2250-2459,ISO 9001:2008 Certified Journal, Volume 4, Issue 5, May 2014)
751
V. FEEDBACK CONTROL OF HEAT EXCHANGER SYSTEM
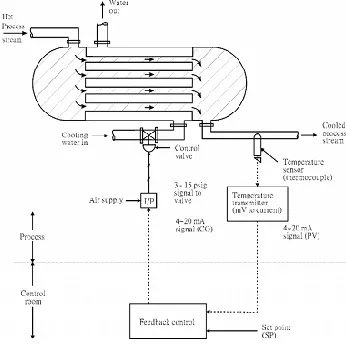
Heat exchanger is one of the most widely used equipment in chemical industry which performs mass transfer and heat transfer operations. The primary objective of the heat exchanger system is to maintain the outlet temperature to a desired temperature. To achieve the above mentioned control objective, feedback control is used. In feedback control, the steam flow is termed as manipulated variable, whereas input flow change can be termed as flow disturbances.
Fig.3. Schematic of shell and tube heat exchnager system
[image:4.612.79.252.266.441.2]Figure 3 illustrates the schematic diagram of shell and tube heat exchanger system. The control block diagram of shell and tube heat exchanger is shown in figure 4.
Fig. 4 PID control of shell and tube heat exchnager system
A. Linearized Modelling of Shell and Tube Heat Exchanger
The first task of controller design is to develop a mathematical model of the system. This section develops a linearized transfer function model of the shell and tube heat exchanger system.
To develop the experimental model, the experimental data is considered which is reported in [10,11]. From the experimental data, following model is developed.
Transfer function of process is considered as
25
( )
90
33
1
s p
Y s
e
G s
T s
s
s
Transfer function of inlet flow disturbance is considered as,
1
( )
30
1
d
Y s
G s
D s
s
Transfer function of sensor is considered as
0.16
10
1
h
Y s
G
s
B s
s
The complete transfer function can be represented as
1 1
c p d
c p h c p h
G s G s G s
Y s R s D s
G s G s G s G s G s G s
The stability of the mathematical model is evaluated using bode plot which is shown in figure 5. From the calculated gain and phase margin it is found out that the system is a stable system.
-80 -60 -40 -20 0 20
M
a
g
n
itu
d
e
(
d
B
)
10-3 10-2 10-1 100 101
-720 -540 -360 -180 0
P
h
a
s
e
(
d
e
g
)
Bode Diagram
Gm = 16.9 dB (at 0.579 rad/s) , Pm = 70.1 deg (at 0.149 rad/s)
Frequency (rad/s)
Fig. 5. Stability of system
[image:4.612.336.555.478.675.2] [image:4.612.57.294.502.599.2]International Journal of Emerging Technology and Advanced Engineering
Website: www.ijetae.com (ISSN 2250-2459,ISO 9001:2008 Certified Journal, Volume 4, Issue 5, May 2014)
752
VI. SIMULATION RESULTS
A controller has two main objectives, i.e set point tracking and disturabnce rejection. Unit step function is provided to the system to test the above mentioned objectives. Simulation results in figure 6 shows the set point tracking feature of the PID controller. In set point tracking objective, the PID controller exhibits a peak overshoot of 17%, settling time of 84.9 sec and zero steady state error.
0 50 100 150 200 250 300 350 400 450 500
0 0.2 0.4 0.6 0.8 1 1.2
Time->
A
m
p
lit
u
d
e
->
[image:5.612.334.543.139.310.2]Unit step response of PID controller
Fig.6. Unit step response of system using PID controller tuned using Z-N Method exhibiting set point tracking featue
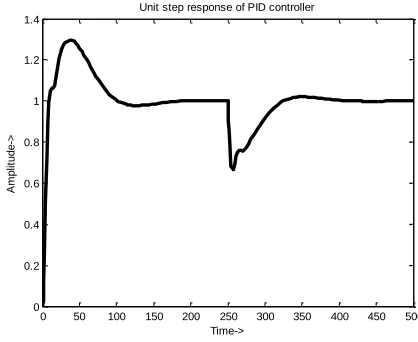
To test the load disturbance objective of PID controller, two kinds of loads are used i.e step disturbance and pulse disturbance. The unit step response of PID controller compensating the step load disturbance at 250 sec is shown in figure 7. In this case, the PID controller has slightly high peak overshoot of 29.56%. The unit step response of PID controller compensating the pulse load disturbance of 50% duty cycle originating from 250 sec is shown in figure 8. In this case, the PID controller has slightly high peak overshoot of 34.72%.
0 50 100 150 200 250 300 350 400 450 500
0 0.2 0.4 0.6 0.8 1 1.2 1.4
Time->
A
m
p
lit
u
d
e
->
Unit step response of PID controller
Fig. 7 Unit step response of system using PID controller tuned using Z-N Method compensating for step disturbance
0 50 100 150 200 250 300 350 400 450 500
-0.2 0 0.2 0.4 0.6 0.8 1 1.2 1.4
Unit step response of PID controller
A
m
p
lit
u
d
e
->
[image:5.612.59.290.252.421.2]Time->
Fig. 8. Unit step response of system using PID controller tuned using Z-N Method compensating for pulse disturbance
[image:5.612.333.545.337.511.2]International Journal of Emerging Technology and Advanced Engineering
Website: www.ijetae.com (ISSN 2250-2459,ISO 9001:2008 Certified Journal, Volume 4, Issue 5, May 2014)
753
TABLE 1
PIDCONTROLLER TRANSIENT PERFORMANCE
Controller Overshoot Settling Time PID (Pulse disturbance rejection) 34.72% 453.14 sec
PID (Step disturbance rejection) 29.56% 307.248 sec
PID (Set point tracking) 17% 86.04 sec
To qualitatively analyze controller performance, different error indices are used. Widely used error indices are
0IAE
e t dt
,
0
ITAE
t e t dt
,
20
ISE
e
t dt
and 2
0
ITSE
te
t dt
Table II indicates error indices of set point tracking, step disturbance and pulse disturbance rejection.
TABLE 2 ERROR INDICES
Controller IAE ISE ITAE ITSE PID (Pulse disturbance rejection) 7.67 0.42 1346 36.09
PID (Step disturbance rejection) 5.89 0.31 709.4 18.4
PID (Set point tracking) 3.93 0.31 131.8 3.98
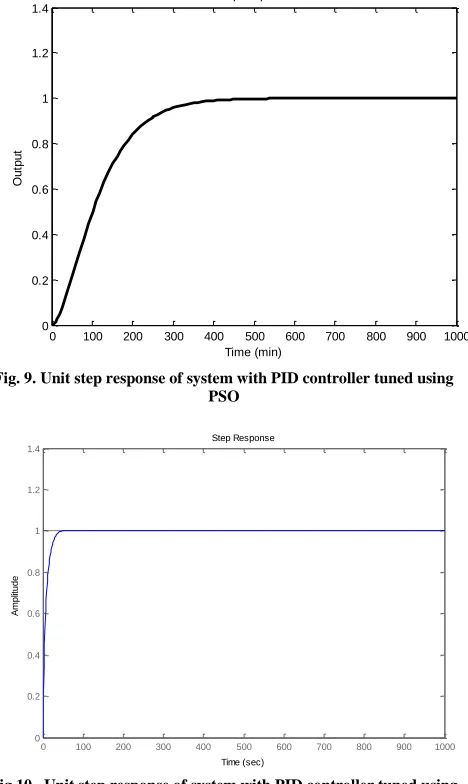
Due to high overshoot of PID controller tuned using Z-N method, PSO and BF-PSO is used. Tuning of PID using PSO and BF- PSO is described in section IV. The set point tracking feature of PSO tuned PID controller and BF-PSO tuned PID controller is shown in figure 9 and figure 10 respecively. The transient behavior of Z-N tuned PID, PSO and BF-PSO is tabulated in Table III.
TABLE 3
PID,PSO AND BF-PSOTUNED PIDCONTROLLER TRANSIENT
PERFORMANCE
Controller % Overshoot Settling Time PID (Z-N) 17% 86.04 sec
PID (PSO) 0% 206 sec
PID (BF-PSO) 0.19% 33.2 sec
0 100 200 300 400 500 600 700 800 900 1000 0
0.2 0.4 0.6 0.8 1 1.2 1.4
Step response
Time (min)
O
u
tp
u
[image:6.612.332.566.146.538.2]t
Fig. 9. Unit step response of system with PID controller tuned using PSO
Step Response
Time (sec)
A
m
p
lit
u
d
e
0 100 200 300 400 500 600 700 800 900 1000 0
0.2 0.4 0.6 0.8 1 1.2 1.4
Fig.10. Unit step response of system with PID controller tuned using BF-PSO
TABLE 4
COMPARISON BETWEEN TRADITIONAL PID CONTROLLER,PSO AND
BF-PSOTUNED PIDCONTROLLER
Controller Kp Ki Kd
PID (Z-N Tuning) 10 0.38 150
PID (PSO Tuning) 0.0788 0.0099 0.0058
International Journal of Emerging Technology and Advanced Engineering
Website: www.ijetae.com (ISSN 2250-2459,ISO 9001:2008 Certified Journal, Volume 4, Issue 5, May 2014)
754
Table V. indicates error indices of PID controller using Z-N tuning, PSO and BF-PSO algorithm.
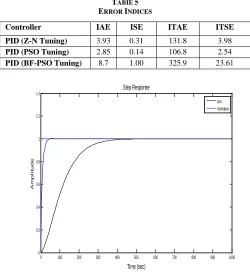
TABIE 5 ERROR INDICES
Controller IAE ISE ITAE ITSE
PID (Z-N Tuning) 3.93 0.31 131.8 3.98
PID (PSO Tuning) 2.85 0.14 106.8 2.54
PID (BF-PSO Tuning) 8.7 1.00 325.9 23.61
0 100 200 300 400 500 600 700 800 900 1000
0 0.2 0.4 0.6 0.8 1 1.2 1.4
Step Response
Time (sec)
A
m
p
li
tu
d
e
pso hybridpso
Fig.11. Unit step response of system with PID controller tuned using PSO and BF- PSO
Fig. 11 shows the comparative performance of PSO and BF-PSO for tuning of PID controller to control the outlet temperature of shell and tube heat exchanger system.
From the above simulation results it is evident that the PID controller tuned using different evolutionary techniques such as PSO and BF-PSO outperform the conventional tuning methods.
VII. CONCLUSIONS
Temperature control of heat exchanger using PID controller has been discussed in this paper. The controller is tuned using various conventional and evolutionary tuning methods like Z-N tuning, PSO and BF- PSO tuning.
Extensive simulation results and analysis proves that in BF-PSO tuned PID controller, the overshoot is less than the Z-N tuning method but somewhat higher than the PSO algorithm and settling time of BF-PSO tuned PID controller is less than both Z-N tuning method and PSO algorithm i.e 33.12 sec. Hence it is proved that BF-PSO algorithm is better than Z-N tuning method and PSO in terms of set point tracking, simplicity, consistency, search and computational efficiency.
REFERENCES
[1] Fernando G. Martins, “Tuning PID Controllers Using the ITAE Criterion,” Int. J. Engg. Edu., vol. 21, no. 5, pp. 867, 2005.
[2] G.K.I. Mann, B. G. Hu and R.G Gosine, “Time-Domain Based Design and Analysis of New PID Tuning Rules,” IEEE Proc. Control Theory Appl., vol. 148, no. 3, 2001, pp.251-261.
[3] Daniel Carmona Morales, Jorge E Jimenez-Hornero, Francisco Vazquez and Fernando Morilla, “Educational tools for optimal controller tuning using evolutionary strategies,” IEEE Trans. Edu., vol. 55, no. 1, pp. 48-57, February 2012.
[4] Zwe-Lee Gaing, “A particle swarm optimization approach for optimum design of PID controller in AVR system,” IEEE Trans. Energy Convers., vol. 19, no. 2, pp. 384-391, June 2004.
[5] Chih-Cheng Kao, Chin-Wen Chuang, Rong-Fong Fung, “The self-tuning PID control in a slider-crank mechanism system by applying particle swarm optimization approach,” Mechatronics, 16, pp. 513 – 522, 2006.
[6] Tae-Hyoung Kim, Ichiro Maruta and Toshiharu Sugie, “Robust PID controller tuning based on constrained particle swarm optimization,” Automatica, 44, pp. 1104-1110, 2008.
[7] J Sun, B Feng, W. B. Xu, “Particle swarm optimization with particles having quantum behavior,” in Proc. of 2004 Congress on Evolution Computation, pp.325-331, 2004.
[8] Russel C Eberhart and Yuhui Shi, “Comparison between genetic algorithms and particle swarm optimization,” in Proc. IEEE Int. Conf. Evol. Comput., pp. 611–616, 1998.
[9] B Nagraj, P. Vijayakumar, “Tuning of a PID controller using soft computing methodolgoies applied to moisture control in paper machine,” Intelligent Automation and Soft Computing, vol. 18, no. 4, pp. 399-411, 2012.
[10] Subhransu Padhee, Yaduvir Singh, “A comparative analysis of various control strategies implemented on heat exchanger system: A case study,” in Proc. World Congress of Engineering, Jul 2010, pp. 873-877.
[image:7.612.43.293.166.439.2]