Abstract-- This paper describes optimal sizing of FACTS devices based on Particle Swarm Optimization for minimization of transmission loss considering voltage profile and cost function. Particle Swarm Optimization (PSO) is one of the artificial intelligent search approaches which have the potential in solving such a problem. In this study one of FACTS devices is used as a scheme for transmission loss. For this study, static var compensator (SVC) is chosen as the compensation device. The effect of population size during the optimization process towards achieving the solution is also investigated. Validation through the implementation on the IEEE 30-bus RTS indicated that PSO is feasible to achieve the task.
Index Terms— FACTS devices, optimal sizing, Particle Swarm Optimization, transmission loss, minimization, static var compensator.
I. INTRODUCTION
In recent years, the greater demand have been placed on the transmission network, and these demands will be continue to increase because of the increasing number of nonutility generators and heightened competition among utilities themselves [1]. This problem it is very difficult to acquire new rights of way. One of alternative is by using flexible alternating current transmission system (FACTS). The FACTS is a concept proposed by N.G. Hingorani [1] a well-known term for higher controllability in power systems by means of power electronics devices. FACTS devices can be provide benefits in increasing system transmission capacity and power flow control flexibility and rapidity [2].
Population based, cooperative and competitive stochastic search algorithms very popular in the recent year in the
Optimal locations of different types of FACTS devices in the power system has been attempted using different Evolutionary Programming (EP) techniques such as Hybrid Tabu Search and Simulated Annealing (TS/SA), Genetic Algorithm (GA), Repetitive Power Flow method (RPF), Bee Algorithms and Fuzzy decision making and PSO. The maximum increase in system loadability is achieved by GA and PSO techniques with an optimal numbers of five TCSCs devices in the system. From the results it is shown that TCSC device has improved the line flows even to their thermal limits
[3]. With multitype FACTS devices installed; the reduction in total generator of fuel cost is more than the individual installed FACTS devices [4]. The hybrid TS/SA converges at a faster computation time. In [5], BA does not require external parameters such as cross over rate and mutation rate. BA gives better result in terms of speed of optimizations and accuracy of the results. BA needs the large number of trials. On the other hand, GA based approach is proposed to determine the suitable types of FACTS devices and evaluate the total costs system [6]. EP in [7] is used to identify the location of four FACTS devices. Optimal Power Flow using GA can also used to obtain the optimal locations of SVC. The results shown that this method can be used to minimize the total cost function, including generations cost of power plants and investments costs [8]. In [9], GA and PSO are used to optimize the parameters of TCSC. However, PSO have more advantageous than that of GA. PSO gives a better balanced mechanism and better variation to the global and local exploration abilities. Moreover, it can be applied to solve various optimization problems in power system such as power system stability enhancement and capacitor placement problems [10].
In this paper, PSO technique is proposed to optimize the sizing of FACTS devices in order to minimize the transmission loss in the system. The SVC is chosen as the device for compensation and modeled as a reactive source added at the bus. Placement of SVC is done empirically as the pilot study. Computer simulations were done on the IEEE 30-bus RTS. The effect of population size on loss reduction is also investigated.
II. MATERIAL AND METHODS
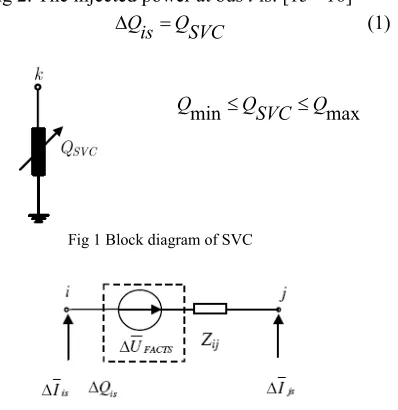
lexible AC Transmission Systems (FACTS) devices have several types namely: thyristor controlled static compensator (TCSC), static var compensator (SVC), thyristor controlled phase shifter transformer (TCPST), unified power flow controller (UPFC) and static compensator (STATCOM) [11-12]. The SVC is a shunt type FACTS device defined as a shunt connected static var generator or absorber whose output is adjusted to exchange capacitive or inductive current so as to maintain or control specific parameters of the power system, typically the bus voltage [13]. The SVC can inject or absorb its reactive power (QSVC) at a chosen bus. It injects reactive power into the system QSVC < 0 and absorbs reactive power from the system if QSVC > 0 [14]. The working range of SVC is between -100MVar and 100MVar [2]. The SVC is modeled
PSO Based Technique for Loss Minimization
Considering Voltage Profile and Cost Function
S.A. Jumaat, Ismail Musirin,
IEEE,
Muhammad Murtadha Othman
, IEEE,
and
Hazlie Mokhlis
, IEEE
F
as a generator or absorber of reactive power as shown in Fig 1. It is modeled as an ideal reactive power injection at bus i, as shown in Fig 2. The injected power at bus i is: [15 - 16]
[image:2.612.94.293.92.297.2]Fig 1 Block diagram of SVC
Fig 2 Mathematical model of SVC
A. Cost of Installation
The cost of installation of SVC devices has been mathematically formulated and given by the following equation [2, 12]:
. (2) 1000 S SVC C
IC= × ×
Where
IC = the installation cost SVC devices in [US$], CSVC = the cost of SVC devices in [US$/KVar]
Installation of SVC device can be calculated using the cost function given by [2, 6, 15].
(4) 1 2 (3) /KVar] 127.38[US$ 0.3051S 2 0.0003S | Q |Q S SVC C − = + − = where
S = operating range of SVC in [MVar]
Q1= reactive power flow through the branch before SVC
installation.
Q2= reactive power flow through the branch after SVC
installation.
III. PARTICLE SWARM OPTIMIZATION (PSO)
PSO algorithm originally is developed by Kennedy and Eberhart based on the social behaviors of animal swarms (e.g. bird blocks and fish schools) [17]. The PSO provides a population-based search procedure in which individuals called particles and changes their positions. The position of each particle is presented in X-Y plane. Each particle moves to the new position using velocity according to its own experience
called as Pbest. Gbest is the overall best value obtained so far by
any particle in the population. By time to time, the PSO consists of velocity changes of each particle towards its Pbest
and Gbest[18-19].
Each particle tries to modify its current position and velocity according to the distance between its current position and Pbest, and the current position and Gbest. After finding the
best values the particle updates its velocity and position. Velocity of each particle can be modified by equation (5) [2, 3, 20].
( )
5 ) ( 2 2 ) ( 1 1 1 k i s i best G rand c k i s i best P rand c v w k i v − × × + − × × + × = + where iteration. current the to up particle by the found position overall best iteration current the to up th -i particle of position best iteration at particle of position current k i s 1 and 0 between number random 2 rand and 1 rand 2 to equal both t coefficien weight 2 c and 1 c function weight iterations at particle of velocity 1 = = = = = = = + best best G P k i w k i v ιWeight function is given by (6) [2, 3, 14, 20]
. (6) max min max
max iter iter
w w w
w= − − ×
where number. iteration current and number, iteration maximum max 0.4 to equal weight initial min 0.9 to equal weight initial max = = = = iter iter w w
The new position can be modified (7)
. (7) 1
1= − +
+ k i v k i s k i s
The general flowchart of PSO is shown in Fig. 1 [10].
IV TEST RESULTS
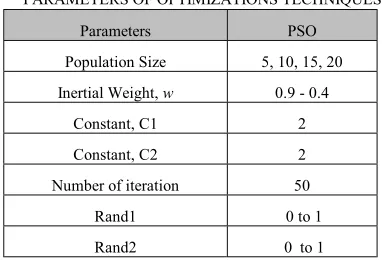
In order to realize the effectiveness of the proposed PSO technique, the IEEE 30-bus RTS was tested to find the optimal sizing of SVC. The line data and the bus data of the IEEE 30-bus RTS are given in [12]. The parameters of the optimization algorithm are listed in Table 1 [2, 3, 14, 20].
max min QSVC Q
Q ≤ ≤
The 5th International Power Engineering and Optimization Conf. (PEOCO2011), Shah Alam, Selangor, MALAYSIA: 6-7 June 2011
No
[image:3.612.85.253.78.396.2]Yes
[image:3.612.116.568.83.381.2]Fig. 2 A General Flowchart of Particle Swarm Optimization TABLE I
PARAMETERS OF OPTIMIZATIONS TECHNIQUES
Parameters PSO
Population Size 5, 10, 15, 20 Inertial Weight, w 0.9 - 0.4
Constant, C1 2
Constant, C2 2
Number of iteration 50
Rand1 0 to 1
Rand2 0 to 1
The SVC installations in the transmission system to improve the transmission loss in the system have been conducted at several load conditions subjected to buses 9, 17 and 24. The impact of population size to the optimization performance was also monitored so that the best population size can be identified from the simulations.
A. Transmission Loss and Voltage Profile with SVC Installations.
[image:3.612.271.570.83.372.2]Results for transmission loss reduction when load buses i.e. buses 9, 17 and 24 are subjected to load variation are shown in Table 2, 3 and 4. The results for the sizing of SVC to achieve loss reduction at several loading conditions can be referred to the same table. For instance, at loading condition is 70MVar the transmission loss has been reduced from 18.2654MW to 17.6188MW.
TABLE 2
TRANSMISSION LOSS REDUCTION LOAD VARIATION AT BUS 9.
In order to achieve this, the sizing of SVCs are -37.4615MVar 14.3503MVar and 22.3326MVar as indicated in the Table 2. From Table 2 it is observed that the value of transmission losses is decreased and the cost of installation is increased accordingly as the reactive power loading is increased. It is also shown that, with the installation of SVC the transmission loss of the bus for all loading condition have been reduced significantly as shown in Fig 3. The results for the transmission loss reduction and voltage profile improvement at several loading conditions variation is subjected to bus 9. Figure 4 illustrates the voltage profile at bus 9 when load at this bus is gradually increased. It is pretty obvious that, with the installation of SVC optimized using PSO, the voltage is improved at all loading conditions.
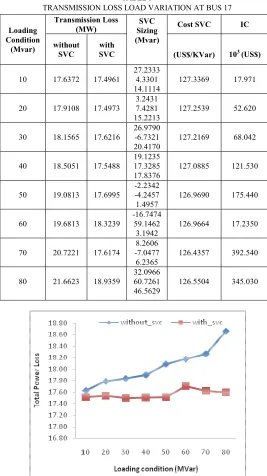
The sizing of SVCs to achieve loss reduction when the load is subjected to bus 17 can be referred to Table 3. For instance, at loading condition of 70MVar the transmission loss has been reduced from 20.7221MW to 17.6174MW. In order to achieve this, the sizing of SVCs are 8.2606MVar, -7.0477MVar, and 6.2365MVar as indicated in the table. From Table 3 it is observed that the value of transmission losses is decreased and the cost of installation is increased accordingly as the reactive power loading is increased. It is also shown that, with the installation of SVC the transmission loss of the bus for all loading conditions have been reduced significantly as shown in Fig 5. Fig 6 illustrates the voltage profile at bus 17 when load at this bus is gradually increased. It is pretty obvious that, with the installation of SVC optimized using PSO; the voltage is improved at all loading conditions.
Loading Condition
(Mvar)
Transmission Loss
(MW) SVC
sizing (MVar)
Cost SVC IC
without
SVC with SVC (US$/KVar) 103 (US$)
10 17.6292 17.5091
-11.4131 9.6018 13.3722
127.3434 15.297
20 17.7889 17.5365
44.3900 13.7469
9.2735
127.3030 32.128
30 17.8398 17.4964
6.3383 4.4443 13.5235
127.2752 43.712
40 17.9024 17.5085
46.4236 3.5552 9.8267
127.2599 50.130
50 18.0871 17.5107
55.8046 4.1166 17.4648
127.2042 73.319
60 18.1748 17.7035
51.8879 -20.1158
13.4827
127.2363 59.964
70 18.2654 17.6188
-37.4615 14.3503 22.3326
127.1828 82.240
80 18.6583 17.5968
32.2160 -12.0845
12.5587
127.0565 134.880 Start
Generation on initial condition of each particle
Evaluation of searching point of each particle
Checks and update Pbestand Gbest
Update each individual velocity and position
Reach maximum
iteration
[image:3.612.79.270.420.550.2]TABLE 3
[image:4.612.323.558.90.399.2]TRANSMISSION LOSS LOAD VARIATION AT BUS 17
Fig 3 Results for transmission loss reduction load variation at bus 9 with and without SVC
. Fig 4 : Results of voltage profile improvement at bus 9 with and without SVC
[image:4.612.329.558.251.395.2]Fig 5: Results for transmission loss reduction load variation at bus 17 with and without SVC.
Fig 6: Results of voltage profile improvement at bus 17 with and without SVC
The sizing of SVCs to achieve loss reduction when load variation is subjected to bus 24 can be referred to Table 4. For instance, at loading condition of 70MVar the transmission loss has been reduced from 24.4930MW to 18.5055MW. In order to achieve this, the sizing of SVCs are -27.8060MVar, 60.2440MVar and 7.6894MVar as indicated in the table. From Table 4 it is observed that the value of transmission losses is decreased and the cost of installation is increased accordingly as the reactive power loading is increased. It is also shown that, with the installation of SVC the transmission loss of the bus for all loading condition have been improved significantly as shown in Fig 7. The results for the transmission loss reduction and voltage profile improvement at several loading condition variation is subjected to bus 24. Fig 8 illustrates the voltage profile at bus 24 when load at this bus is gradually increased.
B. The Effect of Population Size to Optimization Performance
The results for effect of population size to transmission loss reduction are tabulated in Table 5, and 6. Table 5 tabulates the effect of population size to transmission loss when the reactive power loading variation is subjected to bus 17. From the table, it is observed that the transmission loss increased accordingly as the restive power loading is increased. Large population Loading
Condition (Mvar)
Transmission Loss (MW)
SVC Sizing (Mvar)
Cost SVC IC
without SVC
with
SVC 103 (US$)
(US$/KVar)
10 17.6372 17.4961 27.2333
4.3301 14.1114
127.3369 17.971
20 17.9108 17.4973 3.2431 7.4281 15.2213
127.2539 52.620
30 18.1565 17.6216 26.9790 -6.7321 20.4170
127.2169 68.042
40 18.5051 17.5488 19.1235 17.3285 17.8376
127.0885 121.530
50 19.0813 17.6995 -2.2342 -4.2457
1.4957
126.9690 175.440
60 19.6813 18.3239 -16.7474
59.1462 3.1942
126.9664 17.2350
70 20.7221 17.6174 8.2606 -7.0477
6.2365
126.4357 392.540
80 21.6623 18.9359 32.0966 60.7261 46.5629
[image:4.612.56.290.573.710.2]The 5th International Power Engineering and Optimization Conf. (PEOCO2011), Shah Alam, Selangor, MALAYSIA: 6-7 June 2011
size gives the lowest transmission loss reduction in the system, and vice versa. For instance at Qd17 = 50MVar the losses
[image:5.612.43.329.208.495.2]value is 17.6995 MW for population size of 5, while the transmission loss is 17.5600 MW when the population size is increased to 20. This indicates that higher population sizes will give better performance [11]. The same scenarios can also be observed at different loading conditions. From the results it is found that the large population size has a significant impact in performing optimization process using the PSO technique.
TABLE 4
[image:5.612.65.298.532.671.2]TRANSMISSION LOSS REDUCTION LOAD VARIATION AT BUS 24
Fig 7 : Results for transmission loss reduction load variation at bus 24 with and without SVC.
Fig 8 : Results of voltage profile improvement at bus 24 with and without SVC.
TABLE 5
RESULTS FOR THE EFFECT OF POPULATION SIZE PERFORMED AT BUS 17
Transmission Loss when load at Bus-17 is varied
Pop.
Size Qd17=10 Qd17=20 Qd17=30 Qd17=50
Mvar Mvar Mvar Mvar
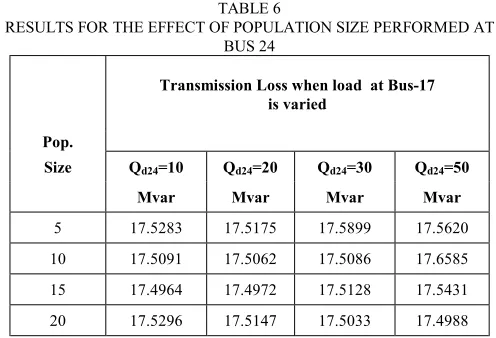
[image:5.612.313.561.543.712.2]5 17.4961 17.4973 17.6216 17.6995 10 17.4933 17.5719 17.5217 17.5420 15 17.4937 17.5494 17.5038 17.5195 20 17.4992 17.5127 17.5110 17.5600 The effect of population size to transmission loss reduction to bus 24 is listed in Table 6. Similar phenomenon is observed as those for bus 24. From the table it is discovered that the best transmission loss can be observed at population size of 15. From Table 5 and 6; 20 is the population size as the most suitable to achieve the best performance in transmission loss reduction optimized using PSO. It is suggested to have populations size of 20 for all buses in order to reduce the transmission loss in the system.
TABLE 6
RESULTS FOR THE EFFECT OF POPULATION SIZE PERFORMED AT BUS 24
Transmission Loss when load at Bus-17 is varied
Pop.
Size Qd24=10 Qd24=20 Qd24=30 Qd24=50
Mvar Mvar Mvar Mvar
5 17.5283 17.5175 17.5899 17.5620
10 17.5091 17.5062 17.5086 17.6585 15 17.4964 17.4972 17.5128 17.5431 20 17.5296 17.5147 17.5033 17.4988
Loading Condition
(Mvar)
Transmission Loss (MW)
SVC sizing (Mvar)
Cost SVC IC
without SVC
with
SVC 10
3 (US$) (US$/KVar)
10 17.6615 17.5283 27.5171
1.6888 7.0346
127.3394 16.956
20 18.1052 17.5175 39.0523
8.6136 17.3855
127.2008 74.755
30 18.6418 17.5899 23.2198 -2.3829 20.7548
127.0594 133.650
40 19.4270 17.6018 13.3953 25.8458 11.4657
126.8241 231.480
50 20.6829 17.5620 31.5960
8.7664 19.5306
126.4308 394.560
60 22.3919 17.5546 31.9884
0.6204 20.0114
125.9112 609.070
70 24.4930 18.5055 -27.8060
60.2440 7.6894
125.5640 75.1820
80 27.5385 18.7234 61.2272 -49.5883
0.7810
IV. CONCLUSION
An approach for transmission loss reduction by using SVC installation via PSO as the optimization technique is presented. Source code of PSO optimizations technique was developed to determine the optimal sizing of SVC in order to minimize the transmission loss in the system. Besides that, the voltage profiles and cost installation of SVC are considered in the system. Tests are performed on the IEEE 30-bus RTS. Result shows that the implementations of PSO have reduced the transmission loss and improved the voltage profile of the system indicating it as a feasible technique to perform the optimization process.
V. REFERENCES
[1] G.Hingorani, “Power electronics in electrical utilities: role of power electronics in future power systems”, in Proc 1988 IEEE, Vol. 76 No, 4 April 1988, pp.481-482. 1988
[2] Saravanan. M, Slochanal. S.M.R, Venkatesh. P, Abraham, P.S, “Applications of PSO Technique for Optimal Location of FACTS Devices Considering System Loadability and Cost of Installation,” in Proc 2005 7th International Power Engineering Conference (IPEC). Pp. 716 - 721 Vol. 2 2005
[3] G.I.Rashed, H.I.Shaheen, S.J.Cheng, “Optimal Locations and Parameters Settings of Multiple TSCSs for Increasing Power System Loadability Based on GA and PSO techniques, in Proc 2007 Third IEEE International Conference on Natural Computation (ICNC 2007), 2007. [4] P.Bhasaputra, and W.Ongsakul, “Optimal Power Flow with Multi-type
of FACTS Devices by Hybrid TS/SA Approach,” in Proc. IEEE ICIT’ 02 Bangkok Thailand, 2002.
[5] Idris. R.M, Kharuddin. A, and Mustafa, M.W, “Optimal Choice of FACTS devices for ATC Enhancement Using Bees Algorithm,” in Proc. 2009, Power Engineering Conference, 2009. (AUPEC 2009). Australasian Universities 2009 , pp. 1 – 6, 2009.
[6] Phashant Kumar Towari, and Tog Raj Sood, “ Optimal Location of FACTS Devices in Power System Using Genetic Algorithm,” in Proc. IEEE World Congress on Nature And Biologically Inspired Computing (NaBIC 2009), 2009.
[7] W. Ongsakul, and P. Jirapong, “Optimal allocations of FACTS devices to enhance total transfer capability using evolutionary programming,” in Proc. International Symposium on Circuits and Systems, Japan, 23-26 May vol. 5 pp. 4175-4178, 2005.
[8] M.M.E. Metwally, A.A. E. Emary, F.M.E.Bendary, and M.I. Mosaad, “Optimal allocations of FACTS devices to enhance total transfer capability using evolutionary programming,” in Proc. Power System Conference, 2008, MEPCON 2008, 12th International Middle –East, pp. 1-4.
[9] S. Panda, and N.P.Padly, “Comparison of particle swarm optimization and genetic algorithm for FACTS-based controller design,” Applied Soft Computing, vol 8, Issue 4, pp. 251-259, Mar. 2007.
[10] S. Chansareewittaya, and P, Jirapong, “Power Transfer Cabability Enhancement with Multitype FACTS Controller Using Particle Swarm Optimization,” in Proc IEEE TENCON 2010.
[11] Ismail Musirin, Nur Dianah Mohd Radzi, Muhammad Murtadha Othman, Mohamad Khayat Idris, Titik Khawa Abdul Rahman, “Voltage Profile Improvement Using Unified Power Flow Controller via Articial Immune System”, WSEAS Transaction on Power Systems, Issue 4, Volume 3, April 2008.
[12] Nor Rul Hasma Abdullah, Ismail Musirin, Muhammad Murtadha Othaman, “Static VAR Compensator for Minimising Transmission Loss and Installation Cost Calculation,” Australian Journal of Basic and Applied Sciences, 4(4): 646-657, 2010.
[13] N.G.Hingorani, and L.Gygyi, “Understanding FACTS: Concept and Technology of Flexible AC Transmission Systems,” in Proc. IEEE Press, 2000, p.18. 2000.
[14] S. Auchariyamet, and S.Sirismrannukul, “Optimal Reactive Power Planning with FACTS Devices by Particle Swarm Optimization”, In
Proc. 8th International conference on Advances in Power System Control, Operation and Management (APSCOM 2009),2009, pp. 1 – 6. 2009.
[15] L.J. Cai, I.Erlich, and G.Stamtsis, “Optimal Choice and Allocation of FACTS Devices in Deregulated Electricity Market using Genetic Algorithm”, in Proc. Power Systems Conference and Exposition 2004. (IEEE PES 2004) 2004 , pp. 201 - 207 vol.1 2004.
[16] R. D. Zimmermann, and D. Gan, "Matpower a Matlab power system simulation package, User’s Manual,”, Version 2.0, Dec. 1997. [17] J. Kennedy, and R. Eberhart, “Particle Swarm Optimization,” in Proc.
1995 IEEE International Conf. on Neural Network, vol 4, pp. 1942-1948.
[18] Chansareewittaya. S, and Jirapong, P, “Power Transfer Capability Enhancement with Multitype FACTS Controllers Using Particle Swarm Optimization,” in Proc. 2010 IEEE TENCON Conference 2010, pp 42 - 47E. 2010.
[19] Hashemzadeh. H, and Hosseini. S.H., “Locating Series FACTS Devices Using Line Outage Sensitivity Factors and Particle Swarms Optimization for Congestion Management,” Power & Energy Society General Meeting, 2009 (PES '09). pp 1-6, 2009.
[20] Sundareswaran. K, Hariharan. B, Parasseri. F.P, Antony. D.S, and Subair, B, “Optimal Placement of Static VAr Compensators (SVC’s) Using Particle Swarm Optimization,” in Proc 2010, International Conference on Power, Control and Embedded Systems (ICPCES), 2010 2010 , pp. 1 – 4, 2010.
BIOGRAPHIES
Siti Amely Jumaat was born in Johor, Malaysia on March 12, 1979. She graduated from the Institut Tun Hussein Onn (ITTHO-UTM) with honours degree in BSc. Electrical Eng. in 2001 and MEng. (Power), UTM in 2003. She is currently is pursuing a PhD in power system at Universiti Teknologi MARA, Malaysia. Her research interests include power system stability, facts devices and Artificial Intelligent techniques. She is also a member of BEM, IEM, IEEE, IEEE Power Engineering Society (PES) 2008.
Associate Professor Dr. Ismail Musirin obtained Diploma of Electrical Power Engineering in 1987, Bachelor of Electrical Engineering (Hons) in 1990; both from Universiti Teknologi Malaysia, MSc in Pulsed Power Technology in 1992 from University of Strathclyde, United Kingdom and PhD in Electrical Engineering from Universiti Teknologi MARA, Malaysia in 2004. His research interest includes power system stability, optimization techniques, distributed generator and artificial intelligence. He is also a member of IEEE, IEEE Power Engineering Society and Artificial Immune System Society (ARTIST).
Dr. Muhammad Murtadha bin Othman received his B.Eng. (Hons) from Staffordshire University,England in 1998; M.Sc from Universiti Putra Malaysia in 2000 and PhD from Universiti Kebangsaan Malaysia in 2006. He currently lectures at the Universiti Teknologi MARA, Malaysia. His area of research interests are artificial intelligence, transfer capability assessment and reliability studies in a deregulated power system.