COMMISSION OF THE EUROPEAN COMMUNITIES
STATISTICAL PARAMETRIC AND
NON-PARAMETRIC METHODS
OF DETERMINING THE RELIABILITY
OF MECHANICAL COMPONENTS
ftiSw
by
D. BASILE and G. VOLTA
1970
EUR/
20. 7.
m
f?. Τ,
Joint Nuclear Research Center Ispra Establishment - Italy
LEGAL NOTICE
This document was prepared under the sponsorship of the Commission of the European Communities.
Neither the Commission of the European Communities, its contractors nor any person acting on their behalf :
Make any warranty or representation, express or implied, with respect to the accuracy, completeness, or usefulness of the information contained in this document, or that the use of any information, apparatus, method, or process disclosed in this document may not infringe privately owned rights ; or Assume any liability with respect to the use of, or for damages resulting from the use of any information, apparatus, method or process disclosed in this document.
This report is on sale at the addresses listed on cover page 4
at the price of FF 11,— FB 100,— DM 7.30 Lit. 1,250,— Fl.
7.25,-When ordering, please quote the EUR number and the title, which are indicated on the cover of each report.
Printed by Vanmelle, Ghent Luxembourg, June 1970
Joint Nuclear Research Center — Ispra Establishment (Italy) Engineering Department — Technology
Luxembourg, June 1970 — 70 Pages — 6 Figures — FB 100,— Various statistical methods were studied permitting determination of the distribution of the failure probability of a mechanical component using the experimental data obtained by tests on the component itself.
Parametrical methods were considered (applying the maximum likelihood principle) and non-parametrical methods (order statistics) ; particular emphasis was also given to the use of probability papers.
EUR 4282 e
STATISTICAL PARAMETRIC AND NON-PARAMETRIC ME-THODS OF DETERMINING THE RELIABILITY OF MECHANI-CAL COMPONENTS by D. BASILE and G. VOLTA
Commission of the European Communities
Joint Nuclear Research Center — Ispra Establishment (Italy) Engineering Department — Technology
Luxembourg, June 1970 — 70 Pages — 6 Figures — FB 100 — Various statistical methods were studied permitting determination of the distribution of the failure probability of a mechanical component using the experimental data obtained by tests on the component itself.
These methods for the Weibull distribution are applied to some samples concerning rupture resistance of intermetallic joints and the lifetime of mechanical components.
Also presented are three digital computer programs (IBM 360/65) to determine the Weibull parameters, the ranks with a fixed confidence level and application of the Kolmogorov test.
These methods for the Weibull distribution are applied to some samples concerning rupture resistance of intermetallic joints and the lifetime of mechanical components.
COMMISSION OF THE EUROPEAN COMMUNITIES
STATISTICAL PARAMETRIC AND
NON-PARAMETRIC METHODS
OF DETERMINING THE RELIABILITY
OF MECHANICAL COMPONENTS
by
D. BASILE and G. VOLTA
1970
Joint Nuclear Research Center Ispra Establishment - Italy
Parametrical methods were considered (applying the maximum likelihood principle) and non-parametrical methods (order statistics) ; particular emphasis was also given to the use of probability papers.
These methods for the Weibull distribution are applied to some samples concerning rupture resistance of intermetallic joints and the lifetime of mechanical components.
Also presented are three digital computer programs (IBM 360/65) to determine the Weibull parameters, the ranks with a fixed confidence level and application of the Kolmogorov test.
KEYWORDS
ELEMENTARY PARTICLES ELECTRONICS
LIFETIME STRESSES STATISTICS MASS
5
CONTENTS
1. INTRODUCTION
2. PARAMETRIC METHODS H
3. NON-PARAMETRIC METHODS 25
k. METHOD OF PROBABILITY PAPERS 28
5. APPLICATIONS ¿9
BIBLIOGRAPHY 45
STATISTICAL PARAMETRIC AND NON-PARAMETRIC METHODS OF DETERMINING THE RELIABILITY OF MECHANICAL COMPONENTS *)
1. INTRODUCTION
1.1 Subject Matter
The theory of reliability can be divided into two main sec-tions. The first deals with the ways of handling the available experimental material so as to discover a posteriori the statis-tical law of behaviour of a component. (The notion of a '•component" or '•system·' is not to be associated with any image of a physical complex. The component is the elementary unit under consideration, for which the statistical law of behaviour is to be defined. The system is the result of the functional connexion of a number of components.)
The second section starts from the assumption of knowledge
of the statistical properties of the components to deduce, by means of appropriate probabilistic models that simulate the functional relations between components, the properties of a system.
This report is a contribution to the first section. To process the experimental material, which consists of data (lifetime, break-ing stresses, etc.) correspondbreak-ing to events considered as random, one uses statistical methods already developed to a large extent for an immense variety of applications. The specific application of these mathematical methods to reliability problems depends on the type of component in question, the context and the purpose of the application.
The method that can and must be employed to assess the reliability of mass-produced electronic components in a design study for a data bank, for instance, is of little use to someone who wants to evaluate the reliability of mechanical components of a plant in operation so that the management can be duly adjusted at once.
- the dimensions of the available sample are always fairly small;
- the deterioration of the properties (through wear, corrosion, fatigue, etc.) with time is significant with respect to the lifetimes regarded as useful;
- the reliability analysis effected during operation, taking into account the damage that has occurred on only a fraction of a series of functioning components, can be of more immediate in-terest than the reliability analysis that can be obtained when the sampling procedure is completed in full.
Adopting this point of view, to which is not yet given enough consideration in the literature on reliability, we have set out the typical and suitable methods of analysis, developing for each the appropriate digital programmes.
1.2 Plan of the Report
Section 2 briefly describes the main outlines of what are called parametric methods for the statistical analysis of samples, i.e., the methods most commonly used in the case of large numbers of samples. We have dwelt more particularly on the application of these methods to cases of exponential and Weibull distributions of failure.
The range of reference works available for this matter is enormous as far as the general principles are concerned, but is far more limited when it comes to specific application to Weibull distributions. We referred chiefly to the excellent book by Lloyd and lipow (Ref. 1).
This method has been insistently advocated and illustrated by L.G. Johnson (Refe. 2 and 3) of General Motors, precisely in the context of its application to mechanical components.
The method is extremely simple when suitable tabulated values are available; for small samples it is better than the parametrio methods and, unlike them, enables one to take into consideration incomplete samples, such as occur in the case of a set of in-service components only a fraction of which is dam-aged· We describe the method and have also developed a digital programme by which the tabulated values can be obtained for samples composed of 1-30 elements and for various degrees of confidence.
Section k contains a critical analysis of the method of "probability papers", a method which combines the advantages of the non-parametrio method with the potentialities inherent to the parametrio methods. For this method we referred principally to the works by Gumbel (Ref. k) and Weibull (Ref. 5 ) .
Lastly, in Section 3, the various methods mentioned are applied to some real cases and the results are compared with reference to the extreme values.
1.3 Some General Concepts
1.3.1 Definition of reliability
Out of the various definitions of reliability we quote the one adopted by the IECt "The characteristic of an item expressed by the probability that it will perform a required function under stated conditions for a stated period of time". The probability indicated, a function of time, is the complement to 1 of the probability of non-function or probability of failure.
1·3·2 Failure distribution function and failure rate function
The functions of failure distribution versus time are also indioated as life characteristics of the given component. We shall take F(t) to be the failure distribution, i.e., the probability that the component will fail before time t, and f(t) the correspond ing density. It is also expedient to introduce a "failure rate" v(t) defined as
, . . f(t)
v(t) =
1 - F(t)
This function is also known as the "force of mortality", "mills ratio", "intensity function" or "hazard rate". The failure rate function is useful because amongst other things, it allows of dividing the distribution functions into two main categories -the failure rate functions that increase with time, and those that decrease with time.
The fact of belonging to one or other of these categories has an immediate physical significance: an increasing f.r.f. corresponds to the existence of wear or fatigue phenomena, a decreasing f.r.f. to the running-in situation, for instance; but the subdivision also has an important formal significance: one need only know
that a distribution belongs to one or the other category to be able to deduce limit statistical properties of the component concerned or of the system consisting of a number of components (Ref. 6).
1·3·3 Most commonly used continuous failure distributions
Exponential distribution
F(t) = l-e"Xt t £0 , λ > 0
f(t) = Xe~Xt v(t) = λ
f ( t ) = λ « ( f e ) ' e " '
v ( t ) = λ ait-Qf1
Mean = λ1 / αΓ ( 1 + 1 / α )
Normal d i s t r i b u t i o n
F ( t ) = - i — e 2 σ dt
'Γ 7^
Æ7
f
(t) = -JL_ e
2*
Æ 7 <v(t) = —Ξ
i (£31)2
2 v σ 'C
e 2 σ dtMean = u
Log-normal d i s t r i b u t i o n
I f y » I n t i s a normal v a r i a t e w i t h mean ,\x and v a r i a n c e 6*^ t h e d i s t r i b u t i o n o f t i s known a s l o g - n o r m a l :
Ì(ZI
2 v σ1 f
mt
- i ( ^ )
2 e 2 σ dyσ / 2 T J
-- A --
e
2 σ*
¿2ΪΓ ' o
1 / l n t - ux2
f(t) . I _ ¿ _
e2
(- T -
)* σ /δϊ"
The exponential distribution is characterized by a constant rate of failure function (A.). The reciprocal of >■ is the mean time between two failures (MTBF).
This law interprets failure phenomena corresponding to purely random events and it also interprets phenomena of failure of complex systems, when the number of components tends to become very large, independently of the law of failure of the individual components. Furthermore it takes advantage of the fact that a system consisting of components characterized by an exponential law will likewise have an exponential failure law.
The normal and lognormal distributions are used mainly to interpret failure phenomena due to wear. They are characterized by failure rate functions that increase with time.
The Weilbull distribution, with three parameters, is more flexible than the foregoing ones. Its limit case, for oC = 1, is the exponential distribution, and it too can be used to interpret failure due to wear. Moreover it is suitable for a linear repre sentation on loglog paper, so that it does not require special probability papers. Lastly it is an asymptotic distribution of the extreme values of a wide class of distributions (Ref. ¿0, for which reason it appears in particular to be inherently suited to represent the phenomena of material failure, interpreted as the failure of the weakest link in a chain.
1.3.1* The reliability function
The reliability function R is defined as the difference between the failure distribution values corresponding to the extremes of the event (period of time intended and operating conditions encountered).
R = F(t2) - F(t1)
In general one assumes for . .
the time interval ( V V ' l"» ' * s o t h a t :
R(T) = 1 - F(T)
The time Τ is often indicated as "mission time". On the basis of this definition R(t) is to be deduced straightaway in the cases F(t) indicated.
2. PARAMETRIC METHODS
2.1 General Scheme
The term "parametric" applied to these methods is due to the fact that, starting from the sample, they evaluate the para meters of the distribution of failure and hence of reliability, a distribution hypothesized a priori. Roughly speaking, their stages of use are as follows:
(*)
i) availability of a complete set of values (sample) referring
(*)
to the component's characteristic used for the reliability estimate (lifetime, breaking stress, etc.). These values obviously have to be obtained from tests or operating expe rience on components belonging to the same statistical popu lation.
ii) Assumption of one or more forms of statistical distribution to which the sample is assumed to belong.
iii) Estimate of the distribution parameters, based on the sample values. The most practical and suitable procedure for this
purpose is the one based on the principle of maximum likelihood. iv) Test for goodness of fit on the various assumed distributions
to see which one fits the interpretation of the sample best for a given significance level.
v) Determination of the variances of the estimated parameters and, if appropriate, of their confidence intervale.
vi) Calculation of the reliability value, by means of the distri bution adopted and the estimated parameters. This reliability value will likewise be an estimated value. Hence a confidence interval will have to be established for it.
2.2 Estimate of Parameters
2.2.1 The maximum-likelihood method
This very general method is mentioned in all text books on statistics. Considering, for simplicity's sake, a distribution with a single parameter of, f(t,e(), of which the mathematical form is assumed to be known, we form from the sample
(t , t_,..., t ) the function
known as the function of likelihood of the sample. It corresponds to the compound probability of n random independent variables, each with the same probability distribution, i.e., it corresponds to the probability of obtaining the sample under study out of all the possible samples of the same size. The method consists in determining which value of the parameter oc renders it most probable that the sample under study will turn up. Thus, if we call that value oc it must satisfy the equation
flii
= 0
(2)
(or fj = ° with λ = log L) known as the likelihood equation.
Under very general conditions, the maximumlikelihood estimate has a normal distribution when the sample dimensions tend to o4. This asymptotic property of the maximumlikelihood estimates is most useful, because it means that the properties characteristic of a normal distribution can be attributed to those estimates. At the same time, inasmuch as it is an asymp totic property, it is the chief limitation of the method, since small samples cannot be taken into consideration (according to Ref. 1, page 172, the correct use of the normal approximation oalls for sample sizes of not less than 5 0 ) .
2.2.1 Determination of the variances of the estimated parameters A distribution dependent on two parameters oC, X is con sidered. Let of and λ. be the values of these parameters esti mated by the maximumlikelihood method from the sample values. It has been shown (Ref. 7) that by using the asymptotic property
A
A s
Between A and matrix
¿a
3a2
3
24
3α3λ
(3)
3α3λ 3λ'
Β s («O
Var α Cov (α,λ)
A A A
Cov(a,X;Var λ
there is the simple relation:
B = * A (5)
It will be noted that A is a function of the real para
meters of, X ; approximated values are obtained by substituting
A
for the real, unknown values the estimated values fit, Λ.
In the oase where the distribution depends on a single parameter
at, we obtain from the foregoing formulae:
32«CV1 Var o = (—j)
3α
(6)
2.3 Goodness of Fit
The choice of the form of distribution to which the data
are assumed to belong is, a priori, arbitrary. Hence, the
distributions adopted, whose parameters have been estimated on
the basis of the sample, must be tested to decide which fits
beet with the sample. Let us briefly describe two widely used
tests, namely the chisquared test and the Kolmogoroff test·
The first applies to the density of distribution, the second
to the distribution. The efficiency of both methods is limited
to small samples because it calls for division of the sample into classes and calculation of the frequency for each class. The second method does not have this drawback. But being based on asymptotic properties, neither is very significant when it comes to small samples.
2.3.1 The chi-squared test (Ref. 8)
The data for the sample of size n are classified in k intervale
A ti
and the values ν are considered, corresponding to the number of sample data comprised in the i-th generic interval.
If f(t) is the density function of the assumed distribution
*i + Ati/2
w
f(t)dt (7)*i - Ati/2
will represent the probability that the statistical variable in question belongs to the i-th interval.
If the assumption concerning the distribution is valid, then
lim P(|V i - npj < e) = 1 (8)
With a choice owed to Pearson, we can establish the following magnitude as the measurement of this goodness of
fit: 2
k (v. - nPl> ( 9 )
Δ s i » . _
ι x "Pi
and it can be shown that Δ is a random variable distributed, 2
with n*""* , according to a γ law with k-1 degrees of freedom, in the event that the parameters of the assumed distribution are known.
If, on the other hand, the parameters are estimated from the sample, the number of degrees of liberty will be lower than k-1 by as many units as there are estimated parameters.
For practical application of the test, having calculated 2
A and set a level of significance γ, we find from the tables a
,2
value Xr such that:
r(x
2>x*> = x
(10)The assumed distribution satisfies the test if
.2 2 Δ < χ Y
For a valid application of the test the sample dimensions must be such that
np. > 10 i = 1» — » k
2.3.2 Kolmogoroff test (Ref. 9)
This is a test which examines the cumulative distri bution. Let F(t) be this distribution assumed to be continuous and let S (t) be the empirical distribution of the sample of
n
Furthermore let:
D s mx |F(t) S (t)| (11)
<»<X<eo
» 2 2
Q(X) = Σ (l)k e"2 k λ λ > 0 (12) — « .
The test is based on Kolmogoroff's theorem which states:
lim P(D < — ) * Q U ) (13)
η·*·
nJã
For application purposes, once D has been calculated and a level of significance of has been chosen, we find in the tables value Λ ^ for which
Q Ua) = 1 a (IH)
The distribution in question will satisfy the test if
D < λ / Æ
η α
In Appendix 1 will be found the description of the KTEST code, programmed in IBM 36O/65 to effect the Kolmogoroff test on various distributions. The normal, lognormal, Weibull and expo nential distributions are considered.
2»h Reliability Estimate
When the failure distribution parameters have been estimated, we can estimate the reliability value corresponding to a time T.
R(T) = R(«, X , T)
Now comes the problem of evaluating the confidence we can have in this estimate.
The general method, which is valid only for numerous samples and does not require knowledge of the distribution of
A A
property of being asymptotically normal (Ref. 1, page 192). Hence
A A
it is necessary to know E(R) and Var R, i.e., the mean value and variance of the estimate.
It has been shown (Ref. 10, page 35Ό that
E[R(CX,X)1 = R(a,X) + 0(l/n) (15)
(16) Var[R(o,X)] = Ä 2 Var α + (¿£)2 Var λ +
9α α 9λ
+ 2 Ä
&\
Cov(â,
λ)
+ Od/n
1'
5)
3α ° 9λ λ
1 ·5
Both 0(ΐ/η * ) and 0(ΐ/η) are terms which tend towards
zero as the sample dimensions increase. An estimate of E(R) and
Λ A A
Var(R) can be obtained by substituting α, λ, for of, λ in (15) and (16).
This general procedure is not necessary in cases where the reliability is a function of a single parameter (see exponen tial distribution). In such a case a reliability confidence in terval can be found directly from the parameter confidence inter val. For this purpose one must know the parameter distribution or else apply the property of normal asymptotic behaviour of the estimate using the variance calculated in Section 2.2.1.
2.3 Applications
2.5.1 Exponential distribution
The failure distribution density is given by:
f(t,X) = λ e~Xt t 2 0 , λ > 0
Starting from the sample (t ,...,t ) the maximum-likelihood function will be:
and from the maximum-likelihood equation
3 l p8 L = o
3λ we obtain
1 .. Σΐ ti (18)
A ™'
λ η
i.e., the mean of the sample is the inverse of the estimate of parameter λ. An estimated value of the reliability at time Τ will be given by:
R = R(T,X) = e"XT <19>
The calculation of the confidence interval of this esti mate can be done by two different routes as already mentioned in Section 2.,k. One procedure, which we might call general, entails calculation of the variance of the distribution parameter, followed by calculation of the R variance and, using the normal approximation, the R confidence interval. F r o m ( 6 ) w e o b t a i n
v a r
;
s. (ifiogji) -
1 shi
3λ2 n
and from (15) and (16) E(R)
Var
a
-R
The
η =
-XT ι s e
" 2 R = ( % , Var λ
3λ Α
Τ.λ -λΤ R in
v a r i a b l e
R - E(R) σ
R
λ
l o g
Æ
2 π.2 Τ
η
l / R :
- 2 Τ . λ e
: R l o g
Æ
l / R
is asymptotically a standardized normal variate. Having established a confidence level γ, we find the confidence interval for the
reliability:
R ì ° ; ' η(1+γ)/2
R
A second procedure, valid only in the case of exponential distribution, allows one to avoid the repeated use of the asymp totic approximations employed in the previous procedure.
This second route is based on two characteristics of the exponential distribution:
Λ
the distribution of the estimated parameter λ is known; the reliability is a monotonie function of the parameter.
It has been shown (Ref. 11, page 190) that the estimated parameter τ = — has a gamma distribution:
λ
t
(21)
2 τ
by putting Χ = 2η — this distribution can be reduced to a chisquared distribution with 2n degrees of freedom. Thus (21) is equivalent to:
P(x < y) =
Γ tnl et/2 d t (22)
2ηΓ(η)
By using (2.2) we can obtain an exact evaluation of the
A A
confidence limit on R = R(~) at a given confidence level γ . For having fixed a value for V, we obtain from (22) :
P (
2nL <
τ)=
γ(23)
Χχγ
Thus ' . 2ητ represents a lower limit of t with confidence level f .
τ/τ
As the reliability R » e is an increasing function of
Τ , it follows that a lower limit for the reliability at time T,
with confidence level f, will be given by:
T* l y
R i ^ ) = e * ;i (24)
It is important to note that we have been able to transfer A
to the reliability the confidence limit calculated for Τ only
inasmuch as the distribution has only one parameter. In general
this is not possible where there is more than one parameter.
2.5.2 Weibull_distribution
The most general form of this distribution has three
parameters:
F(t) = 1βλ<*θ)β
for the sake of simplicity, we shall assume © » 0; the probability
density function therefore is:
f(t) -- αλ t""1 e"At t * 0 , a > 0 , \ > 0
The log of the likelihood function, for a sample (t1i«««»t ) is
given by:
ç η η
¿j = η loga t η logX + (a1) E . l o g t, Α Σ . t?
1 * i 1 i i
By imposing the maximum likelihood conditions on Åt
(25)
we get two equations for the determination of the estimated values of, X , of the two parameters:
λ = Σ t.
α =
(26)
(27) λ Σ t. log t. Σ log t¿
A A
The calculation of oc and A from these equations is done with an iteration process programmed on IBM 36O/65· To obtain a reasonable initial value for α the following relation is used, which expresses equality between the sample mean and the distri bution mean:
± Σ t. = λ"1 / α Γ(1 + ί)
η ι α (28)
Το determine the variance and covariance of the two parameters it is necessary to invert the matrix
ÛL
9a 9 2
£
3α9λ
92cC
9α9λ
9JU
9X2(29)
Having calculated Var ot, V a r A , Cov(«A.) in this way, we can find the variance of the estimated reliability value. If Τ is the missiontime for the component for which the relia bility is to be ascertained, then the estimated reliability value is
. A T "
R = e
Also, by reference to (I5) and (16)
Λ -λ τα
* 2α -2λΤβ 2 2 * "
-Var R = Τ e (λ* log ' Τ -Var α + -Var λ + 2λ log Τ Οον(α,λ)) (31)
Estimated values for E(R) and Var R can be obtained by replacing of and Λ in the previous equations with their estimates ot and A.
Using the normal approximation we can then find a confi-dence interval for R.
The foregoing calculations have been programmed on IBM 36Ο/65. Appendix 2 gives a description of the VITA oode employed.
3. NON-PARAMETRIC METHODS
3.1 General
Given a fairly small sample (with fewer than, say, 20 values) the mathematically laborious method described in the previous chapter yields results whose significance is not pro portionate to the effort required.
The method we shall give here, however, enables the reliability corresponding to the measured values to be easily and directly evaluated, even with very small samples.
It also permits of evaluating a confidence interval, likewise in respect of the measured values.
Lastly, it allows the sample size to be taken into account in cases where the sample is incomplete: from this standpoint it offers a possibility not allowed by the method described in the previous chapter.
3.2 Statistical Properties of Ordered Samples
3.2.1 Distribution of the m-th value
Let (t_, — , t , — , t ) be a sample of size n with 1 m n
values in order of increase. The distribution $(t) from which the sample was taken is unknown. The problem is to estimate the cumulative probability 5(t ), using for the purpose the sample's
m
property of being ordered. If the population is sampled again, the value t', arrayed in the m-th position, will in general be m different from t and one can say that the sample order position m characterizes, by means of all the samples extractable from the population, a set of values, the t values, which will be
m
distributed according to their own law of probability, whose density is:
n m m m |_ m n"m •'(t ) (1)
m
This law can be determined at once by using the poly nomial distribution and the sample's property of order. It is a known fact that, given three events with probabilities p1, p_ and ρ at the instant of a test, the probability that in η tests the event with probability ρ will occur η times, that of prob ability p. η times, and that of probability ρ η times is:
nl n2 n3 n
l
!V
n3
! Pl ?2 PaIf we now let the event "value of t lying between t m and t + dt " correspond to p„, then
mm r ^i*
ρ = ζ(t )dt χ m m
Similarly let the event "value of t^t" correspond to ρ , then
P9 = #(t )
¿ m
and lastly let the event "value of t > t " correspond to p,. so
m 5
that
Po = 1 *(t )
o m
If η = 1, n_ = m 1, η = η m, the probability law obtained is actually that of the population of t values repre
nd
sented by (1). Naturally (1) and therefore the mean t , the m median t and the modal value t are unknown, in our oase,
m m
because <r(t) is unknown.
3.2.2 Probability distribution for mth value
By performing in (1) the variate transformation
Φ = *(t ) ( 2 )
m m we obtain
χ (Φ ) = m( )Φ_ (1_Φ„) An m m m m
in which
0 ^ Φ £ 1 m
Thus χ (Φ ) represents the probability density for the distribution of n m
the cumulative probability values appropriate to the values of t . m The chief interest of (3) lies in the fact that the φ
■» m distribution does not depend on the unknown ψ(t) distribution.
In general the probability density for the beta distri
bution is:
_, ν Γ(α+β+2) α,. .0 ζ ( χ ) = Γ(«+1) fTßTil Χ ( 1"Χ )
f o r 0 » χ > 1 w i t h e n t i r e α, β > - 1.
With Ä = m - 1 and β = η - m one o b t a i n s e x p r e s s i o n ( 3 ) ·
3 . 2 . 3 E s t i m a t e of t h e 4>(t ) p r o b a b i l i t y - Median r a n k s
— m
I f ij(p) i s t a k e n t o r e p r e s e n t t h e cumulative d i s t r i b u t i o n
of i , t h e n
m
'P
■n(p) = χ_(Φ )άΦ
^î m m
■Ό
It is readily apparent that, integrating item by item successively, we shall obtain
n(p) = Σ
i(J)p
i(l-p)
n_1(Ό
mor
m-1 · :
n(p) = l - Σ . φ px(l-p)n (5) o
Relation (5) enables us to solve the problem stated at the outset, namely, that of obtaining an estimate of the prob ability §(t ) and assigning a confidence level for that estimate.
For in (5), ρ is a value of i such that the probability m
of a value t £ p is ^(p); hence it can be said that ρ is the m ' estimate of i(t ) with confidence level ^(p). m
In other terms this means that if we assign the cumulative probability ρ to the sample observation t , there will be 100 -η (ρ) samples, out of 100 extractable from the population, in which the value ï(t ) will be lower than p. It is perhaps needless to
re-r
knowledge of the value t ; it is merely assumed that t is the
m m
largest of the m values observed, i.e., that the sample is ordered in increasing values.
Hence (5) lends itself to the construction of tables for p, each one characterized by a value o f ^ ( p ) . These are doubleentry tables in which, for every n, the ρ values are given in line with m « 1, 2, __, η. It can be shown that with *\ (p), m, η fixed, there is a single solution of (5) lying between 0 and 1.
Appendix 3 gives the text of the RANKS programme processed on IBM 36O/65 for the solution of (5), and also, for ^(p) = .05, •5, «95, the tables of the ρ values obtained, for sample sizes up to 20. The ρ values obtained with ·*)(ρ) » .5 are known as "median ranks" and are particularly recommended by Johnson (Refs. 2 and 5 ) , who was the first to use them. An interesting aspect of (5) is that confidence belts can be constructed. For this purpose the tables for ^(p) " .05 and .95 are provided. Their use is immediate: they permit of stating that the unknown real probability é(t )
m lies, with 90$ probability, in the interval bounded by Ρ __ and
m .93 mP.05'
3.2.4 Mean ranks and modal value
Other interesting aspects of the distribution of the cumulative probabilities ^(p) can be found by calculating, in addition to the median already noticed, the mean value and the modal value; as regards the mean value we have:
φ = χ (φ )Φ αΦ (6)
m Ι η m m m
■Ό
Noting that: 1
i
ΦΓηίΐ-Φ )n~md* = r ( m + 1 ) r<n-m+i>
V 1 V m Γ(η+2)
we have
Φ = m(n) ■n;<"-'"); = JL. ( 7 )
m m' (n+1)! n+1 V / ;
The modal value is obtained from (3) as the solution of χ' r o η
~ m-1
*m - η^ϊ (8)
The advantage of these estimates as against the median ranks is their very simple form which permits of immediate calculation for all values of m and any size of sample.
Furthermore the confidence level which, by means of (5), can be associated with each estimate is not constant as for the median ranks, but varies with m or with the sample size.
k. METHOD OF PROBABILITY PAPERS
4.1 General
This method has the same objectives as the method described in Section 2, i.e., it aims at deriving a distribution from the sample.
As in the parametric method, the first step in this method is to choose a form of distribution, and then to select a "paper" in which that form of distribution is linear.
Having chosen the paper and therefore the linearization of the function, we now have to represent the sample values.
4.2 Linearization
Let $(t, of, β ) be the cumulative probability of a
statistical variable t and let oc, β» be the distribution para
meters. If there is a linear transformation
y = oi(t β) (1)
such that the distribution
F(y) = Φ(β+γ/α, α, 8) (2)
is independent of the parameters CK, (3, it is possible to con
struct a probability paper for the distribution i. On this
i(t, oc, |î> ) will then be represented by the straight line (1).
F(y) is called the "standard form" of the distribution and is
usually tabulated. If there are three parameters of, β , τ , there
is more than one linearization possible. For instance in the
case of a complete Weibull distribution
W( t) = 1 e[(tß)a]Y (3)
it is possible, for each fixed value of T , to effect the line
arization (1) and hence to refer to a standard form relating to
the fixed Ύ value. Generally, however, the Weibull distribution
is used in the incomplete form obtained with ρ= 0. Obviously linearization of type (1) is then out of the question. In that case we effect a logarithmic transformation which leads to
1 , 1
l o ß l n lw(t)= l o g t + l o g α (4)
ι
which on loglog paper with coordinates t» ^n iw(t) is a line
arization of (3). In this case one can no longer speak of a
4.3 The Plotting Position
As already remarked, the crucial problem in using prob ability papers lies in the choice of the probability value to assign to the generic value of the sample. It will be seen that the manner of choice can be exacting, taking into account the type of distribution that the data have to fit, or approximate (although fulfilling certain criteria), disregarding that dis tribution.
4.3.1 Distribution-dependent plotting
We have already seen in Section 3 that in an ordered sample of size n the m-th position designates, through all the possible ordered samples extractable from the population, a new distribution, that of the m-th value, whose density function is:
φ (t ) = m(nHm _ 1(t ) Γΐ - Φ(ΐ )ln"V(t ) (5)
n m m m L mJ m
the transformation (1) will provide a value corresponding to each t , namely
y = a(t -β) (6)
JB m
belonging to the distribution of the m-th reduced value. Applying the mean operator to (6), we obtain:
E(t ) = β + - E(y ) (7)
m a m
The plotting position proposed by Weibull (Ref. 5, p. 198) is
Pm = F(E(y )) (8)
m m
F being distribution (2), i.e., the standard form of the hypoth esized distribution.
value of the standard distribution at the mean of the reduoed variables relating to the m-th position; the least squares will therefore be effected on the points t , E(y ). The mean E(y )
m m m
must be calculated from the distribution of y which is deterem mined by F(y) and is thus independent of the unknown parameters. The distribution of y is found by operating in (5) the change
m of variables given by (1):
w > -C^'V [
l
- «vf^.'
(9)
Benee
E(y
»
) =
L
y
»
e
*
(y
»
)dy
»
(10)
or else, writing
F(y) = u , y = G(u) (11)
E(y ) = f1 n(n) G(u) um'1(l-u)n""du (12)
It will be seen from (12) that E(y ) depends only on m
m, n and on the standard form of the assumed distribution. If the plotting position (8) is used and the fitting is done with the least-squares method (minimizing the deviations At.) the
A A
estimates oc, β, are not affected by systematio errors (Ref. 5, p. 198). It must be pointed out that position (8) can only be used when the distribution can be brought to a standard form by means of (1). This is not the case, for instance, with the usual Weibull distribution, with β = 0 (see (3)).
4.3.2 Distribution-independent plotting
the preselected form of distribution and hence of requiring the use of tables of the values E(y ).
m
Where these tables are not available and one can make do with a certain degree of approximation in the estimate, it is possible to use other plotting positions which are independent of the distribution and have very simple forms.
For example, if the sample is in order of increasing values we can, by convention, assign the cumulative probability m/n to the ordered value t . If, on the other hand, the sample
m ' is in order of decreasing values, by the same convention we shall
assign to the value t (which is the (n - m + 1) away from the highest value) the probability
1 -
n- °
+ 1= ¡4-1 (13)
n n
Hence it is clear that the choice of a distribution-independent plotting position involves a certain arbitrariness and at the same time an ambiguity which can be resolved only where a criterion is specified for the most rational choice of position.
The problem has been tackled by Gumbel (Ref. 4, p. 29) who set some criteria for the purpose. They can be summed up as follows:
a) the plotting position must be such that all the sample observations can be represented on the probability paper. This criterion is not met by the positions m/n and (m - 1)/n, since a probability 1 corresponds to tn in the first and a probability 0 to t, in the second. Furthermore, as the prob-ability papers are constructed for unlimited variables, they do not contain the probability values 0 and 1 .
An attempt to overcome this difficulty has been made by introducing the position
5Lz_V2
(1if)the arithmetic mean of the two previous positions (mid-ranks). But this position, too, is not very satisfactory if tested with the following criterion:
b) the return period of a value equal to or greater than the largest observation (i.e., the number of trials needed on average to obtain a value greater than or equal to the largest observation) and the return period of a value smaller than the smallest observation (i.e., the number of trials needed on average to obtain a number smaller
than the smallest observation) must tend to n, the number of observations. The return period is defined as the mean of the geometric distribution, relative to an event with probability p. Given an event with probability ρ at each test, the probability that it will occur for the first time at the v-th test will be
w(v) = pq q » 1 - ρ
The mean value of ν is ν = 1/p and represents the return period of the event with probability p.
Hence the return period of a value greater than or equal to the m-th value of an ordered sample is:
T (t ) = 1 (15)
So the return period of t , using position (14), is:
η
τ (t ) * - o„ C6)
V V "
I
η-1/2 -
2ηη
which corresponds to an admission that an event t , which has occurred once in η trials, occurs on average once in every 2n trials. Similarly, considering the return period of a value smaller than t1, we have:
position (14) consequently gives an overoptimistic result
precisely at the extreme values which, in many circumstances
and in failure phenomena in particular, are the most significant
ones. Moreover, the position m/n and (m 1)/n are not satisfactory
from the standpoint of the return period; the return period of a
value greater than or equal to t , for the position m/n, is: m
τ (t ) = j ;
ds)
s m
n m
and is no longer defined for t , while the return period of a
value smaller than t , for the position (m 1)/n, is: m
(19)
and is no longer defined for t..
T,(t )
4
i m m 1
It is interesting now to consider, from the standpoint of
the plotting position, the magnitudes discussed in Section 3 and
defined on the basis of the distribution % (ï ) of the probabil n m
ities appropriate to the mth value of an ordered sample.
The modal value
Φ
=Eli
(20)m n1
is not acceptable since it does not satisfy either the first or
the second of the preceding criteria.
The median value i defined by m
m
~z\
(?>♦* (1 S ) » "
1* 1/2
(21>
ι ι m m
satisfies the first criterion but not the second. The return
period for t has the value
η
Tit ) = Ì V
(22)
s η 1Φ
But from n
(21) we find 1/n and therefore, for high values of n, Φ = 2
η
T (t ) * l.W η (23)
Also it can happen that T.(t„) s T (t ), so that the use rr i 1 s n
of the median ranks as plotting position attributes to the
extreme values a return period which exceeds n by 44$ and there fore does not satisfy the second criterion.
Lastly, the mean of X_(*_)
Φ = -i- (24) m n+1
satisfies both criteria, at any rate for high values of n, since the return period for the extremes has the value η + 1.
This plotting position (mean ranks) appears to Gumbel (Ref. 4) to be the recommendable.
4.4 Least Squares Method
Let us briefly review the formulae expressing the distribution parameter estimates obtained by the least squares method. The
values of the estimates are naturally different according to whether we minimize the deviations on the observed variable or on the reduced variable. It should be remarked that if the mean of the reduced variables y is used as plotting position, esti mates free of systematic error will be obtained only by minimizing the deviations of the observed variable (Ref. 5, Ρ· 198). With reference to (1) we then have:
n o
Α) Σ (t-t.m m Γ = min
where
ln l n — 1 n
t = Σ t , y = Σ y , ty = ■=· Σ t y η . m m η . m 'm J n1m nrm
~2 1 " 2 2 ~~2 2 y = — Σ y c = y y 3 n . m ^m n J J
Note that, the plotting position and distribution having been
chosen, β is a function of the sample size only.
τ η
Β) Σ m (vvm)2 = min
2
4 = ^ r SB = t y/aB (26)
where
aB ty ty
2 _ ¡J. 2. _n_
s
t =
(t"
X )n^T
C) A third parameter estimate consists in minimizing the
deviation of the points in parallel to a straight line determined
by the condition ty = 0. The gradient of this line is equal and
opposite to (1). In this case:
— = (——) (27)
aC aA aB
ß
c=
t -
/
(ΐ -
ß
A)(i - ß
ß)
4.5 Building of Control Band
Having solved the fitting problem, i.e., determined the Α A
estimate values οχ, β, our next task is to construct a control A A
band on either side of the straight line y = o K t ß ) , i.e., to
delimit a zone within which, with a preestablished confidence
level, we shall find the mth observation of an ordered sample
extractable from the population.
For this purpose the distribution of the mth value of
the sample, expressed by (5), must be taken into consideration.
Naturally ψ (t ) is unknown, because é(t ) is unknown; on the
n m m
other hand, © (y ) is known, since it is expressed by (9) as a n m
function of the standard form F(y ) . Furthermore, the two dis si
tributions are formally equal and hence the properties of the
one that leave the parameters out of account are also properties
of the other. In particular it has been shown (Ref. 4, p. 48)
that the asymptotic form of (5), for central values of m, is
normal with a mean value t obtainable from: m
Φ(ϊ ) = -Η- (28) m n+1
and variance
2,„ , *(tm)(l-*(tm)) (29)
σ (t ) = τ—
η Φ' (tm )
If o (t ) were known, then the control band problem would m be solved, at least under the conditions for the validity of the
2
asymptotic form. But d (t ) is not known because it depends on
é'(t ). It is therefore necessary to use the preceding obser-m
vation which also has an asymptotically normal distribution
2 F(y )(1F(y ))
o2(y ) = £_; Ü — (30)
m π2/ " X
n F' (y ) m
which is independent of the of, β parameters and can only be
calculated on the basis of the adopted distribution.
The standard error for the reduced variable y is therefore a pure
HI
number
^a(y)=^ÍEñ
(3D
m F,2
which can be determined, for each m, from the knowledge of F(y ) ■ m/(n + 1 ) and also of F'(y ) which can be found in the
m m
standard form tables beside F(y ) .
m
The s t a n d a r d e r r o r on t i s t h e n o b t a i n e d from ( ï ) and ( 3 1 ) : m
,<t ) = E-i
e t t ; = =-=. ( 3 2 )
m Γ
α /n
and i f a h a s been e s t i m a t e d , (32) can be used t o c o n s t r u c t t h e
c o n t r o l c u r v e s . These w i l l be o b t a i n e d by c o n n e c t i n g t h e p o i n t s
t ¿ ktf(t ) (33)
m m
t being a point on the estimated straight line and k a coefficient m
dependent on the degree of confidence attributed to the control
band. For example, k = I.96 expresses the probability 0.95 that
for any m within the limits of the hypothesis on the central
values the observation t of the generic sample lies within Α Λ m
the interval t Ì 1 .96 ô*(t ) · On these bases it is not possible
m m
to calculate the control band at the extreme values. As a rule
one assumes that the foregoing considerations are valid in the
probability interval O.15 O.85. Outside that interval the
asymptotic distribution of t ceases to be normal (Ref. 4, p. 49).
Another way of constructing control bands, which has the
advantage of being independent of the standard form of the dis
values, is the method which is mentioned at the end of Section 3 and is based on knowledge of the tabulated values of ρ for a certain confidence level ij (p).
5. APPLICATIONS
By way of example, three sets of data concerning times and breaking stresses of mechanical components are processed below by the methods we have described. One of the samples ex amined is incomplete, i.e., this is a case of failure times
drawn from a sample which includes components still in operation; the other two samples are complete. The available data are pro cessed with the KTEST code (Appendix 1) to establish which dis tribution interprets them best. Owing to the smallness of the samples, the Kolmogoroff test is ineffective in two cases because the level of significance reaches the max. value 1 in three out of the four distributions tried. For the third set, however, (stresses to failure) the test gives as the limit level of signi ficance the values 97.6% for the Weibull distribution, 98.5# for the log-normal, and 97*5% for the normal and the exponential.
For greater simplicity and for the purposes of example, we shall assume, however, that the sets of data can be interpreted by a Weibull distribution, linearized as in expression (4),
Section 4.
The scales of (1 - R ) , R being the reliability, and of Y = log ln 1/R are entered on the two horizontal axes of the re levant probability paper, whilst the observed variable and its logarithm are entered on the vertical axes.
5.1 Intermetallic Weld Failure Stresses
2 σ. (kg/mm )
6.73 , 6.74 , 10.1 , 10.5 , 10.7 , 12.6 , 13.3 , 13.8 14.7 , 14.75 , 15. , 15.5 , 16.3 , 16.7 , 17.1 , 17.2 17.24 , 17.3 , 17.5 , 18.1 , 18.24 , 20.2 , 20.3 , 21.2 21.9 , 22.6 , 23.1 , 24.5
Assuming a Weibull distribution and using the non-parametric method of mean ranks on probability paper, we obtain:
- (^-)3
19 R(o) = e y
The maximum-likelihood method, however, gives:
. σ .4.13
D, . ' 47.95'
R(o) = e
Fig. 1 shows the two corresponding straight lines. The following table compares the strength values obtained with the two methods for given values of reliability R.
max. l i k e l i h o o d mean ranks
°.95
8.7
7.2
0.99
5.88
4.2
°.9999 1.93 0.89
2
If, however, we set a working strength of 6 kg/mm , the max. likelihood method gives a reliability value of .989 and a lower limit, with confidence level of 98%, given by
.989 - oR ζ > 9 5 = .975
where 6^ is the reliability variance calculated from (31) in
R
Section 2 (d„ = 6.9I.IO"0) and r __ is the reduced normal variable
R . 7P
Similarly, the nonparametrio method gives a reliability
value of .969 and a lower limit of .92 with confidenoe level 95$·
The lover limit value is obtained by extrapolating the straight
line which interpolates the 35% ranks calculated with the RANKS code.
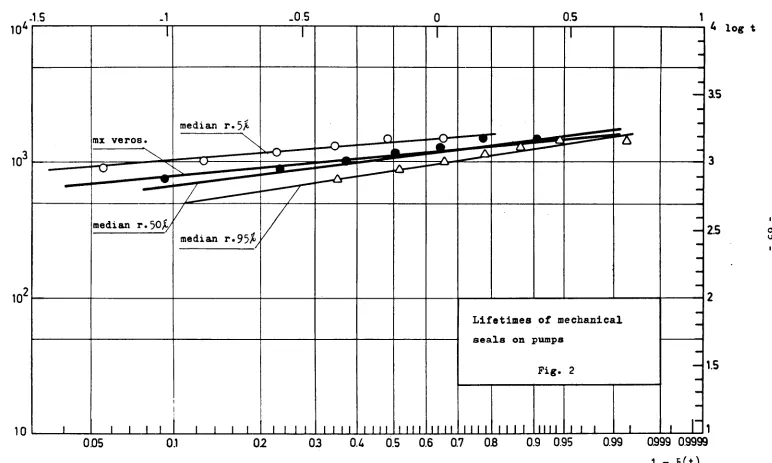
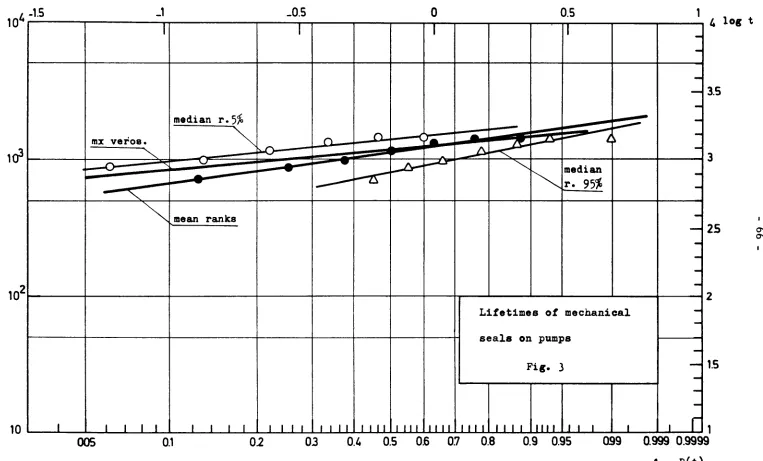
5.2 Mechanical Seals on Pumps
A series of endurance tests yielded the following
results:
t. (hours)
750, 900, 1018, 1200, 1250, 1500, 15OO,
Assuming a Weibull distribution, we obtain the following expres
sions for the reliability:
a. with the max. likelihood method
R(t) exp ( (^l^)5·09)
b. with mean ranks plotting position on probability paper
R(t) exp ( ( τ ^ )3 , 5)
o. with median ranks plotting position on probability paper
R(t) « exp ( (:j§õõ)3'9)
The corresponding straight lines are shown in Figs. 2 and
3* The table below gives the timetofallure values with the three
methods for set reliability values.
'.95
'.99
max.
likelihood
700
515
mean ranks
56O
355
median ranks
596
On the other hand with a set mission time of 600 hours, the maximum-likelihood method gives a reliability value of .979 and the lower limit, with confidence level 95$ is:
.979 - o*R 1.65 = .932
where 6T » 8.02.10- is the variance of R(600) calculated from (3D, Section 2.
For Τ at 600 h the non-parametric methods give .954 (median ranks) and 0.937 (mean ranks). The lower limit, with confidence level 95$, calculated by extrapolating the 0.95 ranks, is .82.
5*3 Electromagnetic Valves
A set of twelve electromagnetic valves was reduced to six components in working order after a service of 3250 hours. The failure times of the eliminated components were:
t. (hours)
1200, 1450, 2100, 2600, 3000, 3250
This sample cannot be treated by the maximum-likelihood method because the information contained in the fact that six valves are still working would be lost. With the non-parametric methods, however, this information can be taken into account and the reliability estimate is naturally different from what it would be if a sample of six were considered.
Again assuming a Weibull distribution, the use of probab ility papers gives a reliability estimate in accordance with the following expressions:
a^ plotting with mean ranks
_,.» , ,_t Λ 1.854*
R(t) . exp (- (1J555)
y)
b. plotting with median ranks
R(t) - exp (- ( ^ )2·2 3)
For set reliability values, the two estimates give the following values:
mean median ranks ranks
te 9 5 900 1050
t# 9 9 357 510
5.4 Comments on the Results Obtained with the Various Methods It emerges very clearly from the results that for the lower extreme values of the distribution
- the maximum-likelihood method gives more optimistic results than the median ranks method, which in turn gives more optimistic results than the mean ranks method;
- the difference between the results obtained with the various methods increases directly with the reliabil-ity sought and inversely with the Weibull distribution parameter at;
- these differences in results are not tied to the sample size but rather depend on the statistical behaviour of the extreme values, which is evaluated differently with each method.
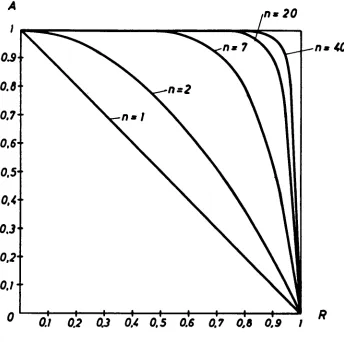
It amounts to obtaining a reliability estimate with a confidence level AC 0.5·
For, referring ot (5), Section 3, and considering the first value of an ordered sample, we have:
Λ,(ρ) = 1 - (1 - p )n
or, calling the confidence level A and the reliability R:
A » 1 - Rn
This relation is graphed in Fig. 6 in respect of various values of n. The median rank relating to the lower end of the sample is obtained, for each n, from the intersection of the corresponding curve with the horizontal A « 0.5· If, however, the points corresponding to the reliability estimated with the mean rank are plotted on the curves, it will be seen that these estimates are equivalent to those obtained from (5), Section 3, for A> 0.5· If the maximum-likelihood estimates were plotted instead, one would find values for A smaller than 0.5· Another interesting consideration is that, in Fig. 6, the curves grow denser as η increases. This means that, given a certain value for the confidence level A, the reliability gain in the extreme sample value is progressively slighter as η increases; hence
BIBLIOGRAPHY
1 David K. Lloyd, M. Lipow: Reliability, Prentice Hall, 1962 2 L.G. Johnson: The median ranks of sample values in their
population with an application to certain fatigue studies. Industrial mathematics, 2, 1951, 1-9
3 L.G. Johnson: The statistical treatment of fatigue experiments, Elsevier, 1964
4 E.J. Gumbel: Statistics of extremes, Columbia University Press, New York 1958
5 W« Weibull: Fatigue testing and the analysis of results, Pergamon Press 1961
6 R.E« Barlow, F. Proschan: Mathematical theory of reliability, John Wiley, I965
7 Mood, Graybill: Introduction to the theory of statistics 8 P. Dore: Introduzione al calcolo della probabilità, Patron,
1962, pag. 246
9 M. Fisz: Probability theory and mathematical statistics, John Wiley & Sons, New York I963
10 Cramer: Mathematical methods of statistics
11 A.E. Green, A.J. Bourne: Safety assessment with reference to automatic protective systems for
nuclear reactors, AASB(S) RII7 part 2, p. 190
12 G.B. Massera, C. Mustacchi: Life expectancy analysis and rank tables, Int. Rep. Euratom 1092, February I967
APPENDIX 1 - Description of KTEST code
With reference to Section 2.3.2, the KTEST code, written in FORTRAN H for IBM 36O/65, performs the Kolmogoroff test on the Weibull, normal, log-normal and exponential distributions. The estimated distributions are determined from the sample data by the method of probability papers, i.e., the fitting to the data is done with the linearized form of the distribution (Section 4), after each sample value has been assigned its appropriate proba bility according to the non-parametric method selected.
The code performs the following operations:
a) It defines the regression variables for each of the distributions studied and calculates their values to correspond with the
sample data.
b) It performs the fitting by the least-squares method (minimizing the deviations of the measured variable) and then determines an estimate of the parameters of each distribution.
c) It calculates the cumulative probabilities appropriate to the sample values, using the estimated distribution.
d) It performs the Kolmogoroff test, comparing the calculated probabilities and those assigned to the sample values by the non-parametric method adopted.
The regression variables χ , y. are defined as follows, t. being the i-th value of the ordered sample and P, the probability value attributed to t.:
1. Weibull distribution
1 x± = log t± y± = log ln 1 _ p
2. Normal distribution
χ. = t. y. obtained by solving the equation
_1 fy± n2
e η dn + 0.5 P. = 0 o
3. Lognormal distribution
χ. = log t. y. as for the normal distribution
4, Exponential distribution
xi ■ *i y±= l o8 TZ ρ
1_
Ρ
i
The regression in every case is of the form y = oKx β)«
The coefficients of, (i> , tied to the distribution parameters, are
determined by the leastsquares method.
In applying the test the boundary level of significance
is determined for each distribution, i.e., the level that consti
tutes the upper limit of the probability with which the distri
bution hypothesis can be accepted. Hence the data are interpreted
best from the distribution that has the highest boundary level of
significance. Referring to Section 2.3.2, this level is given by
ot ■ 1 Q(A)
where λ = D /η and 0(λ) is the function (12).
η
¿iubprogrammes employed:
1. FUNCTION ZER0(A1, B1, P, PREC)
Calculates by the bisection method the regression variable y
in the case of normal or lognormal distribution. A1, B1 are
(A1 at -3, B1 s 3), Ρ is the value of the non-parametric estimate, PREC is the precision with which y is obtained.
2. FUNCTION DMAX(A,K)
Calculates the largest of the values (all positive) of a matrix A of Κ dimensions. It is used to determine D ,
η
the maximum difference between the calculated probabili' and that attributed to the generic value of the sample.
3. FUNCTION Q(Y)
Calculates the value of the asymptotic distribution of D / η , for a given Y, with reference to (12) of Section η 2.3.2.
This subprogramme is supplied by the IBM library under the name of SUBROUTING SMIRN. Reference should be made to the library for a description of the method employed.
Input data
Ν Sample size (max 40)
ND Number of distributions examined
VITA(J) Matrix of sample values