Finite Element Simulation of a Doubled Process of Tube
Extrusion and Wall Thickness Reduction
Ahmed S. M. J. Agena
Department of Mechanical Engineering, High Institute of Polytechnic in Zawia, Zawia City, Libya Email: [email protected]
Received June 5,2013; revised July 18, 2013; accepted August 5, 2013
Copyright © 2013 Ahmed S. M. J. Agena. This is an open access article distributed under the Creative Commons Attribution License, which permits unrestricted use, distribution, and reproduction in any medium, provided the original work is properly cited.
ABSTRACT
This research deals with the forward extrusion process of tubes. In this process, a piercing process was carried out on the billet to produce the tube, followed directly by a reduction in the wall thickness. A specific geometrical shape for the piercing zone and the wall thickness reduction zone were chosen and designed. The effects of the redundant shear strain and the magnitude of the extrusion load were investigated and simulated with the finite element method using Q Form software program. Lead was used as model materials since (if the experiments were carried out at room tem- perature) it has the similar behavior of the steel at high temperature. The results obtained have shown that at the pierc- ing zone, the lowest values of the extrusion load, the redundant strain, the total strain and the finite element effective strain were when a piercing tool (mandrel) of (C = 1.1) was used. While, at the die zone, the lowest values of the extru- sion load, the redundant strain, the total strain was when a die of (C = 0.9) was used.
Keywords: Tube Extrusion; Die Design; Finite Element Method
1. Introduction
In the materials science, deformation is a change in the shape or size of an object due to an applied force. This can be a result of tensile (pulling) forces, compressive (pushing) forces, shear, bending or torsion (twisting). Deformation is often described as strain.
As deformation occurs, internal inter-molecular forces arise which oppose the applied force.
In the extrusion process, mechanical properties of the material, frictional condition at the tool—workpiece in-terface, extrusion ratio and die profile are among the im- portant parameters that significantly affect the desired characteristics of the product [1]. One of the most im- portant factors in a forming operation is the profile of the deformation zone; it is an important parameter for opti- mizing a process variable, such as extrusion pressure [2].
Extrusion die profiles can be conical or curved. In the past, due to the difficulty in the manufacture of non- conical dies, most research concerned the optimization of rod extrusion die geometry, focused on conical dies [3], but in recent year due to the presence of modern ma- chines such as the CNC machines, the curved dies were
produced and used.
A mathematical formula has been developed to calcu- late and analysis the strain, redundant strain and geome- try factor for the deformation process [4].
In this work the extrusion process has been carried out on lead metal using a special dies which designed with the constancy of ratio of successive generalized homo- geneous strain increment (C.R.H.S) [5] and compared with finite element method.
This paper is divided into five main sections, namely: The first part is the introduction where we dealt with previous research on the subject and the basics of the extrusion process; the second part is a theoretical back- ground, fundamentals and mathematical equations of the research topic; the third part was about the experimental equipments and procedure where we dealt with how the extrusion set were produced for the extrusion process; the fourth part dealt with the results and discussion and the fifth part was dealt with the conclusion in addition to the references.
2. Theoretical Background
2.1. Constancy of Ratio of Successive Generalized Homogeneous Strain Increments (C.R.H.S)
In this hypothesis, the ratio of homogeneous strain of the successive sections of the deformation zone is constant, where the deformation zone (in the die and piercing) is divided into several sections and numbered as (0, 1, 2, 3… n-1, n), as shown in Figure 1. Where Df is the outer
diameter of the tube, D0 is the inner diameter of the tube, tf is the final thickness of the tube, t0 is the initial thick- ness of the tube.
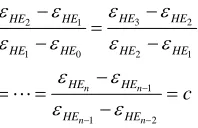
The mathematical expression of this hypothesis is
3 2
2 1
1 0 2
1
1 2
n n
n n
1
HE HE HE HE
HE HE HE HE
HE HE
HE HE
c
(1)
where HE is the total (effective) homogeneous strain,
is constant depends on a type of (C.R.H.S). These values are equal:
c
c > 1 when the strain ratio is accelerated
c = 1 when the strain ratio is uniform
c < 1 when the strain ratio is decelerated
2.2. Strains Calculation
Within the deformation process, two types of strains are obtained:
1) Homogeneous strains 2) Redundant strain.
This can be calculated as below.
2.2.1. Homogeneous Strains
The total (effective) homogeneous strain (HE) equation
can be writing as:
12 2
2 2
3 2
HE HL HR HC
(2)
t0
tf
D0
Df
Die
0 1 2 n
tn
Figure 1. A schematic showing the dividing of the deforma- tion zone in tube extrusion part.
2.2.2. Redundant Strain Calculation
This type of strain, also including a strain on the three directions
1) Longitudinal redundant strain RL
2) Circumference redundant strain RC
3) Torsion redundant strain RT
These strains can appear in some deformation process such as double rolling of tube or any deformation process that includes tension stress combined with torsion stress.
In tube extrusion, only the longitudinal redundant strain occurs. This strain can be calculated as:
cot
RL
S t
(3)
where is the angle of grid lines, t is the tube thick- ness, and S is the sliding length of the grid lines in the
deformation zone as shown in Figure 2. Where parallel
lines of a grid are printed on the surface of one half of the sample, these lines are perpendicular to the direction of the center line of the sample. As shown in Figure 3.
2.2.3. Total Strain Calculation
The total strain T is including homogeneous and re-
dundant strains which can be calculated as:
2
2 0.52 3 1
3 2 2
T HE RL
(4)
0 1 Piercing
Container
Belt
25
°
5,18
t
50,59
[image:2.595.125.224.240.304.2]S Grid line
Figure 2. The angle of grid lines.
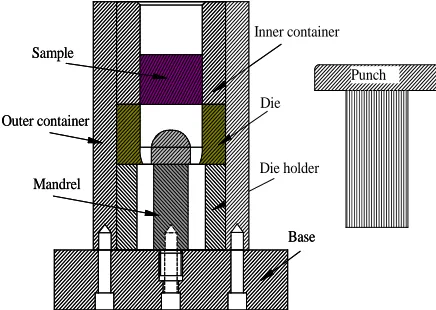
[image:2.595.61.290.547.705.2]3. Experimental Equipments and Procedure
In this work, a special extrusion device was designed and manufactured. This device contains dies (cutting into two half); piercing (mandrel), piston, inner container and outer container, as shown in Figure 4.
3.1. Die Design
The Equation (4) becomes a logarithmic formula as:
ln
HT Zn
(5)
where Znis a function depended on the D0 and tn.
To produce the dies, the curves of deformation zone in these dies should be determined by calculating the values of n at all section of deformation zone from equation
below [4]. t
2 3 0 0 0 0 2 2 1 11 1 3 3
1 1 2 2
1 1 3 3 n n n n n Z (6) where
2 0 2
0.50 0
3 2
2 3 3
n n
n n
t D
t t D D
(7)
and
0 0
0 0.5
2 2
0 0 0 0
3 2
2 3 3
t D
t t D D
(8)
where is the initial thickness of the tube and D0 is the inner diameter of the tube.
0
t
To apply (C.R.H.S), the vales of Zn should be deter-
mined for all values of . In this work the values of the constant were chosen as:
[image:3.595.57.292.290.468.2]c c Sample Mandrel Base Die holder Die Inner container Outer container Sample Mandrel Base Punch Outer container
Figure 4. Assembly of extrusion device-set.
c = 1.1 when the strain ratio is accelerated
c = 1.0 when the strain ratio is uniform
c = 0.9 when the strain ratio is decelerated
The value of the initial thickness 0 and the thickness of the tube at the first section ( ) can be calculated from [6]:
t
1
t
1
t mt0 (9)
where
m
(0.95 - 0.995). [6].In this work
m
0
0.95 were chosen. And then calcu- late the values of , 1 andZ1.
The values of Zn can be calculated as:
1 2 3 0
1
n n n
c c c c
n
Z Z
(10)
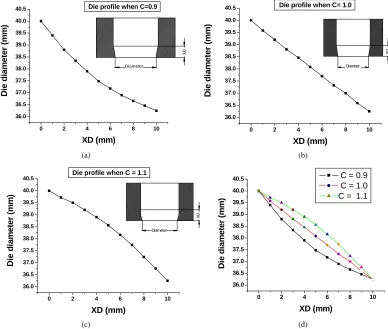
The deformation zone of the dies was dividing into 10 sections; every section is 1 mm in length. The thickness of the tube can be calculated at all section, and then the profile of the deformation zone of the dies can be deter- mined from:
0 2
n
D D tn (11)
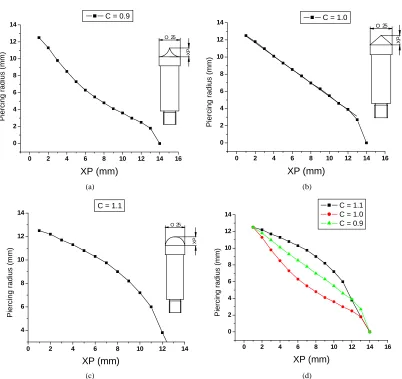
3.2. Piercing Design
By the same method, the profile of the piercing (mandrel) can be determined. The formula of Zn is [7-8].
2 1 3 0 0 8 1 3 3 2 n J K ZK J K J
K D J
(12) where:
0 0.5 2 2 0 0 22 3 3
n
n n
J t
K t t 0
(13)
0
[image:3.595.308.539.406.538.2] [image:3.595.61.279.557.712.2] is the inner diameter of container as shown in
Figure 5.
From the Figure 5, the diameter of the piercing (man- drel) at all sections can be determined from:
0 2
n tn
(14)
0 1 23 n Piercing
Container Belt 35 ,37 5,1 8 tn
Three dies and three piercing were produced. As shown in Figure 6.
From the calculation, the profiles of the dies and the piercing (mandrels) were obtained as shown in the Fig- ures 7 and 8 respectively.
3.3. Material and Specimens
The samples were made from Lead because it has me- chanical properties like steel in high temperature [9]. The samples were compressed with a special dies to get high accurate dimensions and to get rid of the porous. The
chemical composition of this alloy is given in Table 1.
3.4. Finite Element Simulations
In this work, the finite element method was used to
simulate the forward extrusion of tube processes for all types of the dies and the piercing using Q-form software. In this software, a hydraulic press was applied, with co- efficient of friction of 0.2 between the die and the billet at room temperature. The software was provided with materials data that were obtained from the upsetting test.
(a) (b)
Figure 6. (a) The three types of the piercing (mandrels); (b) workspaces.
0 2 4 6 8 10
36.0 36.5 37.0 37.5 38.0 38.5 39.0 39.5 40.0 40.5
10
O
36,46 O
XD
Diameter
D
ie d
ia
m
ete
r (
m
m
)
XD (mm)
Die profile when C=0.9
0 2 4 6 8 10
36.0 36.5 37.0 37.5 38.0 38.5 39.0 39.5 40.0 40.5
10
O
36,25 O
XD
Diameter
Die profile when C= 1.0
D
ie d
ia
m
eter (m
m
)
XD (mm)
(a) (b)
0 2 4 6 8 10
36.0 36.5 37.0 37.5 38.0 38.5 39.0 39.5 40.0 40.5
10O
36,44 O
XD
Diameter
D
ie d
iam
eter
(
m
m
)
XD (mm) Die profile when C = 1.1
0 2 4 6 8 10
36.0 36.5 37.0 37.5 38.0 38.5 39.0 39.5 40.0 40.5
D
ie diam
e
te
r
(m
m
)
XD (mm)
C = 0.9 C = 1.0 C = 1.1
(c) (d)
[image:4.595.109.493.233.361.2] [image:4.595.103.491.391.720.2]0 2 4 6 8 10 12 14 16 0
2 4 6 8 10 12 14
9,
88
O
25 O
XP
Pi
er
cin
g
ra
di
us
(mm)
XP (mm)
C = 0.9
0 2 4 6 8 10 12 14 16 0
2 4 6 8 10 12 14
9,
88
O
25 O
XP
P
ier
c
ing
r
a
di
u
s
(
m
m)
XP (mm)
C = 1.0
(a) (b)
0 2 4 6 8 10 12 14
4 6 8 10 12 14
9,93
O
25 O
XP
Pie
rci
ng rad
ius
(m
m)
XP (mm)
C = 1.1
0 2 4 6 8 10 12 14 16 0
2 4 6 8 10 12 14
P
ie
rci
ng
ra
di
us
(m
m
)
XP (mm)
C = 1.1 C = 1.0 C = 0.9
(c) (d)
[image:5.595.99.501.77.456.2]Figure 8. (a) Piercing profiles with (C = 0.9); (b) Piercing profiles with (C = 1.0); (c) Piercing profiles with (C = 1.1); (d) All piercing profiles.
Table 1. Chemical Composition of Pb (wt %).
Pb Cu Fe Ag Mn Si Ni
99.5 0.03 0.001 0.001 0.0005 0.001 0.001
4. Results and Discussion
4.1. Experimental Extrusion Load
Extrusion load depends on several factors including: The amount strain in the sample.
The amount of the yield stress of the sample material.
The friction force between the outer surface of the
sample and the inner surface of the extrusion dies.
The geometry of the sample and the geometry of the
extrusion zone.
Practical results have shown us that the largest value of the extrusion load at the beginning of the process was when the piercing of (C = 0.9) with the die of (C =1.0) were used, and the lowest value of the extrusion load was when the piercing of (C = 1.1) with the die of (C =1.1)
were used.While, the largest value of the extrusion load was when the piercing of (C = 1.0) with the die of (C = 1.0) were used, and the lowest value for the extrusion load was when the piercing of (C = 1.1 ) with the die of (C = 0.9 ) were used at the end of the process. As shown in Figure 9.
4.2. Experimental Redundant Strain
The quality and efficiency of deformation process are depending on the amount of the redundant strains in the microstructure of the material that resulting from this process. As the redundant strains are small, the produc- tion process is perfect.
In the present, the longitudinal redundant strain was calculated for all samples as shown in Figure 9.
[image:5.595.60.287.512.542.2]0 5 10 15 20 25 30 0
10 20 30 40 50 60 70 80
90 Die with (C = 1.1) Die with (C = 1.0) Die with (C = 0.9)
Ex
tr
us
ion load
(KN)
Ram displacment (mm)
0 5 10 15 20 25
0 10 20 30 40 50 60 70 80
90 Die with (C = 1.1)
Die with (C = 1.0) Die with (C = 0.9)
Ext
rusion
load (
K
N)
Ram displacment (mm)
(a) (b)
0 5 10 15 20 25 30
0 20 40 60 80
Extru
s
io
n Lo
ad (
K
N)
Ram displacment (mm)
Die with (C = 1.1) Die with (C = 1.0) Die with (C = 0.9)
0 2 4 6 8 10 12 14 16 18 20 22 24
0 10 20 30 40 50 60 70 80 90
Ex
trusio
n
lo
ad
(K
N)
Ram displacment (mm)
Piercing (C = 0.9 ) with Die (C = 1.1) Piercing (C = 0.9 ) with Die (C = 1.0) Piercing (C = 0.9 ) with Die (C = 0.9) Piercing (C = 1.0 ) with Die (C = 1.1) Piercing (C = 1.0 ) with Die (C = 1.0) Piercing (C = 1.0 ) with Die (C = 0.9) Piercing (C = 1.1 ) with Die (C = 1.1) Piercing (C = 1.1 ) with Die (C = 1.0) Piercing (C = 1.1 ) with Die (C = 0.9)
(c) (d)
Figure 9. (a) Extrusion-load when using the piercing of (C = 0.9) with the three dies; (b) Extrusion-load when using the piercing of (C = 1.0) with the three dies; (c) Extrusion-load when using the piercing of (C = 1.1) with the three dies; (d) Ex- trusion-load for all process.
the die of (C =1.1) were used. While, at the end of the process, the largest value of the redundant strain was when the piercing of (C = 1.1) with the die of (C =1.0) were used, and the lowest value for redundant strain was when piercing of (C = 0.9) with the die of (C = 0.9) were used. As shown in Figure 10.
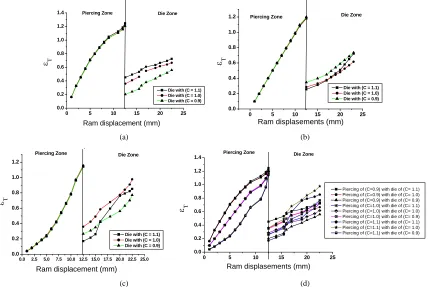
4.3. Experimental Total Strain
From the practical results it is found that all the curves of the total strain took the same form of homogeneous strain at the beginning of the process in the piercing zone. While, in the dies zones, the values of the total strain were heterogeneous and depend on the piercing profile. The explanation is that the values of total strain in the piercing zone are depending on the amount of the ho- mogenous strain because the values of redundant strain were small, while, at the die zone, the values of redun- dant strain are relatively large.
It was shown that the largest value of total strain at the
piercing zone was when the piercing of (C = 0.9) with
the die of (C = 1.1) were used, and the lowest value of
the total strain at the piercing zone was when the piercing of (C = 1.1) with the die of (C = 0.9) were used. While, at the die zone, the largest value of the total strain was when the piercing of (C = 1.1) with the die of (C = 1.0) were used, and the lowest value for total strain was when piercing of (C = 0.9) with the die of (C = 0.9) were used. As shown in Figure 11.
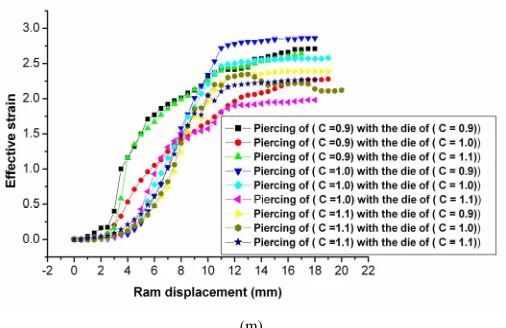
4.4. Finite Element (FE) Effective Strain
From finite element result, it reported that the largest value of effective strain at the piercing zone was when the piercing of (C = 0.9) with the die of (C = 0.9) were used, and the lowest value of the effective strain at the
piercing zone was when the piercing of (C = 1.1) with
the die of (C = 0.9) were used. While, at the die zone, the largest value of the effective strain was when the piercing of (C = 1.0) with the die of (C = 0.9) were used, and the lowest value for effective strain was when piercing of (C = 1.0) with the die of (C = 1.1) were used. As shown in
[image:6.595.91.514.83.437.2]0 5 10 15 20 25 0.0
0.2 0.4 0.6 0.8 1.0 1.2
Die with C = 0.9) Die with C =1.0) Die with C =1.1)
Ram displacement (mm)
RL
0 5 10 15 20 25 0.0
0.2 0.4 0.6 0.8 1.0 1.2
RL
Ram displacement (mm)
Die with C = 0.9) Die with C =1.0) Die with C =1.1)
(a) (b)
0 5 10 15 20 25
0.0 0.2 0.4 0.6 0.8 1.0 1.2 1.4
1.6 Die with C = 0.9) Die with C =1.0) Die with C =1.1)
RL
Ram displacement (mm)
0 5 10 15 20 25
0.0 0.2 0.4 0.6 0.8 1.0 1.2 1.4 1.6
RL
Ram displacement (mm)
Piercing (C = 0.9 ) with Die (C = 1.1) Piercing (C = 0.9 ) with Die (C = 1.0) Piercing (C = 0.9 ) with Die (C = 0.9) Piercing (C = 1.0 ) with Die (C = 1.1) Piercing (C = 1.0 ) with Die (C = 1.0) Piercing (C = 1.0 ) with Die (C = 0.9) Piercing (C = 1.1 ) with Die (C = 1.1) Piercing (C = 1.1 ) with Die (C = 1.0) Piercing (C = 1.1 ) with Die (C = 0.9)
(c) (d)
Figure 10. (a) Redundant strain when using the piercing of (C = 0.9) with the three dies; (b) Redundant strain when using the piercing of (C = 1.0) with the three dies; (c) Redundant strain when using the piercing of (C = 1.1) with the three dies; (d) Redundant strain for all piercing.
0 5 10 15 20 25
0.0 0.2 0.4 0.6 0.8 1.0 1.2
1.4 Piercing Zone Die Zone
Die with (C = 1.1) Die with (C = 1.0) Die with (C = 0.9)
Ram displacement (mm)
T
0 5 10 15 20 25 0.0
0.2 0.4 0.6 0.8 1.0
1.2 Piercing Zone Die Zone
Die with (C = 1.1) Die with (C = 1.0) Die with (C = 0.9)
T
Ram displasements (mm)
(a) (b)
0.0 2.5 5.0 7.5 10.0 12.5 15.0 17.5 20.0 22.5 25.0 0.0
0.2 0.4 0.6 0.8 1.0 1.2
Die with (C = 1.1) Die with (C = 1.0) Die with (C = 0.9)
Die Zone Piercing Zone
Ram displacement (mm)
T
0 5 10 15 20 25
0.0 0.2 0.4 0.6 0.8 1.0 1.2 1.4
T
Ram displasements (mm)
Piercing Zone Die Zone
Piercing of (C=0.9) with die of (C= 1.1) Piercing of (C=0.9) with die of (C= 1.0) Piercing of (C=0.9) with die of (C= 0.9) Piercing of (C=1.0) with die of (C= 1.1) Piercing of (C=1.0) with die of (C= 1.0) Piercing of (C=1.0) with die of (C= 0.9) Piercing of (C=1.1) with die of (C= 1.1) Piercing of (C=1.1) with die of (C= 1.0) Piercing of (C=1.1) with die of (C= 0.9)
(c) (d)
[image:7.595.143.453.81.360.2] [image:7.595.83.513.412.699.2]
(a) (b) (c)
0 2 4 6 8 10 12 14 16 18 20
0.0 0.5 1.0 1.5 2.0 2.5 3.0
E
ff
ec
ti
v
e st
rai
n
Ram displacement (mm)
Piercing of ( C =0.9) with the die of ( C = 0.9) Piercing of ( C =0.9) with the die of ( C = 1.0) Piercing of ( C =0.9) with the die of ( C = 1.1)
(d) (e) (f)
0 2 4 6 8 10 12 14 16 18 20
0.0 0.5 1.0 1.5 2.0 2.5 3.0
E
ff
e
c
ti
v
e st
ra
in
Ram displacement (mm)
Piercing of ( C =1.0) with the die of ( C = 0.9) Piercing of ( C =1.0) with the die of ( C = 1.0) Piercing of ( C =1.0) with the die of ( C = 1.1)
(g) (h) (i)
0 2 4 6 8 10 1
0.0 0.4 0.8 1.2 1.6 2.0 2.4
2
E
ff
e
ct
iv
e st
ra
in
Ram displacement (mm)
Piercing of ( C =1.1) with the die of ( C = 0.9) Piercing of ( C =1.1) with the die of ( C = 1.0) Piercing of ( C =1.1) with the die of ( C = 1.1)
(m)
Figure 12. (a) FE-effective strain distribution when using the piercing of (C = 0.9) with the die of (C = 0.9); (b) FE-effective strain distribution when using the piercing of (C = 0.9) with the die of (C = 1.0); (c) FE-effective strain distribution when us-ing the piercus-ing of (C = 0.9) with the die of (C = 1.1); (d) FE-effective strain when using piercing of (C = 0.9) with the three dies; (e) FE-effective strain distribution when using the piercing of (C = 1.0) with the die of (C = 0.9); (f) FE-effective strain distribution when using the piercing of (C = 1.0) with the die of (C= 1.0); (g) FE-effective strain distribution when using the piercing of (C = 1.0) with the die of (C = 1.1); (h) FE-effective strain when using piercing of (C = 1.0) with the three dies; (i) FE-effective strain distribution when using the piercing of (C = 1.1) with the die of (C = 0.9); (j) FE-effective strain distri- bution when using the piercing of (C = 1.1) with the die of (C = 1.0); (k) FE-effective strain distribution when using the pierc-ing of (C = 1.1) with the die of (C = 1.1); (l) FE-effective strain when using piercing of (C = 1.1) with the three dies; (m) FE- effective strain for all piercing with all dies.
5. Conclusion
[3] B. Barisic, G. Cukor and M. Math, “Estimate ofCon-sumed Energy at BackwardExtrusion Process by Means
of Modeling Approach,” Journal of Materials Processing
Technology, Vol. 153-154, 2004, pp. 907-912.
doi:10.1016/j.jmatprotec.2004.04.017
This work investigated the mechanical behavior of lead material formed by forward extrusion of tube. From ex- perimental tests, we observed that at the piercing zone, the minimum values of extrusion load, redundant strain, total strain and finite element effective strain was when piercing (mandrel) of (C = 1.1) were used, and the largest value of total strain at the piercing zone was when the piercing of (C = 0.9) were used. While, at the die zone, the minimum values of extrusion load, redundant strain, total strain and was when the die of (C = 0.9) were used, and the largest value of total strain at the piercing zone was when the piercing of (C = 1.0) were used.
[4] P. V. Vaidyanathan and T. Z. Blazynskim, “A Theoretical
Method of Efficient Extrusion, Die Design,” Journal of
the Institute of Metals, Vol. 101, 1973, pp. 79-84.
[5] W. A. Khudheyera, D. C. Bartona and T. Z. Blazynskia,
“Pass Geometry and Macroshear Redundancy Effects in a 3-Roll Conical Oblique Tube Piercin Process,” Journal of
Materials Processing Technology, Vol. 45, No. 1-4, 1994,
pp. 341-345.
[6] A. K. A. Al-Dahwi and T. Z. Blazynski, “Inhomogeneity
of Flow, Force Parameters and Pass Geometry in Rotary
Cone-Roll Tube Piercing,” Materialwissenschaft und
Werkstofftechnik, Vol. 23, No. 1, 1992, pp. 29-38.
doi:10.1002/mawe.19920230109
REFERENCES
[1] B. Avitzur, “Metal Forming Processes and Analysis,” Mc
Graw Hill, New York, 1968. [7] T. Z. Blazynskim, “Theoretical Method of Design Tools for Metal Forming Process,” Metal Forming, Vol. 34, No. 5, 1976, pp. 143-150.
[2] M. Sabor, M. Bakhshi-Joobari, M. Noorani-Azad and A.
Gorji, “Experimental and Numerical Study of Energy Consumption in Forward and Backward Rod Extrusion,”
Journal of Materials Processing Technology, Vol. 177,
No. 1-3, 2006, pp. 612-616. doi:10.1016/j.jmatprotec.2006.04.031
[8] http://www.qform3d.com/en/1.html
[9] N. Loizon and R. B. Sims, “The Yield Stress of Pure
Lead in Compression,” Journal of the Mechanics and
[image:9.595.172.425.83.247.2]