www.hydrol-earth-syst-sci.net/13/1993/2009/ © Author(s) 2009. This work is distributed under the Creative Commons Attribution 3.0 License.
Earth System
Sciences
Examining the effect of pore size distribution and shape on flow
through unsaturated peat using computed tomography
F. Rezanezhad1, W. L. Quinton1, J. S. Price2, D. Elrick3, T. R. Elliot3, and R. J. Heck3 1Cold Regions Research Centre, Wilfrid Laurier University, Waterloo, Canada
2Department of Geography, University of Waterloo, Waterloo, Canada
3Department of Land Resource Science, University of Guelph, Guelph, Canada
Received: 30 April 2009 – Published in Hydrol. Earth Syst. Sci. Discuss.: 15 May 2009 Revised: 5 October 2009 – Accepted: 13 October 2009 – Published: 28 October 2009
Abstract. The hydraulic conductivity of unsaturated peat soil is controlled by the air-filled porosity, pore size and geo-metric distribution as well as other physical properties of peat materials. This study investigates how the size and shape of pores affects the flow of water through peat soils. In this study we used X-ray Computed Tomography (CT), at 45µm resolution under 5 specific soil-water pressure head levels to provide 3-D, high-resolution images that were used to detect the inner pore structure of peat samples under a changing water regime. Pore structure and configuration were found to be irregular, which affected the rate of water transmis-sion through peat soils. The 3-D analysis suggested that pore distribution is dominated by a single large pore-space. At low pressure head, this single large air-filled pore imparted a more effective flowpath compared to smaller pores. Smaller pores were disconnected and the flowpath was more tortuous than in the single large air-filled pore, and their contribution to flow was negligible when the single large pore was ac-tive. We quantify the pore structure of peat soil that affects the hydraulic conductivity in the unsaturated condition, and demonstrate the validity of our estimation of peat unsaturated hydraulic conductivity by making a comparison with a stan-dard permeameter-based method. Estimates of unsaturated hydraulic conductivities were made for the purpose of test-ing the sensitivity of pore shape and geometry parameters on the hydraulic properties of peats and how to evaluate the structure of the peat and its affects on parameterization. We also studied the ability to quantify these factors for differ-ent soil moisture contdiffer-ents in order to define how the factors controlling the shape coefficient vary with changes in soil
Correspondence to: F. Rezanezhad
water pressure head. The relation between measured and es-timated unsaturated hydraulic conductivity at various heads shows that rapid initial drainage, that changes the air-filled pore properties, creates a sharp decline in hydraulic conduc-tivity. This is because the large pores readily lose water, the peat rapidly becomes less conductive and the flow path among pores, more tortuous.
1 Introduction
Equations relating permeability to other measurable prop-erties of porous materials are used in the various fields of re-search concerned with the flow of water, oil or gases through soils, porous rocks etc., and can be applied to peat. Hub-bert (1956) showed that Darcy’s law can be derived as a spe-cial case of the Navier-Stokes equation by considering the relationships between driving and resisting forces at the mi-croscopic scale, and expressed the relationship between hy-draulic conductivity (K[L T−1]) and permeability by:
K=K∗ρ g
µ (1)
where K∗[L2] is the intrinsic permeability of a porous medium, ρ[M L−3] is the fluid density, g(=9.8 L T−2) is gravitational acceleration, andµ[M L−1T−1] is the dynamic viscosity of the fluid. Sinceρ andµare known for a given temperature, the challenge lies in defining the factors con-trolling the permeability.
It is well known that the permeability of an individual pore is proportional to the square of its diameter, and numerous formulae have been proposed to estimate the permeability of a porous medium from its mean pore diameter (e.g. Carrier, 2003). The pore size distribution of a soil is often inferred from its particle size distribution. This is a practical ap-proach for mineral soils as their particles consist of readily-definable, individual grains. Permeability also depends on other pore properties such as their shape, number, orientation and continuity. Numerous theoretical and empirical attempts have been made to define the relation between permeability and these factors, often with the use of a single coefficient. For instance, Hazen (1911) suggested the approximation;
K∗=cD2 (2)
where c is a dimensionless coefficient representing the sphericity or roundness of the grains/pores; and D[L] is the mean pore or grain diameter. The widely-used Kozeny-Carman equation (proposed by Kozeny, 1927 and later mod-ified by Carman, 1937) also relies on a dimensionless coeffi-cient to account for the grain/pore shape coefficoeffi-cient (Carrier, 2003):
K∗=c D
2φ3
(1−φ)2 (3)
whereφ[–] is the water-filled porosity,c[–] is the grain/pore shape coefficient, andD[L] is the representative mean water-filled pore or grain diameter.
The aforementioned formulae are all founded on the as-sumption that soil pores are circular in cross-section, and de-pend on a single empirical or theoretical coefficient to cor-rect for the non-circularity of pores and other geometric pore properties, with the exception of their diameter which is in-ferred. This approach was necessary as the ability to visu-alise grains and pore spaces in detail was very limited. How-ever, new visualisation techniques offer the opportunity to
directly measure porous media properties that hitherto could be only be measured or derived theoretically. For example, a recent study on microscopic image analysis of peat thin sec-tions related permeability to the measured geometric mean pore diameter,dG[L]:
K∗=2dG2/C (4)
whereC=2/cis a dimensionless coefficient that relates a fric-tion factor (f) and the Reynolds’ number (NR) in the
well-known Darcy Weisbach expression, f=C/NR (Quinton et
al., 2000, Eq. 5). They found that when the saturated zone is confined within either the upper peat layer or the lower, more decomposed layer, C tended to reasonably constant values equal toC=∼300 andC=∼14 500 respectively. The large difference inCconfirmed that the larger-diameter soil pores of the living vegetation and lightly decomposed peat near the ground surface offer much less resistance to water motion than the finer-grained peat deeper in the profile. While this study directly measured pore size, it still relied on a coeffi-cient to represent all other geometric pore properties.
A subsequent study directly measured pore cross-sectional areas and perimeters on microscopic images of peat thin sec-tions, and from their ratio computed the hydraulic radiusR
of all measured pores (Quinton et al., 2008). The authors usedRin the well-known Hagen-Poiseuille formula (White, 1974) to represent both pore size and shape in the estima-tion of permeability, and showed that its value decreases with depth below the ground as pores are compressed by the over-lying sediments. By directly measuring pore shape and size, the dependence on a coefficient to define pore properties was reduced.
Image analyses of 2-D thin sections provides little infor-mation on unsaturated flow and storage processes, since all water is removed during sample preparation. However, X-ray computed tomography (CT) imaging (Salem and Chilin-garian, 1999) provides a new opportunity to evaluate the pore geometry of peat samples in 3-D. Kettridge and Bin-ley (2008) examined the potential of using X-ray computed tomography to analyse individual biogenic gas bubbles en-trapped within Sphagnum peats and to produce reliable de-scriptors for quantifying the structural properties of the peat. Because the method is non-destructive, the same peat sample can be re-scanned under different moisture contents. Cou-pling such scans with experimental measurements of unsat-urated hydraulic conductivity using a constant-head perme-ameter offers the prospect of directly measuring geometric pore properties for peats of known hydraulic conductivity, and to evaluate the effect of these properties and moisture content on the pattern and rate of flow.
geometry parameters on estimation of unsaturated hydraulic conductivity.
2 Site description and methodology 2.1 Field sampling and preparation of peat
in laboratory
A 40×40 cm peat block was removed from an undisturbed peat plateau at Scotty Creek (61◦180N; 121◦180W) in the wetland-dominated zone of discontinuous permafrost, 55 km south of Fort Simpson, Northwest Territories, Canada. At this site, the tree cover includes Picea mariana, Pinus
con-torta and Betula papyrifera. As with temperate peatlands and
organic-covered permafrost terrains, Sphagnum mosses are the dominant peat-forming species on peat plateaus (Quin-ton et al., 2000). The sample block contained the upper peat layer extending to 20 cm depth, and was composed of living vegetation and lightly decomposed Sphagnum-peat, overly-ing a darker layer of peat in a more advanced state of decom-position. The peat block was refrigerated and transported to the Cold Regions Research Centre, Wilfrid Laurier Univer-sity, Canada for sub-sampling.
In the laboratory, the peat block was saturated with water and then frozen, while in the same container that was used for transport. Once saturated and frozen, the block was then re-moved from the sample container, and three cylindrical sub-sample cores of 10 cm length and 6 cm diameter were ex-tracted horizontally using a hollow drill bit mounted on a drill press. An upper, middle and lower core was extracted rep-resenting the 0–6 cm, 6–12 cm and 12–18 cm depth ranges. Each core was weighed and then inserted into a transparent acrylic tube (15 cm long, 6 cm inner-diameter) and allowed to thaw and freely drain for 48 h. During this process, the sub-samples were covered with a plastic sheet to minimise evaporative losses of water. All subsequent measurements were based on the thawed sub-samples that remained in these tubes. The sub-samples were transported to the Department of Land Resource Science at the University of Guelph for hydraulic property measurements and CT scanning.
2.2 Laboratory measurements of peat hydraulic properties
In this experiment, the water content of the sub-sample was established by setting the heads (head is used to represent soil water pressure head) of the upper and lower clear Plexi-glas pressure-plates, at fixed distances below the lower plate of the apparatus (Price et al., 2008). Each pressure-plate disc was perforated and had 25µm Nitex fabric glued to it to provide an air entry pressure of about−40 cm. The hy-draulic gradient was established by setting a head difference between the outflow from the lower disc to the upper disc. The twin pressure plates maintained contact with the peat cores at both ends of the peat sample, and the average head
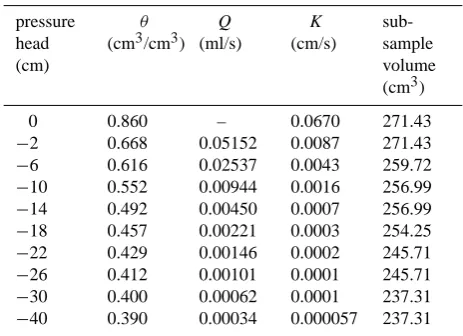
Table 1. Results of the volumetric water content (θ), flow rate (Q), permeameter-based unsaturated hydraulic conductivity (K), and sub-sample volume at ten head levels from saturation. TheK was calculated from equation 5 where the sub-sample cross sec-tional area (A) was 28.3 cm2(A=π r2,r=3 cm) and the hydraulic gradient was (1 h/1 L)=0.21. The saturated hydraulic conductivity (pressure head=0) was derived from the field and laboratory mea-surements of Quinton et al. (2008).
pressure head (cm)
θ (cm3/cm3)
Q (ml/s)
K (cm/s)
sub-sample volume (cm3)
0 0.860 – 0.0670 271.43
−2 0.668 0.05152 0.0087 271.43
−6 0.616 0.02537 0.0043 259.72
−10 0.552 0.00944 0.0016 256.99 −14 0.492 0.00450 0.0007 256.99 −18 0.457 0.00221 0.0003 254.25 −22 0.429 0.00146 0.0002 245.71 −26 0.412 0.00101 0.0001 245.71 −30 0.400 0.00062 0.0001 237.31 −40 0.390 0.00034 0.000057 237.31
of the upper and lower discs was set at−2,−6,−10,−14, −18,−22,−26,−30 and−40 cm. At each average head, all measurements (i.e. unsaturated hydraulic conductivity, umetric moisture content, bulk density, total porosity, vol-ume) were made. At five of the steps (−2,−10,−18,−30, −40 cm), the CT scans were carried out before moving on to the next head level.
The unsaturated hydraulic conductivity of peat sub-samples was measured experimentally using the constant head permeameter which is based on steady-state flow (El-rick and Reynolds, 1992). In this method, the volume flux through the unsaturated peat was measured (Q[L3T−1]). The unsaturated hydraulic conductivity was calculated by ap-plying Darcy’s law as (Elrick and Bowman, 1964 and Price et al., 2008):
K= Q
A(1 L1 h) (5)
where A[L2] is the cross sectional area of sub-sample,
1 h[L] is the head difference across the sub-sample length (=2 cm),1 L[L] is the length of sub-sample, and (1 h/1 L)
is the hydraulic gradient. The measured unsaturated hy-draulic conductivities of the lower core sub-samples at 12– 18 cm depth range at nine different applied heads are shown in Table 1.
[image:3.595.311.543.162.330.2]diameter of the sub-samples were measured after each head level change. The base volume of peat sub-samples was con-tinuously decreased due to the shrinkage as the sub-samples dried, from about 1 to 5% in the tested range. During the first stage of drainage, the volume change was primarily ver-tical, thereafter becoming triaxial. Thus, peat bulk volume changes due to soil shrinkage must be taken into considera-tion in order to characterize accurately the bulk density and volumetric water content measurements. The volumetric wa-ter content and the volume of the lower core sub-sample at each head level are presented in Table 1.
Bulk density and total porosity of each sub-sample were gravimetrically determined at each soil-water head follow-ing the method of Boelter (1976) based on the original sub-sample volume, the sub-sub-sample mass at specified head in-tervals and the dry mass. The measured bulk density of the sub-samples was 0.035, 0.054 and 0.071 (g cm−3) and the measured total porosity was 0.955, 0.863, and 0.933 for the upper, middle and lower cores respectively. The volume frac-tion of air bubbles of these sub-samples was computed in Quinton et al. (2009) as 0.125, 0.077, and 0.106 for the up-per, middle and lower cores, respectively.
2.3 3-D X-ray CT imaging acquisition and processing
Each sub-sample was scanned at heads of−2, −10, −18, −30 and−40 cm, for a total of 15 scans using an X-ray Mi-croCT scanner. Upon reaching these head levels, the sub-sample tubes were disconnected from the pressure plates and inserted into an X-ray CT scanner. The scans were made using a GE MedicalµCT, model MS8X-130, source with 130 kVp monochromatic X-ray beam at 100 kV 80 mA, 3500 millisecond exposure with a high pass filter to reduce hardening artefacts, and enhance contrast between sample phases. The detector was a high resolution digital X-ray camera detector system. This detector accumulates all the energy of the transmitted photons and provides the numeri-cal data to be used in reconstructing an image. For each head, 720 views of the sub-sample were taken at half angle incre-ments over 360◦. Once the scans were finished the collected raw data (the series of rotational X-ray images) were recon-structed with an ultra-high resolution noise-reducing filtered back-projection algorithm (Lewitt, 1983) to derive images with good contrast between the two phases – air-filled pores and the combined water and organic material. The result-ing 3-D imagery was acquired at size of 1350×1350×876 voxels in a local 3-D (XYZ) coordinate system with a reso-lution of 0.045×0.045×0.045 mm for each voxel. In order to reduce inherent noise and partial volume effects that are present in X-ray CT data, a noise reducing homomorphic fil-ter and threshold defil-termination technique was employed (El-liot and Heck, 2007). After each scan, the peat sub-sample tubes were reconnected to the twin pressure plates and the next head level was established. The analyses of 3-D image were conducted on the subsequently cropped images with a
(a) (b)
(c) (d)
Figure 1. a)Pore space in2-D section of the acquired image by CT, b) 3-D view of the
pore space, c) selecting a 3-D cuboid region of interest, and d) 3-D cropped image with a
size of 900 × 900 × 720 voxels. The dark part represents the air-filled pore spaces and the
light part represents the water plus organic material spaces.
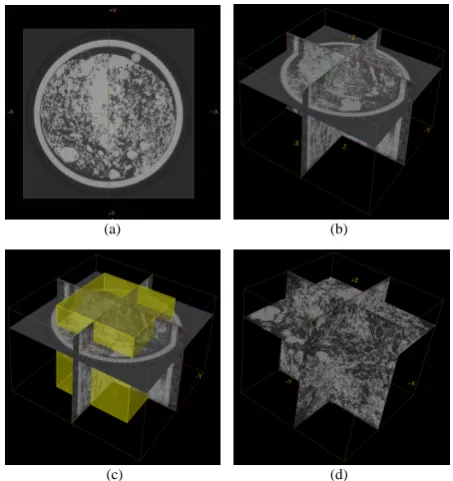
Fig. 1. (a) Pore space in 2-D section of the acquired image by CT, (b) 3-D view of the pore space, (c) selecting a 3-D cuboid region of interest, and (d) 3-D cropped image with a size of 900×900×720 voxels. The dark part represents the air-filled pore spaces and the light part represents the water plus organic material spaces.
size of 900×900×720 voxels (volume of 53.14 cm3); this re-sulted in∼600 million voxels for each data set. An example of 2-D and 3-D, CT images rendering of the pore spaces and selecting a region of interest are shown in Fig. 1.
[image:4.595.314.541.67.308.2]to high density materials. The large density difference be-tween air (HU=−1000), represented by void voxels, and the remaining constituents of water and organic solids (HU=∼0) represented by the non-void voxels, allows direct imaging of individual pores and networks.
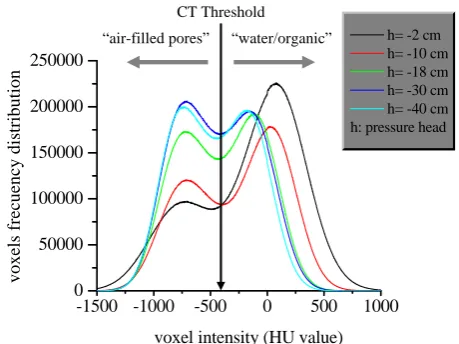
In order to separate void (air-filled pores) from the solid matrix (organic material and water), a new neighbourhood-based standard deviation thresholding algorithm (Elliot and Heck, 2007) was applied for CT images at specific head lev-els. This method is a quantitative approach for selecting a threshold that involves fitting a Gaussian distribution to a bi-modal distribution on a histogram of relative density for the sub-sample. In this technique, the original grey-level micro-tomographic images were processed using ImageJ software (Rasband, 2005) to produce binary images after segmenta-tion of the air-filled pores and solid phases. This procedure is based on the grey-level histogram, where the user applies a threshold value determined by the Elliot and Heck (2007) method, which operates on the equi-probability point that separates the grey level classes associated with solid and voids. The histogram in Fig. 2 describes the CT numbers and their frequency distribution for each head level and indicates that air is the easiest to discern in the images, but water, solid and organic compounds are not discernable from each other. As the head decreased and water drained from the samples, the histogram (Fig. 2) was redistributed such that the area below the curve representing the void voxels increased pro-portionately with a decrease in area below the curve repre-senting the non-void voxels. Fig. 2 also shows some slight lateral shift of the “solid-phase” histogram peak among the head levels, which is an artefact of the partial-volume influ-ence and highly-intermixed water-organic component of the peat. However, the threshold determination is performed in-dividually for each scan, and was not influenced by this shift. In this study, the solid and liquid fractions of the histograms presented in Fig. 2 were not separated, as there is at present no effective algorithm that could segment out the organic peat (inclusive of hyaline cells) from the surrounding water with a degree of verisimilitude. Therefore, the non-void vox-els represent the solid fraction, the water imbibed within it, and the water occupying the active porosity (Quinton et al., 2009).
The most accessible measurement from MicroCT binary images includes the geometry and structure of air-filled pores (voids) which is simply a count of black voxels in a sub-sample volume (Fig. 1). Using a 3-D digital image anal-ysis technique, the pore distribution through the peat sub-sample was quantified. The morphology of air-filled pores was measured by a “3-D Objects Counter” algorithm in Im-ageJ (Rasband, 2005). This algorithm establishes the pres-ence of discrete structures in 3-D binary imagery, and subse-quently counts the number of structures and quantifies some morphology characteristics of the separable structures. The threshold value was adjusted for each CT image at each head level through this process.
-1500 -1000 -500 0 500 1000 0
50000 100000 150000 200000 250000
h= -2 cm h= -10 cm h= -18 cm h= -30 cm h= -40 cm h: pressure head
voxels frecuency distribution
voxel intensity (HU value)
Figure 2. Histograms of voxel intensity in Hounsfield Units (HU) for each head level
applied to the peat sub-sample.
“air-filled pores” “water/organic” CT Threshold
h=-2cm h=-10cm
h=-18cm
h=-30cm
h=-40cm
Fig. 2. Histograms of voxel intensity in Hounsfield Units (HU) for each head level applied to the peat sub-sample.
3 Results and discussion
3.1 Evaluation of CT to quantify geometric pore properties
The focus of the analyses was upon the upper peat layer, since it is this layer that conducts most of the drainage dur-ing the sprdur-ing freshet (Quinton et al., 2000). We extracted the cores horizontally because the vertical travel time of wa-ter is so short due to the very high infiltration rates and the short travel distance between the ground surface and water table. Therefore, it is the horizontal pathway that controls the overall travel time from the time of infiltration to the time that water arrives to the base of a hillslope. An initial anal-ysis of the three peat sub-samples (upper, middle and lower cores) taken from the upper peat layer indicated little vari-ation among them in terms of their physical and hydraulic properties. As a result, only one sub-sample was used for de-tailed analysis. The lower core was selected for this purpose because it is closer to the relatively impermeable frost table for the first several weeks of soil thaw, and therefore conducts runoff during the time when the majority of the annual sub-surface runoff is conveyed through the peat. The summary results of 3-D analysis of 3-D images of this sub-sample core at five levels of hydraulic head are shown in Table 2. The air-filled porosity (φa)was computed as the ratio between the
total volume of empty pores and the total volume of the peat sub-sample (Vimg);
φa=
X
i
Vi/Vimg (6)
where Vi[L3] is the volume of the i-th pore on all
900×900×720 voxels.
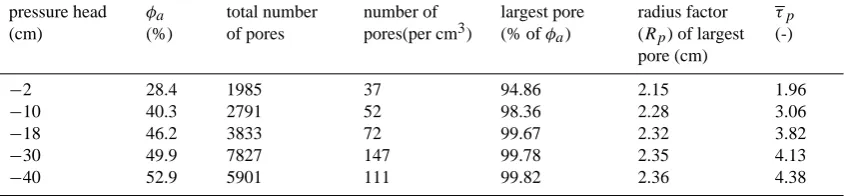
[image:5.595.312.542.66.238.2]Table 2. Summary results of analysis of 3-D images to measure the air-filled pore size distribution at five head levels: the air-filled porosity (φa), total counted number of air-filled pores within sub-sample volume, number of air-filled pores per cm3, percentage ofφaoccupied by the
largest pore, radius factor (Rp) of largest pore, and the average pore tortuosity,τp. The sub-sample volume was 53.14 cm3(900×900×720
voxels).
pressure head (cm)
φa
(%)
total number of pores
number of pores(per cm3)
largest pore (% ofφa)
radius factor (Rp) of largest
pore (cm)
τp
(-)
−2 28.4 1985 37 94.86 2.15 1.96
−10 40.3 2791 52 98.36 2.28 3.06
−18 46.2 3833 72 99.67 2.32 3.82
−30 49.9 7827 147 99.78 2.35 4.13
−40 52.9 5901 111 99.82 2.36 4.38
as a spherical or cubic shape, we defined a pore radius fac-tor (Rp) to assess and quantify the geometry of opening
sur-faces (Milne et al., 1996; Wang et al., 2007). TheRp[L]
equals half the maximum harmonic average radiusRhar[L] of a surface (measured from the centre of the pore). TheRhar is defined as the harmonic average distance from a point on the centre of the pore to the abutments as:
Rhar= 1 1
n n
P
θ=1 1/rθ
(7)
whererθ[L] is the distance from any point on a pore surface to the abutments at angleθandnis the number of rays mea-sured to the surface edge or abutment. Rharhas a maximum value towards the centre of the pore and decreasing values towards the edges. TheRpis calculated at the centre of the
surface and corresponds to the location with the largestRhar value asRp=(1/2) Max (Rhar).
The tortuosity of each pore (τp[–]) was calculated as a
function of air-filled porosity (Berryman and Blair, 1987) by:
τp=
φaAp
π R2
p
, (8)
whereφa is the air-filled porosity of the sub-sample,Ap is
the pore surface area, andRp is the pore radius factor
cal-culated between 0.001 to 2.36 cm using Eq. (7). There was a general increase in air-filled porosity, the percentage ofφa
occupied by the largest pore, and the average pore tortuosity as the volumetric moisture content decreased with a decrease in head (Table 2). Results show that a considerable increase in the number of air-filled pores was detectable with a de-crease in head because the number of pores that were once saturated in the wetter sub-sample had now drained and filled with air as the hydraulic head decreased. At low heads the distribution of pores is skewed, with the number of pores de-creasing as their size increases. As the air-filled pore size in-creases, its shape becomes elongated and connects with other pores.
In our previous paper (Quinton et al., 2009), we found that the distribution of pore size in 3-D measurements is domi-nated by a single large pore, whose volume and surface area is 3-orders of magnitude larger than the next largest pore (Figs. 3 and 4 in Quinton et al., 2009). This single large pore is readily observed as the interconnected pore space that extends throughout the peat sub-sample. The dominance of this single large pore-space was found at all five head lev-els, where it accounted for>94–99% of the air-filled poros-ity (Table 2). There was a general increase in the radius factor corresponding to the increase of the single large air-filled pore volume with decreased head. Once the head de-creased, the radius factor for the single large air-filled pore increased∼10% in the sub-sample (Table 2). A large num-ber of smaller air-filled pores also exist in the sample, and probably contribute to the obstruction of flow as they are dis-connected and are more tortuous than the single large air-filled pore. Therefore, this single large pore imparted a more effective flowpath, when it is saturated, compared to smaller pores and higher resistance to flow, when it is unsaturated, due to a larger air-filled pore space. Although smaller pores may contribute to the obstruction of flow, their contribution to flow may be neglected when a very large pore is active.
volume fraction of air bubbles (∼11%, reported by Quinton et al., 2009).
Three dimensional CT digital image analysis of peat sam-ples showed that the pore structure and configuration of peat soils are very complex and contains many variables. There-fore, we used this technique as an opportunity to quantify and directly measure the size and geometry properties of the pores and thereby to determine the shape and tortuosity fac-tors of the pores which control the permeability and unsatu-rated hydraulic conductivity estimation.
3.2 Characterization of pore properties to control the pore shape coefficient (c)
Since the permeability measures the viscous resistance of the porous media to fluid flowing through its pores, permeability would be expected to correlate with the amount of surface area and volume of the pores (Schlueter et al., 1997). In peat soils, defining the dimensionless constant pore shape coef-ficient c(Eq. 2) is difficult because of the highly irregular shape of pores in peat soils that has some influences on the rate of flow through peat. The coefficientcusually includes properties such as pore path tortuosity, number of air-filled pores, the pore sphericity or roundness of the pores. Mar-shall (1958) developed a theory to include soils with distri-butions of pore size and obtained an expression where unsat-urated permeability decreases with a increase in the number of pores (N) and a decrease in their radius (r) (i.e.K∗∝1/N2
andK∗∝r2). We used this expression for defining thec. The coefficientcoften referred to as the shape coefficient, was computed from morphological characteristics of the pores:
c=
S
p
N2×τ
p
(9) whereSp[–] is the pore sphericity andτp[–] is the pore path
tortuosity (Eq. 8). TheSpcan be calculated by:
Sp=
π1/3(6Vp)2/3
Ap
(10) whereVpandAp are the pore volume and surface area,
re-spectively (Wadell, 1935). Tortuosity is based on the fact that pores are irregular and upon drying, water will concen-trate in small angles and crevices of the pore system as water films. The connectivity of the pore space has proved to play an important role in soil hydraulic properties and in its hys-teretic behaviour; however, a quantitative morphological de-scription of the connectivity of the complex porous structure in peat soil is difficult. Tortuosity is one of the most mean-ingful 3-D parameters of pore structure, which expresses the degree of complexity of the sinuous pore path. Tortuosity can easily be related to the conductivity of a porous medium since it provides an indication of increased resistance to flow due to the pore system’s greater path length; i.e. an increased path length results in less connection or reduced hydraulic conductivity (Dullien, 1979; Vogel, 1997). Equations (9)
and (10) evaluate our CT measurements of the pore prop-erties that control the shape coefficientcwhich affect the hy-draulic properties related to water transport and storage. The pore shape coefficient is therefore important for evaluating and calculating the permeability and hydraulic conductivity of peat soils.
3.3 Factors controlling the permeability and unsatu-rated hydraulic conductivity estimation
The main factors affecting hydraulic conductivity are the shape, interconnectivity (i.e. tortuosity), porosity and the hydraulic radius of pores. The pore properties and pore shape coefficient derived above can be used to give an es-timate of permeability using the Hazen (Eq. 2) and Kozeny-Carman (Eq. 3) relations. These two equations were devel-oped to estimate the permeability under saturated conditions since both of these equations use the water-filled pore size distribution. To use these equations in unsaturated condi-tions, the water-filled pores are the conducting pores and those filled with air are excluded from the calculation so that
φ andD should be replaced by the remaining water-filled volume and pore radius, respectively. Therefore, a modifica-tion is suggested to account for this in which both air-filled pore geometry and porosity are taken into account. We have modified the Hazen and Kozeny-Carman’s formulae (Eqs. 2 and 3) to estimate the pore permeability. The modified equa-tion for the Hazen relaequa-tion is defined as:
Kp∗=cR0p−Rp
2
(11) and modified Kozeny-Carman equation is defined as:
Kp∗=c
Rp0 −Rp
2
φT −φa
3
1− φT −φa
2 (12)
whereKp∗is the unsaturated pore permeability,cis the pore shape coefficient,Rp is the pore radius factor,φaisφT the
air-filled porosity,φT is the total porosity (was measured
us-ing gravimetric method as 0.933) and Rp0 is the maximum water-filled pore radius factor of the largest pore (measured at the lowest head near to active porosity) where Rp0>Rp.
Table 3. Unsaturated hydraulic conductivity (cm/s) measured by a experimental method (permeameter) and estimated by two calcula-tions (modified Hazen, and modified Kozeny-Carmen) at different head levels.
pressure head (cm)
experiment estimation
permeameter pore size analysis modified
Hazen
modified Kozeny-Carman
−2 0.0087 0.0072 0.0057
−10 0.0016 0.0021 0.0014
−18 0.0003 0.0009 0.0003
−30 0.0001 0.0002 0.000057
−40 0.000057 0.000038 0.000071
conductivities from pore size analysis were very close to the experimental values measured with a standard permeameter-based method. Results in Table 3 show that as soon as water content decreases (i.e. when the absolute value of the head decreases), the estimated hydraulic conductivity drops by a similar amount to the measured change. The explanation is that the set of water-filled pores in the sample becomes rapidly disconnected and hence the rate of flow decreased.
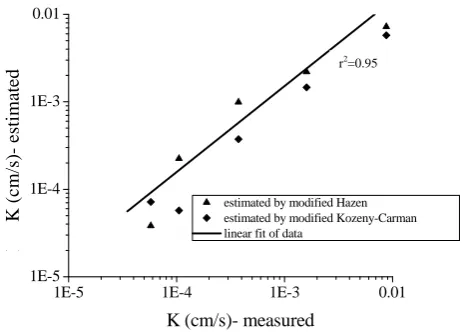
The unsaturated hydraulic conductivity at various heads (Fig. 3) shows that the rapid initial drainage creates a sharp decline in hydraulic conductivity, decreasing by one to two orders of magnitude. Since large pores readily lose wa-ter, the peat rapidly becomes less conductive and the flow path among pores, more tortuous. Variability in hydraulic conductivity was found to be relatively small at intermedi-ate and high head levels. The validity of peat unsaturintermedi-ated hydraulic conductivity estimations were tested by making a comparison with measured standard permeameter-based method. The hydraulic conductivity computed using CT measured values of the pore properties controlling the co-efficientc, closely matched the measured hydraulic conduc-tivity values (Fig. 4). This suggests that the CT scan method successfully measured the key pore properties controlling the coefficientc; therefore the 3-D high resolution computed to-mography imagery provides a direct method to determine the geometric pore properties and thereby determines the shape and tortuosity factors of the pores which control the perme-ability and unsaturated hydraulic conductivity estimation.
4 Conclusions
The classical permeability equations express strong depen-dence of permeability on the pore shape coefficient with the assumption that soil pores are circular in cross-section, and depend on an empirical or theoretical coefficient to correct for the non-circularity of pores and other geometric pore
0 -5 -10 -15 -20 -25 -30 -35 -40 -45 0.000
0.002 0.004 0.006 0.008 0.010
unsaturated hydrauli
c con
ductivity
(cm/s)
tension head (cm)
Permeameter Hazen Kozeny-Carman
Figure 3. Unsaturated hydraulic conductivity versus head of peat soil obtained by an experimental measurement from a permeameter apparatus and two indirect estimations from modified Hazen and modified Kozeny-Carman equations.
measured estimated
Fig. 3. Unsaturated hydraulic conductivity versus head of peat soil obtained by an experimental measurement from a permeameter ap-paratus and two indirect estimations from modified Hazen and mod-ified Kozeny-Carman equations.
1E-5 1E-4 1E-3 0.01 1E-5
1E-4 1E-3 0.01
log K (cm/s)- estimated
log K (cm/s)- measured
estimated by modified Hazen estimated by modified Kozeny-Carman linear fit of data
R2=0.99
Figure 4. Comparison of the values of measured unsaturated hydraulic conductivity with
those estimated from two modified equations. Agreement between estimated and measured
values was satisfactory with a linear relationship and regression coefficient of 0.95.
r2=0.95
Fig. 4. Comparison of the values of measured unsaturated hydraulic conductivity with those estimated from two modified equations. Agreement between estimated and measured values was satisfac-tory with a linear relationship and regression coefficient of 0.95.
[image:8.595.48.287.120.252.2] [image:8.595.311.543.314.481.2]radius of the pores, derived by direct measurements of the pore properties using 3-D high resolution images, affected the hydraulic conductivity of peat soils. The pore properties of unsaturated peat were used to demonstrate how they con-trol the pore shape coefficient and were then used to make quantitative estimations of the unsaturated hydraulic con-ductivity. Estimates of unsaturated hydraulic conductivities made for the purpose of testing the sensitivity of pore-shape and geometry parameters on hydraulic properties of peats were used to evaluate how the structure of the peat affects its parameterization. Unsaturated hydraulic conductivity of peat was estimated using two modified equations (Kozeny-Carman and Hazen). The validity of our estimations was tested by making a comparison with standard permeameter-based measurements. The estimates agree very well with measured unsaturated hydraulic conductivity which indicates that our direct measurement of the peat pore properties using 3-D CT images that control the shape coefficient are realistic. This study suggests that hydraulic conductivity of peat soils is essentially controlled by a pore shape coefficient, which is usually assumed to include properties such as path tortuosity, pore size distribution, the sphericity and round-ness of the pores. Therefore, a method of analysis was de-veloped to emphasize the role of the pore shape on physical and hydraulic properties. This novel approach is restricted to peat soils used in this study for the range of soil moisture levels that typically occur at the field site over a year. In or-der to apply this method of analysis, it is necessary to have a reliable direct measurement of pore properties and shape coefficient of pores, since this can now be done by high res-olution, 3-D imagery. The availability of 3-D computer to-mographic imaging provides a new opportunity to evaluate the 3-D pore geometry and its role in defining fundamental hydraulic properties of peat.
Acknowledgements. This research was funded by the Canadian
Foundation for Climate and Atmospheric Sciences (IP3 Research Network), the Natural Sciences and Engineering Research Council, and the International Polar Year. The authors thank P. Whittington and Trevor Myers for their assistance with obtaining peat samples in the field, conducting the CT scans and providing the images. We gratefully acknowledge the Aurora Research Institute for their assistance in obtaining a research license (#13786). We also wish to thank the Jean-Marie River First Nation, the Denedeh Resources Committee, Deh Cho First Nation, Fort Simpson M´etis Local #52, Liidlii Kue First Nation and the Village of Fort Simpson for their support of this project.
Edited by: S. Carey
References
Beckwith, C. W., Baird, A. J., and Heathwaite, A. L.: Anisotropy and depth related heterogeneity of hydraulic conductivity in a bog peat. I: laboratory measurements, Hydrol. Process., 17, 89– 101, 2003.
Berryman, J. G. and Blair, S. C.: Kozeny-Carman relations and im-age processing methods for estimating Darcy’s constant, J. Appl. Phys., 63, 2221–2228, 1987.
Boelter, D. H.: Methods for analysing the hydrological character-istics of organic soils in marsh-ridden areas, in: Hydrology of Marsh-Ridden Areas, Proceedings of IASH Symposium Minsk, 1972, IASH, UNESCO, Paris, 161–169, 1976.
Carman, P. C.: Fluid flow through Granular Beds, Trans. Inst. Chem. Eng., 15, 150–166, 1937.
Carman, P. C.: Flow of Gases through Porous Media, Butterworths Scientific Publications, London, 1956.
Carrier, W. D.: Goodbye, Hazen; Hello, Kozeny-Carman, J. Geotech. Geoenviron., 129, 11, 1054–1056, 2003.
Dullien, F. A. L.: Porous media- flow transport and pore structure, 2nd Edn., Academic Press, New York, 1979.
Elliot, T. R. and Heck, R. J.: A comparison between 2D vs 3D thresholding of X-ray CT imagery, Can. J. Soil Sci., 84, 4, 405– 412, 2007.
Elrick, D. E. and Bowman, D. H.: Note on an improved apparatus for soil moisture flow measurements, Soil Sci. Soc. Am. Proc., 28, 450–453, 1964.
Elrick, D. E. and Reynolds, W. D.: Infiltration from constant-head well permeameters and infiltrometers, in: Advances in Measure-ment of Soil Physical Properties: Bringing Theory into Practice, edited by: Topp, G. C., Reynolds W. D., and Green, R. E., Soil Science Society of America, Madison, WI, Special Publication No. 30, 1–24, 1992.
Gardner, W. H.: Water Content, in: Methods of Soil Analysis: Phys-ical and MineralogPhys-ical Methods, edited by: Kiute, A., Agron-omy Series 9 (Part 1), Soil Science Society of America, Madison, Wisconsin, 493–544, 1986.
Hazen, A.: Discussion of “Dams on sand formations” by A. C. Koenig., Transactions of the American Society of Civil Engineers, 73, 199–203, 1911.
Hoag, R. S. and Price, J. S.: A field-scale, natural gradient solute transport experiment in peat at a Newfoundland blanket bog, J. Hydrol., 172, 171–184, 1995.
Hoag, R. S. and Price, J. S.: The effects of matrix diffusion on solute transport and retardation in undisturbed peat in laboratory columns, J. Contam. Hydrol., 28, 193–205, 1997.
Hubbert, M. K.: Darcy’s law and the field equations of the flow of underground fluids, Petroleum Transaction, Amer. Inst. Min. Mandal Eng., 207, 222–239, 1956.
Kozeny, J.: Uber Kapillare Leitung Des Wassers in Boden,¨ Sitzungsber. Akad. Wiss. Wien, Math. Naturwiss. Kl., Abt. 2a, 136, 271–306, 1927.
Kettridge, N. and Binley, A.: X-ray computed tomography of peat soils: measuring gas content and peat structure, Hydrol. Process., 22, 4827–4837, 2008.
Lewitt, R. M.: Reconstruction algorithms: Transform methods, in: Proc. IEEE, 71, 390–408, 1983.
Milne, D. M., Pakalnis, R. C., and Lunder, P. J.: Approach to the quantification of hangingwall behaviour, Trans. Inst. Min. Metall., 105, A69–A74, 1996.
Price, J. S., Whittington, P. N., Elrick, D. E, Strack, M., Brunet, N., and Faux, E.: A Method to Determine Unsaturated Hydraulic Conductivity in Living and Undecomposed Sphagnum Moss, Soil Sci. Soc. Am. J., 15, 487–491, 2008.
Quinton, W. L., Gray, D. M., and Marsh, P.: Subsurface drainage from hummock-covered hillslope in the Arctic tundra, J. Hydrol., 237, 113–125, 2000.
Quinton, W. L. and Hayashi, M.: The flow and storage of wa-ter in the wetland-dominated central Mackenzie Rriver basin: Recent advances and future directions, in: Prediction in un-gauged basins: Approaches for Canada’s cold regions, edited by: Spence, C., Pomeroy, J. W., and Pietroniro, A., Canadian Water Resources Association, 45–66, 2005.
Quinton, W. L., Hayashi, M., and Carey, S. K.: Peat Hydraulic Con-ductivity in Cold Regions and its Relation to Pore Size and Ge-ometry, Hydrol. Process., 22, 2829–2837, 2008.
Quinton, W. L., Elliot, T., Price, J. S., Rezanezhad, F., and Heck, R.: Measuring Physical and Hydraulic Properties of Peat from X-ray Tomography, Geoderma, 153, 269–277, 2009.
Rasband, W.: ImageJ, Image Manipulation Software. National In-stitute of Health, Bethesda, MD, USA, available at: http://rsb. info.nih.gov/ij/, 2005.
Salem, H. S. and Chilingarian, G. V.: Determination of specific sur-face area and mean grain size from well-log data and their in-fluence on the physical behavior of offshore reservoirs, J. Petrol. Sci. Eng., 22, 241–252, 1999.
Schlueter, E. M., Zimmerman, R. W., Witherspoon, P. A., and Cook, N. G. W.: The fractal dimension of pores in sedimentary rocks and its influence on permeability, Eng. Geol., 48, 199–215, 1997. Taud, H., Martinez-Angeles, R., Parrot, J. F., and Hernandez-Escobedo, L.: Porosity estimation method by X-ray computed tomography, J. Petrol. Sci. Eng., 47, 209–217, 2005.
Verry, E. S. and Boelter, D. H.: Peatland hydrology, in: Wetland Functions and Values: the State of Our Understanding, Proceed-ings of the National Symposium on Wetlands, Lake Buena Vista, Florida, November 7–10, edited by: Greeson, P., American Wa-ter Research Association: Minneapolis, MN, 389–402, 1978. Vogel, H. J.: Morphological determination of pore connectivity as
a function of pore size using serial sections, Eur. J. Soil Sci., 48, 365–377, 1997.
Wadell, H.: Volume, Shape and Roundness of Quartz Particles, J. Geol., 43, 250–280, 1935.
Wang, J., Milne, D., Wegner, L., and Reeves, M.: Numerical evalu-ation of the effects of stress and excavevalu-ation surface geometry on the zone of relaxation around open stope hanging walls, Int. J. Rock Mech. Min., 44, 2, 289–298, 2007.