www.hydrol-earth-syst-sci.net/11/819/2007/ © Author(s) 2007. This work is licensed under a Creative Commons License.
Earth System
Sciences
Predictions of rainfall-runoff response and soil moisture dynamics
in a microscale catchment using the CREW model
H. Lee1, E. Zehe2, and M. Sivapalan3
1School of Environmental Systems Enineering, The University of Western Australia, 35 Stirling Highway, Crawley, WA 6009, Australia
2Institute of Geoecology, University of Potsdam, Germany
3Departments of Geography & Civil and Environmental Engineering, University of Illinois at Urbana-Champaign, 220 Davenport Hall, 607 S. Mathews Avenue, Urbana, IL 61801, USA
Received: 23 January 2006 – Published in Hydrol. Earth Syst. Sci. Discuss.: 17 July 2006 Revised: 5 December 2006 – Accepted: 24 January 2007 – Published: 5 February 2007
Abstract. Predictions of catchment hydrology have been performed generally using either physically based, dis-tributed models or conceptual lumped or semi-disdis-tributed models. In recognition of the disadvantages of using ei-ther of these modeling approaches, namely, detailed data requirements in the case of distributed modeling, and lack of physical basis of conceptual/lumped model parameters, Reggiani et al. (1998, 1999) derived, from first principles and in a general manner, the balance equations for mass, momentum and energy at what they called the Representa-tive Elementary Watershed (or REW) scale. However, the mass balance equations of the REW approach include mass exchange flux terms which must be defined externally be-fore their application to real catchments. Developing physi-cally reasonable “closure relations” for these mass exchange flux terms is a crucial pre-requisite for the success of the REW approach. As a guidance to the development of clo-sure relations expressing mass exchange fluxes as functions of relevant state variables in a physically reasonable way, and in the process effectively parameterizing the effects of sub-grid or sub-REW heterogeneity of catchment physio-graphic properties on these mass exchange fluxes, this pa-per considers four different approaches, namely the field ex-perimental approach, a theoretical/analytical approach, a nu-merical approach, and a hybrid approach combining one or more of the above. Based on the concept of the scaleway (Vogel and Roth, 2003) and the disaggregation-aggregation approach (Viney and Sivapalan, 2004), and using the data set from Weiherbach catchment in Germany, closure rela-tions for infiltration, exfiltration and groundwater recharge were derived analytically, or on theoretical grounds, while numerical experiments with a detailed fine-scale, distributed
Correspondence to: H. Lee
model, CATFLOW, were used to obtain the closure relation-ship for seepage outflow. The detailed model, CATFLOW, was also used to derive REW scale pressure-saturation (i.e., water retention curve) and hydraulic conductivity-saturation relationships for the unsaturated zone. Closure relations for concentrated overland flow and saturated overland flow were derived using both theoretical arguments and simpler pro-cess models. In addition to these, to complete the specifi-cation of the REW scale balance equations, a relationship for the saturated area fraction as a function of saturated zone depth was derived for an assumed topography on the basis of TOPMODEL assumptions. These relationships were used to complete the specification of all of the REW-scale govern-ing equations (mass and momentum balance equations, clo-sure and geometric relations) for the Weiherbach catchment, which are then employed for constructing a numerical water-shed model, named the Cooperative Community Catchment model based on the Representative Elementary Watershed approach (CREW). CREW is then used to carry out sensi-tivity analyses with respect to various combinations of cli-mate, soil, vegetation and topographies, in order to test the reasonableness of the derived closure relations in the con-text of the complete catchment response, including interact-ing processes. These sensitivity analyses demonstrated that the adopted closure relations do indeed produce mostly rea-sonable results, and can therefore be a good basis for more careful and rigorous search for appropriate closure relations in the future. Three tests are designed to assess CREW as a large scale model for Weiherbach catchment. The first test compares CREW with distributed model CATFLOW by looking at predicted soil moisture dynamics for artificially designed initial and boundary conditions. The second test is designed to see the applicabilities of the parameter val-ues extracted from the upscaling procedures in terms of their
ability to reproduce observed hydrographs within the CREW modeling framework. The final test compares simulated soil moisture time series predicted by CREW with observed ones as a way of validating the predictions of CREW. The results of these three tests, together, demonstrate that CREW could indeed be an alternative modelling framework, producing re-sults that are consistent with those of the distributed model CATFLOW, and capable of ultimately representing processes actually occurring at the larger scale in a physically sound manner.
1 Introduction
Ability to make hydrological predictions has become an es-sential part of sustainable management of water resources, water quality and water related natural hazards, especially in environments where climatic or human induced land use changes are under way. Catchments undergoing a transition from one state to a different state through climatic or land use changes can be considered as ungauged basins, due to the fact that under conditions of change, past measurements or gauging are poor or inadequate indicators of the future. The global, decadal initiative on predictions in ungagued basins or PUB (Sivapalan et al., 2003) has been designed to address this as yet unsolved problem in hydrology. To address the problem of PUB, and in particular, to predict the effects of climatic and land use changes, it is increasingly necessary to develop hydrological models that are based on a deeper level of process understanding rather than merely rely on calibra-tions carried out with past observacalibra-tions. For hydrological predictions in meso-scale catchments, the usual practice is to use so-called conceptual models, which can be lumped or quasi-distributed due to their efficiency in terms of data re-quirements and computational costs, traits that put them at a considerable advantage compared to physically based, fully distributed models, notwithstanding the sound theoretical ba-sis of the latter-type models. Parameters used in lumped or quasi-distributed conceptual models often have very lit-tle physical meaning in the traditional sense, due to the lack of a physically-based theory at the catchment scale, and con-sequently these parameters cannot be estimated unambigu-ously in the field or from field data. Therefore, conceptual models will be inadequate to address PUB problems in an efficient or physically sound manner. To deal with the PUB problem, the chosen model must be flexible enough to in-corporate new findings about processes in changed environ-ments and new ways of capturing them in models. In addi-tion, parameters of the model must be capable of being esti-mated from field data and of reflecting likely environmental changes, and their meanings must be sound enough on phys-ical grounds. In order to make better predictions and reduce predictive uncertainties, the chosen model must have a holis-tic model structure that incorporates changes in the
environ-ment in a consistent manner so as to reduce model structure uncertainties.
Recently, Reggiani et al. (1998, 1999) proposed a new hy-drological modeling framework based on balance equations for mass, force and energy, derived directly at the scale of what they called the Representative Elementary Watershed (REW). The REW approach presents, potentially, a novel framework for developing hydrological models directly at the catchment scale, in a physically based and also physi-cally meaningful manner. The REW is a hydrologiphysi-cally sig-nificant control volume that lends itself to thermodynami-cally consistent volume averaging. Due to the R (represen-tative) aspect of the REW this implies essentially that the REW is a means of separating scales. It must therefore be larger than the characteristic length scales of all relevant hy-drologic landscape properties. At the mesoscale the REW approach offers, in principle, several advantages over tradi-tional (lumped or quasi-distributed) conceptual models, and over the current generation of physically based, fully dis-tributed (grid based) models. Firstly, the equations derived as part of the REW approach address (volume) average dynam-ics directly at REW scale, as opposed to the current gener-ation of distributed models that operate at the representative elementary volume (REV) scale. Therefore, models based on the the REW scale balance equations remain modest in terms of both their computational burden and their input and parameter requirements. Secondly, the REW scale balance equations have been derived in a comprehensive manner for the whole catchment or REW, as opposed to being derived separately for different processes, as is the case with many traditional distributed models. Special care has been taken to respect not only the individual component processes, but also the various process interactions amongst parts of the REW. This enhances the holistic nature of the REW approach for characterizing overall catchment responses. Thirdly, by be-ing general and not tied to specific process formulations, e.g., about how to describe mass and/or momentum exchanges at the REW scale, the REW approach can easily benefit from further advances in process understanding and process de-scriptions emerging from new field experiments carried out at the hillslope or REW/catchment scale. However, this is also the most difficult hurdle to be taken when building new models based on the REW approach, because process de-scriptions at that scale are in general not widely available (Beven, 2002).
vari-ous mass exchange fluxes that incorporate the effects of sub-REW scale spatial heterogeneities, and expressed in terms of selected REW scale state variables and catchment charac-teristics. A related problem is the derivation of REW scale constitutive relations that relate one or more state variables amongst themselves, e.g. REW scale capillary pressure vs saturation and hydraulic conductivity vs saturation relation-ships in the unsaturated zone, again incorporating the effects of sub-REW scale heterogeneities. The latter is essential to describe capillary rise and recharge at that scale.
To a certain extent, the closure relations can be a result of an upscaling of process descriptions available at the point or REV scale, towards physically reasonable process parame-terizations appropriate to the REW scale. In fact, they could be much more than this, and could represent processes that occur at the larger (e.g., REW) scale, and requiring descrip-tions that transcend familiar small scale ones, in which case upscaling may not be adequate. In either case, theory alone, of the sort used in the derivation of the REW scale bal-ance equations and constitutive theory, i.e., Newton’s laws of motion and the 2nd law of thermodynamics, is not suf-ficient to generate these. Closure relations and constitu-tive relations represent the hydrological functioning of catch-ment/landscape compartments at the REW scale. Hence, they are always related to a catchment/landscape, process and equations and have to be determined empirically, by “look-ing” at the catchment/landscape of interest. Ideally, they will have to be estimated from experiments in the field that oper-ated directly at the REW scale. However, as such data are out of reach yet, one should at least employ field data that are cur-renty state of the art and combine these with appropriate inte-gration of assumed, measured or simulated realistic patterns of sub-grid, or sub-REW, heterogeneity. Indeed, the closure relations are the best mechanism to ground the REW theory to reality, through physically realistic and reasonable descrip-tions of actual hydrological processes and their underlying physical mechanisms, expressed in terms of parameteriza-tions involving landscape and climatic properties. Therefore, they are also intimately connected to the issue of estimation model parameters (although this link and the related equifi-nality problem are not explored in this paper). To summarize, the applicability of the REW approach to model real world catchments stands and falls with the assessment of closure relations and assessment the related parameters/constitutive relations that are valid at the REW scale (Beven, 2002; Reg-giani and Schellekens, 2003).
The chief focus of this paper is on the derivation and as-sessment of various closure relations and constitutive rela-tions for Weiherbach, a micro-scale catchment located in south-west Germany, which has been well studied for more than 10 years. This catchment offers an extensive hydro-logical data set, including soil hydraulic functions and soil patterns, precipitation data, meteorological data, and dis-tributed soil moisture observations and tracer data (Zehe et al., 2001). In addition, a detailed process model, CATFLOW,
is also available, having been previously developed at this catchment and shown to closely portray all aspects of sys-tems dynamics at hillslope and catchment scales. Within a 1.5 year simulation period the model predicted observed discharges with a Nash-Sutcliffe efficiency of 0.82 and at the same time predicted point observations of evapotranspi-ration with a correlation of 0.92 and point observations of soil moisture at 61 locations with correlation coefficients of between 0.65 to 0.75 (Zehe et al., 2001; Zehe and Bl¨oschl, 2004). Hence this model may be employed for deriving clo-sure relations through conducting of carefully targeted nu-merical experiments. The objective is to explore this and alternative approaches currently available and report on the progress made so far in developing closure relations for this place. We will then present the resulting complete set of coupled balance equations for mass and momentum, and the associated geometric relations, followed by a sensitivity analysis with the resulting complete REW-scale hydrologi-cal model, which we hydrologi-call CREW. With the complete REW scale model (CREW) we will simulate the water balance of the Weiherbach catchment using observed rainfall and poten-tial evaporation time series and compare model predictions of hydrological response to both corresponding observations and also the integrated predictions of CATFLOW obtained for the same period. The latter comparison will illustrate, in particular, whether the simulations of the internal state dy-namics predicted by the CREW are comparable with the in-tegral dynamics simulated with the fully distributed model (CATFLOW), which can be deemed to be the best guess of how the true integrated soil moisture in the Weiherbach catchment may have evolved during the simulation period.
2 The REW-approach and the Study Area
2.1 The REW approach as foundation for meso-scale mod-els
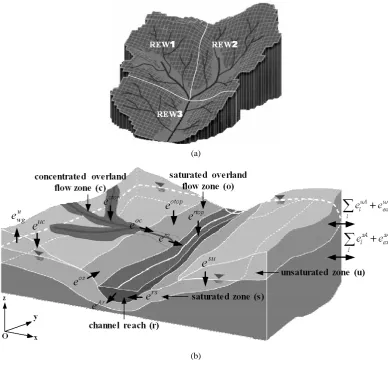
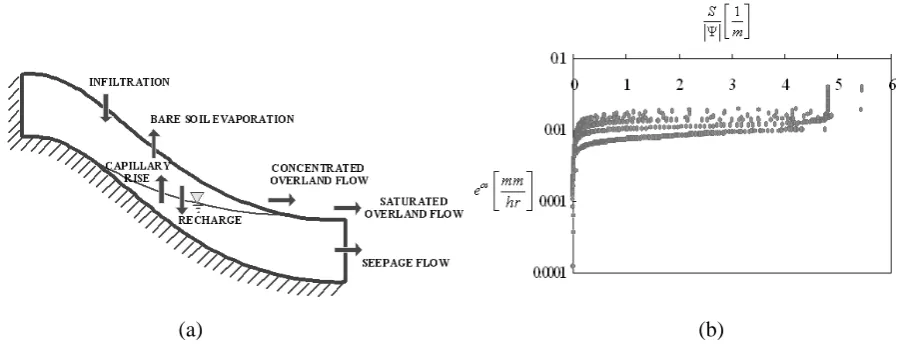
An REW is taken as the smallest resolvable spatial unit of a meso-scale watershed, and is composed of five zones: unsat-urated zone (u-zone), satunsat-urated zone (s-zone), concentrated overland flow zone (c-zone), saturated overland flow zone (o-zone), and channel zone (r-zone). These are delineated based on known physical characteristics of typical watersheds, and on characteristic time scales that are typical of various hy-drological processes (Reggiani et al., 1998) through averag-ing. Hence, an REW can be deemed to separate the next hy-drological significant scale. The mass, energy and momen-tum balances within the individual zones of the REW are de-scribed using a coupled set of ordinary differential equations, derived from thermodynamic principles, by means of averag-ing. Figure 1a presents the schematic of a typical watershed that is discretized into three REWs based on the geometry of channel network, and Fig. 1b illustrates the sub-regions making up the REW, and the mass exchange fluxes between
different sub-regions of each REW, and those between dif-ferent REWs. A simpler set of REW-scale balance equations of mass and momentum applicable to these REWs and their sub-regions, from those first derived by Reggiani et al. (1998, 1999) is used in the rest of this paper. These are presented
in Eqs. (1) to (11) below. For further details regarding their derivation and the meaning of the variables, the reader is re-ferred to Reggiani et al. (1998, 1999, 2000), and the nomen-clature given at the end of the paper.
d dt(εy
sωs)
| {z }
storage
= eso
|{z} seepage
+ esu
|{z} exchag.with unsat.zone
+ esr
|{z} sat.zone−river exchange
+ X
l
esAl +esAext
| {z }
exchange across mantle segments
(1)
d dt(εy
uωusu)
| {z }
storage
= euc
|{z} infiltration
+ eus
|{z} exchag.with sat.zone
+ euwg
|{z} evaporation
+ X
l
euAl +eextuA
| {z }
exchange across mantle segments
(2)
d dt(y
cωc)
| {z } storage
= ecu
|{z} infiltration into unsat.zone
+ eco
|{z} flow to sat.overl.flow
+ ect op
| {z } rainfall or evaporation
(3)
d dt(y
oωo)
| {z } storage
= eor
|{z} lat.channel inflow
+ eos
|{z} seepage
+ eoc
|{z}
inflow from conc.overl.flow
+ eot op
| {z } rainfall or evaporation
(4)
d dt(m
rξr)
| {z } storage
= ero
|{z} lateral inflow
+ ers
|{z} channel−sat.zone exch.
+X
l
elrA+erAext
| {z }
inflow,outflow
+ ert op
| {z } rainfall or evaporation
(5)
±X
l
AsAl,λh−ps+ρφlsA−φsi
| {z }
inter−REW driving force
+ ±AsAext,λh−ps+ρφsAext−φsi
| {z }
force acting on the external boundary
+ ±Asbotλ h−ps+ρφsbot−φsi
| {z }
force at the bottom boundary = −Rsvλs
| {z } resistance to flow
;λ=x, y (6)
±X
l
AuAl,λ
h
−pu+ρ
φluA−φu
i
| {z }
inter−REW driving force
+ ±AuAext,λ
h
−pu+ρ
φextuA−φu
i
| {z }
force acting on the external boundary
= −Ruvuλ
| {z } resistance to flow
;λ=x, y (7)
−pu+ρ φuc−φuεωu
| {z }
f orce t op
−ρεsuyuωug
| {z }
gravity
= −Ruvzu
| {z } resistance force
(8)
ρycωcdv
c
dt
| {z }
inertialterm
−ρycωcgsinγc
| {z }
gravity
= −Ucvcvc
| {z }
resistance to flow
(a)
(b)
Figure 1. (a) Catchment discretization into 3 REW units (b) Exchanging mass fluxes and subregions making up
the spatial domain of a REW after Reggiani et al. (1999, 2000): euc
denotes infiltration, evapotranspiration
from unsaturated zone, esu recharge or capillary rise, ectop, eotop and ertop rainfall or evaporation at c, o and r-zones respectively, eoc concentrated overland flow, ero saturated overland flow, eos seepage flow flow from saturated zone to channel, eAr channel flow at outlet, and
u wg e
, ers
uA ext l
uA l e e +
∑
and sAext l
sA l e e +
∑
mass exchange across mantlesegment at u and s-zones respectively.
52
Fig. 1. (a) Catchment discretization into 3 REW units (b) Exchanging mass fluxes and subregions making up the spatial domain of a REW
after Reggiani et al. (1999, 2000): euc denotes infiltration,ewgu evapotranspiration from unsaturated zone, esu recharge or capillary rise,
ect op, eot opand ert oprainfall or evaporation at c, o and r-zones respectively, eocconcentrated overland flow, erosaturated overland flow,
eosseepage flow, ersflow from saturated zone to channel, eArchannel flow at outlet, andP l
eluA+euAextandP l
esAl +esAextmass exchange
across mantle segment at u and s-zones respectively.
ρyoωodv
o
dt
| {z }
inertialterm
−ρyoωogsinγo
| {z }
gravity
= −Uovovo
| {z }
resistance to flow
(10)
ρmrξrdv r
dt
| {z }
inertial term
=ρgmrξrsinγr
| {z }
gravitational force
− Urvrvr | {z } Chezy resistance
+ ±X
l
ArAl cosδl h
−pr+ρφrAl −φri
| {z }
pressure forces exchanged among REWs
+ArAexth−pr+ρφextrA−φri
| {z }
pressure force at watershed outlet (11)
[image:5.595.101.490.63.429.2]whereεis porosity, yi (i=u, s,c, o, r) is the average verti-cal thickness of the i subregion, ωi (i=u, s, c, o, r) is the time averaged surface area fraction of the i subregion, su is the saturation degree of the unsaturated zone, mr is the chan-nel cross sectional area,ξr is the drainage density, eij (i or
j= u, s, c, o, r) the rate of water mass exchange between
the i and j subregions,euwg is the rate of evapotranspiration from the unsaturated zone,elj A(j=u, s, r) is the rate of wa-ter mass exchange from the j subregion across the lth mantle segment,eextj A (j=u, s, r) is the water mass exchange from the
j subregion across the external watershed boundary,Aj Al and
Aj Aext(j=u, s, r) are the mantle surface with horizontal normal delimiting the REW externally at the j subregion with the
lth mantle segment and the external watershed boundary,
re-spectively,As bot is the mantle surface corresponding to the bottom part of the saturated zone, pi (i=u, s, r) is the pres-sure of the i subregion, ρ is water mass density,φi,φs bot,
φliA, andφiAext(i=u, s, r) are the gravitational potential at the
i subregion, at the bottom part of the saturated zone, at the
interface of the i subregion and lth mantle segment, and at the interface of the i subregion and the external watershed boundary, respectively, vi (i=u, s, c, o, r) is the water veloc-ity within i subregion,vzuis the vertical water velocity within the unsaturated zone, g is gravitational acceleration, Ri(i=u,
s) is the first order friction term of the i subregion, Ui (i=c,
o, r) is the second order friction term of the i subregion,γi
(i=c, o, r) is the slope angle of the i subregion flow plane with respect to the horizontal plane, andδl is the local angle between the reach of the lth REW and the reach of the REW of interest.
To summarize, Eqs. (1) to (5) represent, respectively, mass balance of the saturated zone (s-zone), the unsaturated zone (u-zone), the concentrated overland flow zone (c-zone), the saturated overland flow zone (o-zone), and the channel reach (r-zone). Equations (6) to (11) represent momentum balance of the saturated zone, unsaturated zone in the horizontal di-rection, unsaturated zone in the vertical didi-rection, concen-trated overland flow zone, saturated overland flow zone and the channel reach. In Eqs. (6) and (7), the signs are either positive or negative according to the orientation ofAj Al ,Aj Aext
(j=u, s) andAs botwith respect to the reference system, while the sign of the second-last term in Eq. (11) is positive for the outlet sections and negative for the inlet sections of the chan-nel reaches (Reggiani et al., 1999).
2.2 The closure problem
The eij terms in the mass balance Eqs. (1) to (5), also shown in Fig. 1b, represent mass exchange fluxes between the i and
j sub-regions such as infiltration, bare soil evaporation and
transpiration by root uptake, groundwater recharge/capillary rise, saturated and concentrated overland flow, seepage out-flow, and channel flow. These fluxes are generally unknown, and must be externally specified. Therefore, in order to close
Figure 2. Observational network of the Weiherbach catchment, after Zehe
et al.
(2005a): soil moisture was
measured at 61 TDR stations at weekly intervals (crosses). Topographic contour interval is 10 [m].
53
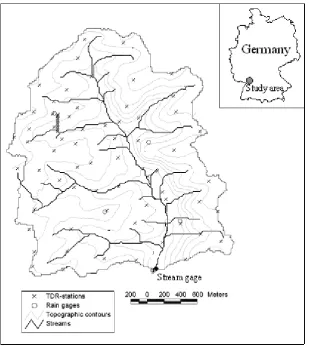
Fig. 2. Observational network of the Weiherbach catchment, after Zehe et al. (2005a): soil moisture was measured at 61 TDR stations at
weekly intervals (crosses). Topographic contour interval is 10 [m].
Within this study we will assume that the hydrological micro-scale, i.e. the scale of small experimental catchments, is a key scale for the derivation of physically sound closure relations because:
– the micro-catchment scale is small enough so that we can gain a reasonable understanding of how spatial pat-terns of soils and preferential pathways affect various mass exchange fluxes through the use of detailed field observations and distributed models; and
– the micro-catchment scale is large enough so that we can set up a model based on the REW-approach to sim-ulate average or typical hydrological dynamics in this region and to perform comparative simulations. These assumptions provide the main justification for us-ing the micro-scale experimental catchment, Weiherbach, in south-west Germany, for the derivation of the requuired clo-sure relations.
2.3 Study area
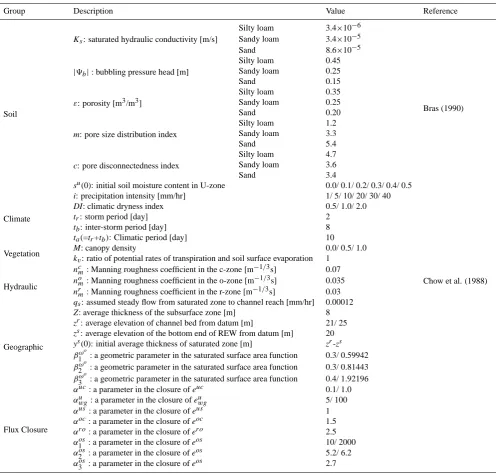
As mentioned above, Weiherbach catchment was selected as the study area for developing closure relations for various mass exchange fluxes. The Weiherbach is a rural catchment of 3.6 [km2] size situated in a Loess area in the south-west of Germany. Geologically, it consists of Keuper and Loess layers up to 15 [m] thick. The climate is semi-humid with an average annual precipitation of 750 to 800 [mm/yr], average annual runoff of 150 [mm/yr] and annual potential evapotran-spiration of 775 [mm/yr] (Zehe et al., 2001). More than 95% of the catchment area is used for cultivation of agricultural crops or pasture, 4% is forested and 1% is paved area. Most of the Weiherbach hillslopes exhibit a typical Loess catena with moist but drained Colluvisols located at the foothills, and drier calcareous Regosols located at the hilltops and mid-slope regions. Figure 2 gives an overview of the observa-tional network of the Weiherbach catchment. Rainfall inputs were measured in a total of 6 rain gages, and streamflows were monitored at a temporal resolution of 6 [min]. The catchment area up to the stream gauge is 3.6 [km2]. Soil
moisture was measured at up to 61 locations at weekly inter-vals using two-rod TDR equipment that integrates over the upper 15 cm, upper 30 cm, upper 45 cm and upper 60 cm of the soil. The soil hydraulic properties of typical Weiherbach soils, after van Genuchten (1980) and Mualem (1976), were measured in the laboratory using undisturbed soil samples taken along transects at several hillslopes, with up to 200 samples per slope (Table 1, Sch¨afer, 1999).
The Weiherbach catchment offers considerable advantages for the development of closure relations. Firstly, it has been maintained as a significant experimental catchment over the past many years. There is a wealth of information regard-ing the geology and soil properties, and field experimenta-tion has generated a wealth of measurements of various water fluxes and internal soil state variables, such as soil moisture and tracer concentrations. Secondly, as mentioned before, a detailed physically based model CATFLOW (using the fi-nite difference scheme) (Maurer, 1997; Zehe et al., 2001, Zehe and Bl¨oschl, 2004), has been developed and success-fully verified in this catchment. Zehe et al. (2001) showed that in this catchment, which is situated in a Loess area in Germany, a model structure which only incorporates typi-cal (not actual) spatial patterns of soils, vegetation and pref-erential pathways in that loess landscape, and neglects lo-cal slo-cale statistilo-cal variability, is sufficient to explain a large part of the observed variability of hydrological processes at the catchment scale. Within a 1.5 year long simulation the catchment model predicted catchment scale runoff response with a Nash- Sutcliffe efficiency of 0.82, explained more than 92% of the evapo-transpiration observed at a meteorologi-cal station and yielded at the same time reasonable predic-tions of soil moisture time series observed at 61 locapredic-tions in the catchment with correlation coefficients ranging between 0.65 and 0.75 (Zehe et al., 2001; Zehe et al., 2005a). In this study we will employ this “landscape and process com-patible” model structure for the development of the closure relations relating to seepage (subsurface) outflow from simu-lated hillslope scale drainage experiments, and the pressure-saturation and conductivity-pressure-saturation relationships.
3 Derivation of closure relations and the CREW model
3.1 Different approaches for assessing closure relations In this section, we review the upscaling methods that are currently available to develop closure relations for mass ex-change fluxes. We classify these upscaling methods into four categories: field experiments, theoretical/analytical deriva-tions, numerical experiments, and hybrid approaches. 3.1.1 Assessing closure relations based on field
experi-ments
The field experimental approach seeks to find closure rela-tions from the analysis of data obtained in the field, either
in a routine manner or through focused intensive field ex-periments. Empirical closure relations based on field obser-vations may be the best candidates for the REW scale clo-sure relations, because they best represent the intrinsic nat-ural variability occurring within the study catchment. These include nonlinear and threshold behavior commonly exhib-ited in many catchments, which are hard to represent using current small-scale theories. Unfortunately, in most cases, field monitoring of catchments is limited to rainfall, runoff, and potential evaporation, which are not sufficient to derive closure relations. At the minimum, the development of clo-sure relations requires meaclo-surements of internal state vari-ables in different sub-regions of the catchment system. Un-fortunately, currently there are no measurement techniques available that allow observations of internal states and sub-surface structures for scales larger than the plot- or small field scale (Schulz et al., 2006). While they have been monitored as part of some focused field experiments around the world, such as soil moisture measurement at the Tarrawarra catch-ment in southern Victoria, Australia (Western and Grayson, 1998), and the Weiherbach catchment, and at over 600 sta-tions from around the globe (Robock et al., 2000), mostly by employing a distributed network of point measurements, the corresponding data from these field experiments alone is not sufficient for derivation of closure relations. The work of Duffy (1996) at the Shale Hills catchment in central Pennsyl-vania is an exception to this trend, and showed that closure relations, notably the storage-discharge relationship relating to shallow subsurface flow, can be derived on the basis of carefully conducted field experiments, in combination with numerical modelling.
3.1.2 Analytical approach to the derivation of closure rela-tions
advan-tage that the resulting closure relations, as well as the con-sequent REW scale parameters, retain some or most of their traditional meaning, and therefore there is a chance that they can be estimated by referring back to a mapping of landscape and/or climatic properties.
3.1.3 Numerical simulation approach to the derivation of closure relations
The numerical simulation approach seeks to derive closure relations based on the comprehensive simulated datasets that can be generated through the application of detailed, dis-tributed physically-based hydrological models that are based on small-scale physical theories, under well defined bound-ary conditions. In contrast to the analytical approach, these models may account explicitly for all the patterns of veg-etation, soil properties, macropores and topography, and their nonlinear interactions, that may be controlling the sur-face and subsursur-face flows. Closure relations maybe derived from numerical model output by averaging the state vari-ables and parameter fields to the catchment or REW scale and postulating parametric relations. However, the main problem with this approach is that the patterns of vegeta-tion, soil properties (soil hydraulic functions) and macrop-ores are generally unknown. Therefore, one has to make reasonable assumptions about the heterogeneities to be ex-pected in the study catchments. For example, Binley et al. (1989a, b) employed a fully three dimensional model based on the Richards equation, coupled with a simple linear rout-ing approach, for derivrout-ing hillslope scale effective hydraulic conductivities for stochastically generated heterogeneous pa-rameter fields. This worked well for weakly heterogeneous systems of high average hydraulic conductivities ranging from 0.05 to 0.2 cm/min. In the alternative, one can work in well instrumented research catchments to develop the clo-sure relations, as we do in the present study. In such cases the numerical simulation approach can nevertheless be a good starting point for developing closure relations at the catch-ment scale that are accurate to first order (Zehe et al., 2005a; Kees et al., 2002; Kees et al., 2004). Zehe et al. (2005a) and Kees et al. (2004) presented examples of the develop-ment of closure relations for a hillslope scale water balance model with a transient numerical solution of continuum-scale model.
3.1.4 Hybrid approaches for assessing closure relations In the present study we also follow the hybrid approach, which is a combination of any of the above methods pre-sented above. Viney and Sivapalan (2004), following Robin-son and Sivapalan (1995), derived closure relations for catch-ment scale infiltration capacity as a function of the cumu-lative volume of infiltrated water on the basis on numeri-cal experiments and catchment response data. They tested the effects of different storms as well as different
topogra-phies on this relationship, and through these sensitivity anal-yses parameterized the relationship in terms of storm dura-tion, storm depth, temporal pattern and catchment topogra-phy. This led to an acceptable empirical closure relation for infiltration rate that could be embedded within a large-scale catchment model.
In a similar way, we apply a number of these methods to develop closure relations for crucial mass exchange fluxes appearing in the REW scale balance equations; these deriva-tions are presented in Sects. 3.2.1 to 3.2.6. Supplementary parametrizations such as a geometric relationship for satu-rated surface area, the REW scale water-retention curve, and the hydraulic conductivity versus saturation relationship, are derived in Sects. 3.3.1 to 3.3.3. In Sect. 3.4 the developed closure relations are combined, with the original balance equations, yielding a set of equations which form the basis of the CREW model.
3.2 Closure relations for mass exchange fluxes 3.2.1 Infiltrationeuc
For the infiltration process during rainfall events we directly use the results of Rogers (1992) who developed an areal aver-age infiltration capacity model based on the standard Green-Ampt equation. He assumed that only saturated hydraulic conductivity is spatially variable, and that it follows a log-normal distribution. All other soil parameters were assumed constant, with the justification that saturated hydraulic con-ductivity is much more variable than the other parameters and has a greater impact on infiltration (Bresler and Dagan, 1983). The resulting infiltration capacity equation has the following form:
f∗=K s
" 1+αuc
9f
(θs−θi) ¯ F
#
(12)
where f∗ is spatially averaged infiltration capacity, K s is mean saturated hydraulic conductivity, 9f
is soil’s ma-tric potential head at the wetting front, θs is saturated soil moisture content,θi is initial soil moisture content,F¯ is spa-tially averaged cumulative volume of infiltration andαuc is a “scaling” parameter related to the variability of hydraulic conductivity. To adapt Eq. (12) within the REW modeling framework, we need to find a match between state variables in Eq. (12) and those of the REW approach. SinceF¯ cor-responds to infiltrated water depth into the unsaturated zone, it was replaced by suyu, where su is degree of saturation in the unsaturated zone and yu is average thickness of the un-saturated zone along the vertical.9f
andθs-θare replaced by|9|and (1-su)εurespectively, where|9|is the soil’s ma-tric potential head (which is a function of saturation degree in the unsaturated zone) andεuis soil porosity in the
urated zone. The resulting form of the infiltration capacity equation is:
f∗=K s
1+αuc|9|(1−s
u) εu
suyu
(13)
whereαucembeds within it the effects of not only the spatial variability of soils, but also of the space-time variability of the wetting front position during the infiltration process. It is clear, that this key parameter is difficult to estimate a priori and further work is required in different catchments to get at this number. The infiltration capacity Eq. (13), which is based on and resembles the standard Green-Ampt infiltration equation, still has much room for improvement to account for new findings from field experiments and to provide im-proved predictions of ponding time, and the effect of rainfall heterogeneities on the infiltration process.
Finally, as in Reggiani et al. (2000), the actual infiltration flux (euc)during rainfall events can be expressed as:
euc=miniωu, f∗ωu
(14) where i is rainfall intensity andωuis the surface area fraction occupied by the unsaturated zone.
3.2.2 Bare soil evaporation and transpiration by root uptake Closure relations for bare soil evaporation and transpiration by root uptake were derived analytically based on the exfil-tration capacity model of Eagleson (1978b,c), assuming that the soil hydraulic conductivity is spatially variable and fol-lows a log-normal distribution. The resulting closure rela-tions have the following final form:
ewgu =minh ep+Mkvep
ωu, fET∗ ωui (15)
fET∗ =αwgu Ks (1−su) yu
(su)2+dεu|9b|
m (16)
where epis potential evaporation rate from the bare soil sur-face, M is the vegetated fraction of land sursur-face, i.e., canopy density, kvis the ratio of potential rates of transpiration and soil surface evaporation,epis the long-term (time averaged) rate of potential (soil surface) evaporation, fET∗ is the spa-tially averaged combined exfiltration capacity due to bare soil evaporation and transpiration by root uptake, m is pore size distribution index, c is pore disconnectedness index,εu
is soil porosity in the unsaturated zone, d is diffusivity index, |9b|is the bubbling pressure head, andαwgu is a parameter related to variability of saturated hydraulic conductivity and exfiltration diffusivity. The full derivation of these equations and the meaning ofαwgu is presented in detail in Appendix A.
3.2.3 Groundwater recharge/capillary rise
Groundwater recharge/capillary rise, in general, refers to the mass exchanges between the unsaturated zone and the sat-urated zone that lies below it. Depending on its dominant direction it can take on different meanings. It will be called net recharge if the net water flow is vertically downward into the saturated zone, while it will be termed capillary rise if the net flow is vertically upward into the unsaturated zone. The direction of flow at any time is governed by the status of momentum balance within the unsaturated zone, expressed through the resulting unsaturated zone vertical velocityvzu. In this paper, as a first step, we develop somewhat simple closure relationship for the recharge flux/capillary rise of the following form:
eus=αusωuvuz (17)
whereαusis considered as a constant of proportionality link-ing the average vertical velocity with the entire unsaturated zone and the recharge/capillary rise at the bottom, which is a boundary flux. The form of this closure relation, Eq. (17), has a similar form to that of Reggiani et al. (2000). Here it should be pointed out that the improvement of this closure relation lies not only in the way of parameterizing eus but also in the way of relatingvuz to both relevant state variables, material properties and capillarity by adopting appropriate expressions for the non-equilibrium part of the momentum exchange terms (compare Eq. 34). At the moment, we are adopting first-order Taylor series expansion for derivingvuz
which leads to the result that appears in Eq. (8) and similar to the equation adopted by Reggiani et al. (2000).
3.2.4 Saturated and concentrated overland flow
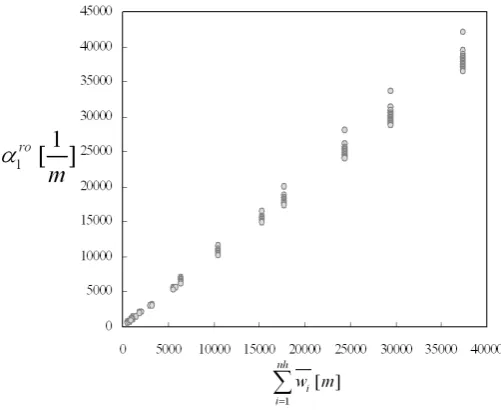
A closure relation for saturated overland flow was obtained by adopting the numerical simulation approach, and using the steady-state solution for the kinematic wave equation governing overland flow, improved to consider the effect of field capacity on water flow through soil media (Ichikawa and Shiiba, 2002). Based on the results of numerical sim-ulations applied to the Weiherbach catchment, several func-tional relationships between saturated overland flow and the state variables relating to overland flow were explored. It was found from these simulations that erois linearly proportional to the product of the average flow depth of the saturated over-land flow zone (yo)and the average velocity of overland flow (vo), i.e.,ero=αro
1 yovo, whereα ro
Fig. 3. Dependence test of parameterα1roto hillslope width.
α1ro and hillslope width does show a small dependence on rainfall intensity, as expressed through the scatter, which in-creases as the size of the REW inin-creases. Generally, how-ever, a strong linear dependence on total hillslope width can be seen in Fig. 3. On the basis of these results, the following closure relation is adopted for saturated overland flow:
ero=αroξryovo (18)
whereξr is defined as the length of channels per unit sur-face area, which can be considered as equivalent to the catch-ment’s drainage density, andαrois now a dimensionless con-stant of proportionality. For the Weiherbach catchment,αro
is 1.0 from Fig. 3.
It is assumed that overland flow over the concentrated overland flow zone, generated by the infiltration excess mechanism, could be closed with a function of the same form as that of saturated overland flow. Therefore, the suggested closure relation is:
eoc=αocξrycvc (19)
whereξr is the length of the channel reach per unit surface area, or drainage density. In both closure relations for sat-urated and concentrated overlad flow, we should take more care about the way to describe velocity terms, vc and vo, in such a way that the velocities estimated from Eqs. (9) and (10), with carefully chosen surface roughnesses and surface slopes at the REW scale, should be compatible with the cor-responding averages estimated from predictions of the dis-tributed model.
3.2.5 Seepage outflow
The closure relation for seepage outflow was obtained by us-ing the numerical simulation approach. For this the
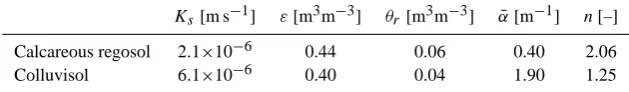
phys-ically based distributed model CATFLOW (Maurer, 1997; Zehe et al., 2001) was used, and applied to the Weiherbach catchment in Germany. CATFLOW is capable of simulating continuous space-time dynamics of water flow and transport of solutes in the upper soil layer of small rural catchments, including channel network and vegetation cover, on event and seasonal time scales, over the three dimensional spatial domain. CATFLOW utilizes the 2-D Richards equation to model water the soil, Penman-Monteith equation for evapo-transpiration, and 1-D Saint-Venant equation for runoff from hillslopes, as well as flow in the drainage network. CAT-FLOW is also capable of handling the presence of macrop-ores (Zehe et al., 2001), with a simplified effective param-eter approach. If water saturation in macroporous soil ex-ceeds field capacity, the bulk hydraulic conductivity at this point is assumed to increase linearly with saturation up to a maximum value at full saturation of the soil. This max-imum value is determined by the macroporosity factor fM. The macroporosity factor is the ratio of the water flow rate in the macropores, in a model element of area A, with the sat-urated water flow rate in the soil matrix. This is a simplified approach, that is however suitable to represent the effect of enhance infiltration due to macropore flow at grid scale of or-der 1000–10 000 m2, as shown by Zehe et al. (2001, 2005b). Because CATFLOW has been verified on the Weiherbach catchment using tracers and rainfall-runoff data, with good success, we are confident that the model is able to reproduce well the internal mechanisms of water movement, storage, runoff generation and evapotranspiration, including the sub-stantial space-time variability.
As a first step, a hillslope with soil catena and a spatial pat-tern of macroporosity typical for the Weiherbach catchment was chosen as the spatial domain (Zehe and Bl¨oschl, 2004).
Table 1. Laboratory measurements of average hydraulic properties for typical Weiherbach soils. Definition of parameters after van Genuchten
(1980) and Mualem (1976). Saturated hydraulic conductivity Ks, porosityε, residual water contentθr, air entry valueα¯, shape parameter n.
Ks [m s−1] ε[m3m−3] θr[m3m−3] α¯[m−1] n [–]
Calcareous regosol 2.1×10⁻⁶ 0.44 0.06 0.40 2.06 Colluvisol 6.1×10⁻⁶ 0.40 0.04 1.90 1.25
The hillslope was discretized into 21 nodes horizontally and 21 layers vertically. In the upper 80% of the hillslope a Loess soil is located; the lower 20% consist of Colluviosol. The dependence of soil water potential and unsaturated hydraulic conductivity on soil moisture saturation is expressed in terms of the van Genuchten (1980) and Mualem (1976) formula-tions (Table 1) given below:
s= θ−θr θs−θr
=
1
1+(α|ψ|)n
n−n1
(20)
K=Kss
1 2
1−h1−sn−n1
in−n12
(21) Vertical soil depth is set at 2 [m]. Following the sugges-tions of Zehe et al. (2001) a spatially variable macro-porosity factor was assigned along the length of the hillslope pro-file, with fixed relative portions 0.6fM for the upper 70%,
1.1fM for the 70 to 85%, and 1.5fM for the 85% to 100% part of the hillslope. The average macro-porosity factor was taken to be fM=2.1. Zehe et al. (2001) showed that a catchment model consisting of 169 of these typical hill-slopes and the related drainage network is sufficient to yield good predictions of discharge (Nash-Sutcliffe efficiency of 0.82), observed ET (correlation 0.92 without a bias) and ob-served soil moisture dynamics at 61 TDR stations (correla-tions between 0.65–0.75). This hillslope can therefore be deemed as typical heterogeneity or “structure” in the Wei-herbach catchment, whose effects have to be parameterised in the form of texture at the REW scale. To check addition-ally the possible influence of small scale variability of sat-urated hydraulic conductivity and porosity, we added a lo-cal fluctuation (in form of multipliers) around the average values presented in Table 1, which was generated using the Turning Bands algorithm using two variograms (nugget vari-ogram with sill=0.023; spherical varivari-ogram with range=2 m, and sill=0.047, average was of course 1) to generate spatially correlated random fields.
For this typical hillslope a series of simulations were car-ried out with two different specified boundary conditions. In the first case, the soil is initially fully saturated with or with-out rainfall events across the hillslope. In this case drainage is occurring over the entire spatial domain of the hillslope, and will reach a steady state after sufficiently long simulation time; this is named the drainage experiment. In the second
case, the soil is initially dry and rainfall occurs continuously at a constant rate, and infiltration is the main hydrological process; this is called the infiltration experiment. The bound-ary conditions used and the mass exchange fluxes required for these studies are described in Fig. 4a. A zero flux bound-ary condition is assigned to the lower and left boundaries of the slope, as shown in Fig. 4a.
The applied artificial rainfall range is from 0 to 1.0 [mm/hr] in steps of 0.1 [mm/hr], and 10, 20, 30 and 40 [mm/hr], which were chosen based on the experience of previous numerical experiments and data interpretation. At rainfall intensities less than 1.0 [mm/hr], the hillslope be-comes almost fully saturated after a 20-month simulation pe-riod from 21/04/1994 to 31/12/1995; this could be regarded as steady state. It is believed that the most transient solu-tion affecting water dynamics in the Weiherbach catchment could be obtained through these simulations. Based on the analysis of the results from infiltration and drainage experi-ments, many functional relationships between seepage flow and combinations of state variables were tested. The results are presented in Fig. 4b; while the empirical results do dis-play certain multi-valuedness, the general trend is still sug-gestive of a power law relation. Therefore, as a first step, an empirical closure relation for seepage flow of the following power law form is adopted:
eos =αos
S |9|
αos
3
(22)
(a) (b)
Figure 4. (a) Hillslope setting for developing closure relation for seepage flux, using CATFLOW simulation; and (b) the best candidate for the seepage flux closure relation where eos, S, and Ψ are seepage outflow,
saturation degree over the entire volume of soil, and the average matric potential head of the soil over the entire unsaturated zone.
55
Fig. 4. (a) Hillslope setting for developing closure relation for seepage flux, using CATFLOW simulation; and (b) the best candidate for the
seepage flux closure relation whereeos, S, and|9|are seepage outflow, saturation degree over the entire volume of soil, and the average matric potential head of the soil over the entire unsaturated zone.
Subsequent tests of parameter dependence revealed a re-lationship of the formαos=αos1 Ks
α2os
, while S is replaced by the ratio of stored water depth in the soil at given time step,
yusuωu+ys, to the total soil depth, Z. Accordingly, the closure relation for seepage outflow can be written as:
eos=αos1 Ks αos
2
yusuωu+ys
Z|9| αos
3
(23) The closure relation for seepage flux, or Eq. (23), was de-veloped for the hillslope setting of Fig. 4a, in which seepage flux is only allowed at the right hand side of the slope. Equa-tion (23) must therefore be modified to incorporate the effect of rising water table causing an increase of the seepage face. For this reason, following Sloan and Moore (1984), Eq. (23) is modified to account for water table rise, and this leads to:
eos=ωoα1osKs
αos2 yusuωu+ys
Z|9| αos
3
(24) For the Weiherbach catchment, estimated values forα1os,α2os,
α3osare 0.01, 0.60, and 0.31 respectively.
3.2.6 Channel flow, and remaining closure relations For the channel inflow and outflow sections, the following closure relation is suggested based on continuity considera-tions:
X l
erAl +erAext=X l
mrlvrl
6 −
mrvr
6 (25)
whereP l
elrAare inflow or outflow discharge thorough chan-nel stream network at the inlet or outlet of each REW and
eextrAis outflow discharge at the outlet of the whole catchment system.mrl andmr are channel cross sectional area of the lth
neighbouring REW and the REW of interest respectively.vrl
andvrare streamflow velocities in channel network at the lth neighbouring REW and the REW of interest respectively.6
is the projected surface area of the REW of interest onto the horizontal plane.
A small steady groundwater flow is allowed to maintain a minimum water quantity in channel during dry periods, and a zero flux condition is assigned across the REW man-tle segment, which is a part of the REW system boundary delimiting the spatial extent of a REW laterally in the sub-surface zone. Rainfall or evaporation to and from the c-, o- and r-zones are assumed to be directly proportional to rainfall intensity or potential evaporation multiplied by the area fraction of each zone. All of the closure relations de-veloped above are summarized in Table 2, and compared against the closure relations previously proposed by Reggiani et al. (1999, 2000) on intuitive grounds.
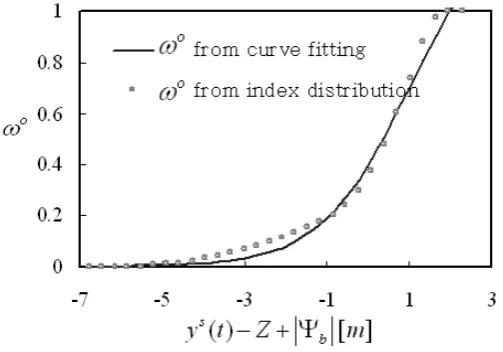
3.3 Constitutive relations for the Weiherbach catchment 3.3.1 Geometric relationship for saturated surface area It is very important to predict the saturated surface area frac-tion that responds to saturated zone depth in reasonable way, since the saturated surface area is directly related to the gen-eration of saturation excess overland flow, as well as seepage outflow. Also, as indicated above, some of the adopted clo-sure relations require the estimate of saturated surface area.
Saturated surface area is the fraction of catchment area caused by the intersection of the water table with the land surface. Hence, it is governed by the dynamics of saturated zone thickness, and by surface topography. Therefore, the relationship between saturated surface area and the depth of saturated zone can be obtained by an understanding of topo-graphic control on saturation area dynamics. In this study, we
[image:13.595.70.522.63.239.2]Table 2. Closure relations for exchanging mass flux.
Flux term Closure relations Closure relations (Reggiani et al., 1999, 2000) (this paper)
Infiltration (euc) min
iωu, Ksωu
suyu
− |9b| su
−1
µ +1
2y
u minh
iωu, ωuKs
1+αuc|9|(s1u−ysuu)εu i
Evapotranspiration (euwg) ωusuep min
ωu ep+Mkvep, αwgu ω
uK
s
(1−su)yu(s u)2+dεu|9
b|
m
Recharge or Capillary rise (eus) εωuvzu αusωuvzu Saturated overland flow (ero) B
or3oryovo
ρ αroξryovo
Concentrated overland flow (eoc) Bco3co(yo4+ρyc)(vo+vc) αocξrycvc
Seepage flow (eos) Ksωo cos(γo)3s12
ys−zr+zs
ωoαos1 Ksα
os
2 hyusuωu+ys
Z|9| iαos3
Inflow and outflow at channel reach (P
l
erAl +eextrA)
±P l
BlrAArAl (vr+vr|l)
2ρ +eextrA P
l mrlvrl
6 −
mrvr
6
Rainfall or evaporation at C -zone (ect op) ωcJ ωcJ
Rainfall or evaporation at O -zone (eot op) ωoJ ωoJ
Rainfall or evaporation at R -zone (ert op) ωrJ ωrJ
Ground flow to channel (ers) Asrhprρ−ps +φr−φsi qs
Mass exchange across mantle segment at U-zone (P
l
euAl +eextuA)
P
l
BluA21ρ[±AuAl,x(vux+vxul)
+ ±AuAl,y(vuy+vuy l)] +e
uA ext
Zero flux boundary condition
Mass exchange across mantle segment at S-zone (P
l
esAl +esAext)
P
l
BlsA21ρ[±AsAl,x(vxs+vsxl)
+ ±AsAl,y(vys+vsy l)] +e
sA ext
[image:14.595.172.424.400.576.2]Zero flux boundary condition
Fig. 5. Geometric relationship for saturated area fraction as a function of averaged thickness of saturated zone.
investigated a possible functional relationship between sat-uration zone depth and saturated surface area by means of the topographic wetness index of TOPMODEL (Beven and Kirkby, 1979).
Application of TOPMODEL theory to the Weiherbach catchment produced the functional form, shown in Fig. 5, for the geometric relationship between saturated surface area
fraction and depth of the saturated zone. This relationship can be expressed as:
ωo=
0
1
β1ωo+βωo2 exp
n
−β3ωo(ys−Z+|9b|)
o− 1
β1ωo+β2ωoexp
n
−βωo3 (zr−zs−Z+|9b|)
o
1
(a) (b)
tivity curve, based on CATFLOW simulations
Figure 6. Catchment scale (a) water retention curve, and (b) hydraulic conduc
57
Fig. 6. Catchment scale (a) water retention curve, and (b) hydraulic conductivity curve, based on CATFLOW simulations.
ifif zr−zs < ys < Z
ifys=Z (26)
where zr, zsand Z are average elevation of channel bed from datum, average elevation of the bottom end of the REW above datum, and the average thickness of the subsurface zone respectively, andβ1ωo,β2ωo andβ3ωo are parameters to be estimated. The details of the derivation procedure for the geometric relationship for saturated surface area are shown in Lee et al. (2005b). For the Weiherbach catchment,β1ωo=0.71,
β2ωo=1.79,β3ωo=0.92 from Fig. 5.
3.3.2 REW scale water retention curve: capillary pressure vs saturation relationship
The REW scale water retention curve represents the soil’s matric potential head in the unsaturated zone as a function of the saturation degree. Such a relation is needed to describe capillary rise of groundwater but also to estimate rate of in-filtration (see Eqs. 13 and 34). In the closely related study of Zehe et al. (2006) numerical experiments were performed to derive this REW scale water retention curve based on time series of both soil saturation and matric potential, that have been integrated over the simulation domain. In this study we use the full size distributed catchment model with the typical structures defined by Zehe et al. (2001) as well as observed boundary conditions (athmosphere at the top, free drainage at the bottom) and simulated the one year period 21/04/1994 to 31/12/1995. The idea is to link the volume integrated sat-uration value and the REW scale matric potential that has evolved under natural conditions (Fig. 6a) by the following functional relationship:
|9| =β1|9|su −β |9|
2 (27)
where β1|9| is the bubling pressure and β2|9| the pore size distribution index. For the Weiherbach catchment,
β1|9|=0.97 (m), β2|9|=0.64 from Fig. 6a. Zehe et al. (2006) worked at the scale of a typical hillslope and imposed artificial boundary conditions during separate wetting and drainage simulation experiments and investigated the effect of matrix and macropore heterogeneities in this context. They obtained different values for the same relationship (cf. discussion section).
3.3.3 Hydraulic conductivity vs saturation relationship Similarly, the unsaturated hydraulic conductivity is needed to describe the change of hydraulic conductivity as a function of saturation degree, which is in our case only important for recharge and capillary rise (infiltration works with the aver-age saturated hydraulic conductivity according to Eq. (13)). In the light of the scaleway concept (Vogel and Roth, 2003) it is clear that, in general, this relationship will be strongly affected by subscale structures such as macropores. How-ever, the macropore system in the Weiherbach catchment is shallow and does not penetrate into the saturated zone, thus recharge is controlled by soil matrix properties. Furthermore, soils are weakly heterogeneous with respect to their matrix properties (Zehe and Bl¨oschl, 2004). Again we employed two approaches to assess the relationship between unsatu-rated hydraulic conductivity and saturation degree based on numerical experiments. In this and the approach of Zehe et al. (2006) we use the same parameteric relation:
K=Ks
su β2K (28)
whereKsis the saturated hydraulic conductivity at the REW scale andβ2K is an exponent to account for capillarity that remains to be estimated. In this approach we again use the full catchment scale model and derived K by three meth-ods of volume weighted averaging of the REV scale values at the nodes at each time step. The first method is geomet-ric averaging, with the resulting average being denoted as
[image:15.595.100.494.65.238.2]KGEO. The second is harmonic averaging for soil layers on each hillslope, followed by arithmetic average for parallel combinations, leading to an average denoted as (KH A). The third method is the same as the second, except that the steps are reversed, i.e., arithmetic first followed by the harmonic for the layers (KAH). The results of these calculations are presented in Fig. 6b expressented in terms of Eq. (28), with the second parameter being estimated by curve fitting. From Fig. 6b, the estimatedKs andβ2K values for the Weiherbach catchment are, respectively, 3.0×10⁻⁶, and 1.68 forK
GEO, 8.0×10⁻⁷, and 1.63 for K
H A, and 7.0×10⁻⁷, and 1.49 for
KAH.
In the companion approach Zehe et al. (2006) used the typ-ical hillslope to simulated drainage and wetting experiments again for well defined artificial instead of observed bound-ary conditions. Regardless of the hydraulic conductivity val-ues that evolved inside the domain, they used the averaged in/outflow at the lower boundary of the domain and the
aver-age saturation and the expression for the REW-scale recharge velocity used here (Eq. 34) to derive parameters for Eq. (28). Again they obtained different results (compare dicussion sec-tion).
3.4 The CREW model
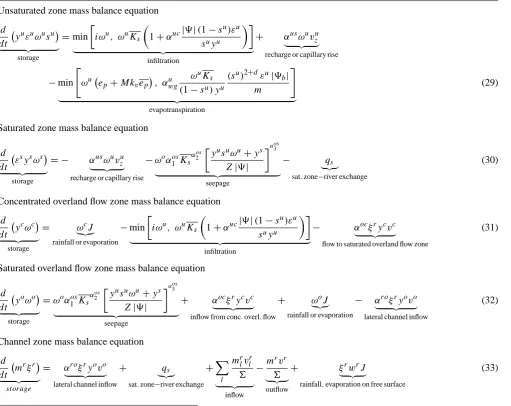
By inserting the derived closure relations into the REW scale mass balance equations, Eq. (1) to (11), we obtained the ba-sic model equations of the CREW model (Cooperative Com-munity Catchment model based on the Representative Ele-mentary Watershed approach, Lee et al., 2006b1). The 13 balance equations for mass and momentum are reduced to 9 with the aid of a series of assumptions used in Reggiani et al. (2000), which help exclude the momentum balance in the horizontal direction in the two subsurface zones. The result-ing equations, includresult-ing the new closure relations, can now be summarized as follows:
Unsaturated zone mass balance equation
d dt y
uεuωusu
| {z }
storage
=min
iωu, ωuKs
1+αuc|9|(1−s
u)εu
suyu
| {z }
infiltration
+ αusωuvzu
| {z } recharge or capillary rise
−min "
ωu ep+Mkvep, αuwg
ωuKs
(1−su) yu
(su)2+dεu|9b|
m
#
| {z }
evapotranspiration
(29)
Saturated zone mass balance equation
d dt ε
sysωs
| {z }
storage
= − αusωuvzu
| {z } recharge or capillary rise
−ωoα1osKs
αos2 yusuωu+ys
Z|9| αos3
| {z }
seepage
− qs
|{z} sat.zone−river exchange
(30)
Concentrated overland flow zone mass balance equation
d dt y
cωc
| {z }
storage
= ωcJ
|{z} rainfall or evaporation
−min
iωu, ωuKs
1+αuc|9|(1−s
u)εu
suyu
| {z }
infiltration
− αocξrycvc
| {z }
flow to saturated overland flow zone
(31)
Saturated overland flow zone mass balance equation
d dt y
oωo
| {z }
storage
=ωoαos1 Ks
αos2 yusuωu+ys
Z|9| αos3
| {z }
seepage
+ αocξrycvc
| {z }
inflow from conc.overl.flow
+ ωoJ
|{z} rainfall or evaporation
− αroξryovo
| {z }
lateral channel inflow
(32)
Channel zone mass balance equation
d dt m
rξr
| {z }
st orage
= αroξryovo
| {z }
lateral channel inflow
+ qs
|{z} sat.zone−river exchange
+X
l
mrlvlr
6
| {z } inflow
−m rvr
6
| {z } outflow
+ ξrwrJ
| {z }
rainfall,evaporation on free surface
(33)
1Lee, H., Sivapalan, M., and Zehe, E.: Cooperative Community Catchment model based on the Representative Elementary Watershed
vzu= K yus
u
|9| −1 2y
u
(34)
vc= 1 nc m
yc
2
3 sin γc 1
2 (35)
vo= 1 no m
yo
2 3
sin γo
1
2 (36)
vr = 1 nr m
v u u t
Rr13
Prlr "
mrlrsin(γr)±X l
1 4y
r mr+ml cosδl
−1
2y rmr
#
(37)
Please note that in doing so, the momentum balance Eq. (8), with respect to the unsaturated zone velocity,vzu, has been rewritten as Eq. (34), following the procedure adopted by Reggiani et al. (2000). The momentum balance equations for the c-, o-, and r-zones, i.e., Eqs. (9), (10) and (11), re-spectively, have been simplified as Eqs. (35), (36) and (37), by adopting the kinematic wave approximation, i.e., by ig-noring the inertial term, and by adopting the relationship be-tween Darcy-Weisbach friction factor and Manning coeffi-cient,ξfi = 8g nim2Ri
1 3
, i=c,o,r, for the second order friction term, Ui, i=c,o,r. The other procedure, which is nec-essary to convert the momentum balance equation for the channel reach, Eq. (11), into Eq. (37), is presented in Reg-giani et al. (2001). Thus, Eqs. (35) and (36) are the REW-scale Manning’s equation for the movement over c- and o-zones, respectively, while Eq. (37) is the REW-scale diffu-sive wave equation for channel flow.
Within the CREW model the balance equations for mass and momentum are solved by the adaptive Runge-Kutta in-tegration method (Press et al., 1992). The current version of CREW model includes a total of 23 parameters: 8 pa-rameters from closure relations (αus, α1os, α2os, α3os, αuc,
αwgu ,αoc,αro), 7 parameters from constitutive relations (β1ωo,
β2ωo,β3ωo,β1|9|,β2|9|,Ks,β2K), 3 Manning roughness coef-ficients (ncm,nom,nrm), porosities of the unsaturated and sat-urated zone (εu, εs), canopy density (M), the saturated hy-draulic conductivity of the saturated zone (Ks
s), and the ratio of potential rates of transpiration and soil surface evapora-tion (kv). All parameters are allowed to be variable across REWs so that the effects of different soil textures, vegetation and geometries across REWs could be taken into account. To run the CREW, the required input information is climate data (rainfall, potential evaporation, and streamflow), and ge-ometric information (length of channel reach at each REW,
area of each REW, topographic slopes of the c-, o-, and r-zones, total soil depth, elevation of channel bed from the datum, and the local angle between channel reachs of two neighbouring REWs). Information regarding to soil textures and vegetation can be imported into the modeling procedure by the relevant parameters. Currently, topographic slopes of the c-, o-, and r-zones are calculated based on the following equation, after Reggiani et al. (1999).
γi =cos−1
6i Si
, i=c, o, r (38)
where6i is projected area of the i-zone onto the horizontal plane and Si is the surface area of i-zone. Si was identified by following the slope in the direction of steepest descent for each grid cell within the digital elevation model and the same Si value was used for the c-, and o-zones. However, it should be pointed out that topographic slopes of the c-, o-, and r-zones in Eq. (35) to (37) are effective values defined at the REW scale and they are introduced to account for the balance of forces at the REW scale. Therefore, topographic slopesγi should be calculated in a way that they assure bal-ance of momentum in the averaging process, and, at the same time, reflect local geometries of the study area. This may give rise to the problem of parameter estimation by consid-eringγi as one of parameters controlling especially the flow routing process.
3.5 Numerical test of the CREW model
Two numerical experiments were designed to see how the derived closure relations respond to combinations of climate, soil, vegetation and topography, within the REW modelling framework. The values of the parameters, input data and ini-tial conditions used in the numerical experiments are summa-rized in Table 3. Sensitivity analyses of infiltration and infil-tration excess surface runoff generation processess were the