AN INNOVATIVE KERNEL FUNCTION FOR THE NLM FILTERING
Zayed M. Ramadan
Telecommunications and Network Engineering Technology, School of Engineering Technology and IT, College of the North Atlantic-Qatar, Doha, Qatar
E-Mail: [email protected]
ABSTRACT
The Gaussian and exponential weighting functions have been used for a long time as standard functions in the conventional nonlocal means (NLM) filtering method and its variants. In this paper, a new weighting function is proposed and tested experimentally in the NLM method. This function is a power-of-two function that is used to measure the similarity between pixels in the reference and search patches of the image pixels. Six images of different features and amounts of details are used in the simulations. Those images were subject to zero mean Gaussian noise with various levels of standard deviation. Peak signal to noise ratio (PSNR) and structural similarity (SSIM) have been used as quantitative indices to measure the performance quality of the proposed weighting function compared to that of the exponential and Gaussian functions. The proposed function outperforms the exponential function in all the tested images and for all values of noise standard deviations, and produces similar results and sometimes slightly better than those of the Gaussian weighting function.
Keywords: kernel function, weighting function, nonlocal means NLM, Gaussian noise, patch similarity.
INTRODUCTION
Images are often subject to several types of noise during acquisition and transmission. Reduction of this noise through image filtering process has gained more attention as a result of its use in many practical applications. Many filtering algorithms have been proposed by researchers in this regard [1]. One approach in this filtering of images uses neighborhood processing in which some function is applied to a local neighborhood of pixels around a center pixel in a sliding window or kernel to estimate the restored or denoised pixel [2-9].
Structure similarity between regions or patches in an image was first used for image restoration in another scheme of filtering called nonlocal means (NLM) filter [10]. The NLM filtering scheme has attracted much attention of researchers and has been used thereafter in several applications such as image in painting [11], segmentation [12], and super resolution [13]. Moreover, it has also been used successfully in synthetic aperture radar (SAR) imaging [14-16].
The conventional NLM method is mainly based on the fact that images often have repeated structures. The idea then is to search for similar pixels to those in the sliding window or kernel, and average them with appropriate weights that are proportional to this similarity. Thus, the noise-free restored pixel at the center of the local neighborhood of pixels being processed is replaced by a weighted average of pixels in a nonlocal region in the image that have similar pixels [10, 17, 18].
Many variants of the NLM method were proposed to improve its performance quality. The proposed method in [19] is for medical ultrasound imaging and it is based on multi-scale nonlocal means to improve the computational complexity of the traditional NLM filter. In [20], the presented method uses the NLM filtering scheme to address the potential noise problem in in-vivo human super-resolution imaging.
The proposed method in [21] is primarily for the spectral computed tomography (SCT) image restoration. In [22], the presented algorithm combines the use of the locally adaptive principal component analysis and the quadtree-based NLM method to reduce the image noise.
The introduced method in [23] addressed the spatial distortion problem based on the multi-resolution analysis (MRA) methods in which the NLM method is exploited to extract the spatial details. Modified versions of the NLM method are proposed in [24, 25] for restoration of low-dose computed tomography (CT) images. A variant NLM method using a hard threshold scheme in curvelet domain is presented in [26]. The method proposed in [27] utilizes the affine invariant self-similarities in the images for reducing the noise.
In the modified version of the NLM proposed in [28], the weights whose values are less than a specific threshold are neglected. The introduced method in [29] applies the NLM method for improving temperature measurements during real-time magnetic resonance thermometry. The weights in the variant NLM method presented in [30] are estimated using the spectral angle mapper method. The proposed scheme in [31] reduces the computational complexity of the traditional NLM method based on Intel Xeon Phi hardware.
The proposed algorithm in [32] uses local self-weight estimation algorithms by utilizing the direct bounds and re-parameterization based on the Baranchik's minimax estimator. In [33], the method is based on patch similarity where only a specific number of the most similar patches are chosen in the computation of the restored pixels. The proposed algorithm for image denoising in [34] utilizes the NLM scheme to address the problem of learning the mapping functions between the low resolution and high resolution images.
the restored pixel value. This paper is focused on proposing a new weighting function for the NLM method. The remainder of this paper is structured as follows: the research method is introduced in section 2, simulation results and discussion are presented in section III and the conclusions are finally given in section IV.
RESEARCH METHOD
The kernel function, used to compute the weighting factors of a search neighborhood of pixels in the conventional NLM filtering method, has a crucial effect on the performance of the method, and thus on the quality of the output filtered image. The conventional Gaussian and exponential functions commonly used in the NLM method are defined as follows:
Gaussian Kernel Function:
𝑤(𝑖, 𝑗) = 𝑒𝑥𝑝 (−‖𝑁(𝑖)−𝑁(𝑗)‖2
2ℎ2 ) (1)
Exponential Kernel Function:
𝑤(𝑖, 𝑗) = 𝑒𝑥𝑝 (−‖𝑁(𝑖)−𝑁(𝑗)‖2
ℎ ) (2)
In this paper, a power-of-two proposed function is defined as follows:
Proposed Function:
𝑤(𝑖, 𝑗) = 2(−‖𝑁(𝑖)−𝑁(𝑗)‖2ℎ2 ) , (3)
where ℎ is a smoothing filtering factor that controls decaying of the function, and ‖𝑁(𝑖) − 𝑁(𝑗)‖2 is the weighted Euclidean distance between the pixels in the noisy patches 𝑁(𝑖) and 𝑁(𝑗). The value of the weight
𝑤(𝑖, 𝑗) varies between 0 and 1, i.e.,
0 ≤ 𝑤(𝑖, 𝑗) ≤ 1 (4)
Several performance measuring metrics are typically used by researchers to compute the quality of the image restoration algorithms, i.e., the similarity or closeness between the output (restored) image and the true image before being corrupted, and the capability of preserving image details and edges. In this paper, the peak signal to noise ratio (PSNR) and the structural similarity (SSIM) indices are used in the simulations. These performance measuring quality indices are defined as follows:
𝑀𝑆𝐸 =𝑀𝑁 ∑ ∑(𝐹1 𝑖,𝑗− 𝑇𝑖,𝑗)2 𝑁
𝑗=1 𝑀
𝑖=1
(5)
𝑃𝑆𝑁𝑅 = 10 𝑙𝑜𝑔10((𝐿 − 1) 2
𝑀𝑆𝐸 ) dB, (6)
where MSE is the mean squared error between the filtered output image (F) and the original true image (T), 𝐿 = 2𝑛 and 𝑛 is the bit depth or the number of bits in each pixel (for 8-bit images, for example, 𝑛=8 and 𝐿=256), M and N
are the total number of pixels in the horizontal and vertical dimensions of the image (rows and columns of the matrix representing the image), and 𝐹𝑖,𝑗 and 𝑇𝑖,𝑗are the pixel values in the (𝑖, 𝑗)𝑡ℎ locations of the filtered image and the true clean image, respectively.
The structural similarity (SSIM) index is a full performance measuring metric that is generally used to measure the closeness or similarity between a specific image and a reference one. Typically, it is used for measuring the quality of the restored output image with the original clean image used as a reference. Unlike peak signal-to-noise ratio (PSNR), the SSIM metric is based on visible structures in the image. It is claimed to be an improvement over other traditional metrics such as PSNR and MSE, which might not be consistent with human eye perception. It combines the luminance, contrast, and structure of the images into one single performance measuring index. In particular, the SSIM quality metric between two image signals 𝑥 and 𝑦 is a function of three components: luminance (l), contrast (c), and structure (s),
where the luminance is a function of the mean intensities of these two images, the contrast is a function of their standard deviations, and the structure is a function of their covariance. The SSIM quality index can be defined as follows [35].
𝑆𝑆𝐼𝑀(𝑥, 𝑦) = [𝑙(x, y)]∝. [𝑐(x, y)]𝛽. [𝑠(x, y)]𝛾, (7)
where 𝑙(x, y), is the luminance comparison function,
𝑐(x, y) is the contrast comparison function and 𝑠(x, y) is the structure comparison function. If we choose 𝛼 = 𝛽 =
𝛾 = 1, the SSIM is simplified to
𝑆𝑆𝐼𝑀(x, y) = (2𝜇𝑥𝜇𝑦+𝐶1)(2𝜎𝑥𝑦+𝐶2)
(𝜇𝑥2+𝜇𝑦2+𝐶1)(𝜎𝑥2+𝜎𝑦2+𝐶2) , (8)
where 𝜇𝑥 and 𝜇𝑦 are the mean values of the 𝑥 and 𝑦 images, respectively, 𝜎𝑥2 and 𝜎𝑦2 are their variances, and
𝜎𝑥𝑦 is their covariance. The constants 𝐶1 and 𝐶2 are selected to avoid instability of the luminance, contrast and structure comparison functions that constitute the SSIM index. It should be noted that in the expression of the SSIM shown above, the relative importance of these three functions or components are assumed to be the same.
RESULTS AND DISCUSSIONS
size is chosen to be 7×7 and the size of the search window is 21×21.
Tables 1-6 show the performance measuring quality of the NLM method using Gaussian, exponential and a proposed kernel function for images corrupted with zero-mean Gaussian noise and a standard deviation that varies from 10 to 80. These tables use the six tested images, i.e., Pirate, Street, Trees, Cat, Mountain and Baboon, respectively.
The proposed kernel function outperforms the exponential function for all the tested images and for all values of noise standard deviation as shown in Tables 1-6.
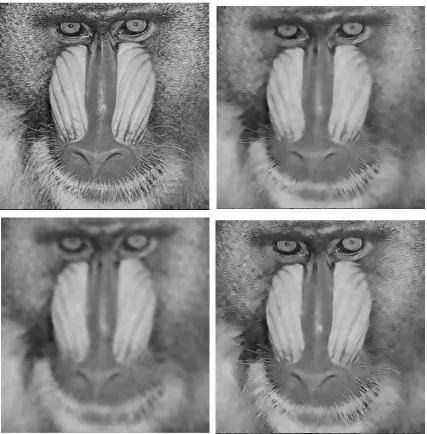
Compared with the Gaussian function, the proposed function produces comparable results and sometimes better performance quality results. To clarify the visual quality of these filters, Figure-2 shows the performance quality of the NLM method using the Gaussian, exponential and proposed weighting functions for Baboon image contaminated by zero mean Gaussian noise with standard deviation of 40. The superiority of the proposed function over the exponential function and to a less extent over the Gaussian function is depicted clearly in this figure.
Figure-1. Tested images from left to right. First row: Pirate, Street, Trees. Second row: Cat, Mountain and Baboon.
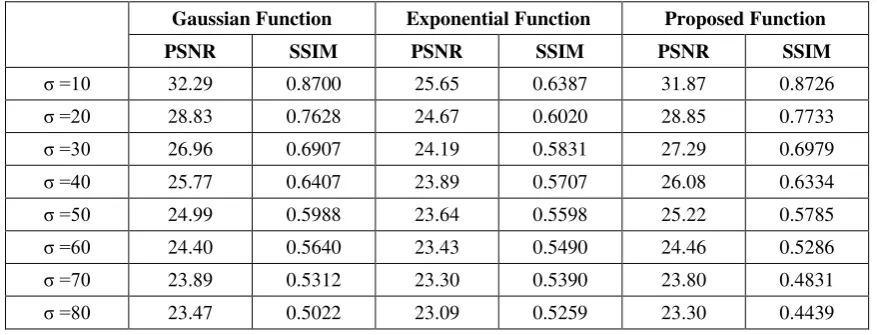
Table-1. PSNR and SSIM of the NLM method with different kernel functions using Pirate image corrupted with Gaussian noise of zero mean and several values of standard deviation.
Gaussian Function Exponential Function Proposed Function PSNR SSIM PSNR SSIM PSNR SSIM
σ =10 32.29 0.8700 25.65 0.6387 31.87 0.8726
σ =20 28.83 0.7628 24.67 0.6020 28.85 0.7733
σ =30 26.96 0.6907 24.19 0.5831 27.29 0.6979
σ =40 25.77 0.6407 23.89 0.5707 26.08 0.6334
σ =50 24.99 0.5988 23.64 0.5598 25.22 0.5785
σ =60 24.40 0.5640 23.43 0.5490 24.46 0.5286
σ =70 23.89 0.5312 23.30 0.5390 23.80 0.4831
[image:3.595.79.518.604.771.2]Table-2. PSNR and SSIM of the NLM method with different kernel functions using Street image corrupted with Gaussian noise of zero mean and several values of standard deviation.
Gaussian Function Exponential Function Proposed Function PSNR SSIM PSNR SSIM PSNR SSIM
σ =10 31.69 0.8414 24.57 0.6147 31.35 0.8486
σ =20 28.35 0.7536 22.82 0.5634 28.22 0.7626
σ =30 26.28 0.6862 22.03 0.5382 26.34 0.6917
σ =40 24.77 0.6285 21.62 0.5233 25.06 0.6293
σ =50 23.73 0.5826 21.33 0.5108 23.99 0.5698
σ =60 22.90 0.5414 21.17 0.5004 23.21 0.5192
σ =70 22.15 0.5028 21.02 0.4902 22.55 0.4756
σ =80 21.65 0.4722 20.85 0.4767 21.95 0.4344
Table-3. PSNR and SSIM of the NLM method with different kernel functions using Trees image corrupted with Gaussian noise of zero mean and several values of standard deviation.
Gaussian Function Exponential Function Proposed Function PSNR SSIM PSNR SSIM PSNR SSIM
σ =10 30.64 0.8484 22.35 0.5650 30.52 0.8559
σ =20 26.67 0.7489 21.33 0.5207 26.43 0.7627
σ =30 24.56 0.6672 20.88 0.4999 24.65 0.6862
σ =40 23.09 0.6030 20.63 0.4862 23.52 0.6156
σ =50 22.13 0.5495 20.43 0.4758 22.62 0.5532
σ =60 21.52 0.5099 20.31 0.4668 21.92 0.4999
σ =70 21.03 0.4738 20.15 0.4551 21.34 0.4537
σ =80 20.63 0.4424 20.08 0.4438 20.90 0.4153
Table-4. PSNR and SSIM of the NLM method with different kernel functions using CAT image corrupted with Gaussian noise of zero mean and several values of standard deviation.
Gaussian Function Exponential Function Proposed Function PSNR SSIM PSNR SSIM PSNR SSIM
σ =10 32.11 0.8806 26.25 0.6431 31.73 0.8891
σ =20 28.63 0.7469 25.59 0.6212 28.89 0.7684
σ =30 27.22 0.6811 25.24 0.6088 27.46 0.6835
σ =40 26.37 0.6334 24.95 0.5972 26.48 0.6164
σ =50 25.74 0.5952 24.76 0.5843 25.70 0.5580
σ =60 25.21 0.5579 24.55 0.5712 25.05 0.5072
σ =70 24.81 0.5253 24.42 0.5587 24.57 0.4626
Table-5. PSNR and SSIM of the NLM method with different kernel functions using Mountain image corrupted with Gaussian noise of zero mean and several values of standard deviation.
Gaussian Function Exponential Function Proposed Function PSNR SSIM PSNR SSIM PSNR SSIM
σ =10 29.18 0.9211 19.08 0.4734 29.08 0.9216
σ =20 24.22 0.8056 17.67 0.3893 23.98 0.8225
σ =30 21.83 0.6803 17.16 0.3571 21.74 0.7246
σ =40 20.21 0.5763 16.87 0.3386 20.54 0.6368
σ =50 19.01 0.4949 16.70 0.3256 19.66 0.5575
σ =60 18.16 0.4354 16.57 0.3164 18.90 0.4916
σ =70 17.62 0.3943 16.48 0.3090 18.30 0.4412
σ =80 17.26 0.3619 16.42 0.3024 17.76 0.3984
Table-6. PSNR and SSIM of the NLM method with different kernel functions using Baboon image corrupted with Gaussian noise of zero mean and several values of standard deviation.
Gaussian Function Exponential Function Proposed Function PSNR SSIM PSNR SSIM PSNR SSIM
σ =10 29.95 0.9099 21.03 0.4597 29.72 0.9105
σ =20 25.67 0.7765 20.34 0.4019 25.39 0.7992
σ =30 23.05 0.6260 20.10 0.3819 23.68 0.6894
σ =40 21.64 0.5249 19.97 0.3710 22.41 0.5866
σ =50 20.97 0.4660 19.89 0.3649 21.52 0.5075
σ =60 20.56 0.4236 19.81 0.3575 20.92 0.4519
σ =70 20.26 0.3955 19.76 0.3534 20.51 0.4081
Figure 2. From left to right. 1st row: Baboon image corrupted by zero mean Gaussian noise with σ =40, restored image using Gaussian weighting function. 2nd row: restored image using the exponential function, restored image using the proposed function.
CONCLUSIONS
In this paper, a new kernel weighting function is proposed for nonlocal means filtering method. Namely, a power-of-two function is implemented in the conventional NLM method and tested experimentally using many images of different characteristics, six of which are shown in this paper. These images have been corrupted with zero-mean Gaussian noise with a wide range of standard deviation values that varies from 10 to 80. The results show superior performance of the proposed function compared to that of the exponential function. Moreover, the proposed function shows comparable results and some times better than the Gaussian weighting function.
REFERENCES
[1] P. Milanfar. 2013. A Tour of Modern Image Filtering: New Insights and Methods, Both Practical and Theoretical. IEEE Signal Processing Magazine. 30(1): 106-128.
[2] Z. M. Ramadan. 2012. Efficient Restoration Method for Images Corrupted with Impulse Noise. Circuits, Systems, and Signal Processing. 31(4): 1397-1406.
[4] Z. M. Ramadan. 2014. A New Method for Impulse Noise Elimination and Edge Preservation. Canadian Journal of Electrical and Computer Engineering. 37(1): 2-10.
[5] T. Veerakumar, R. P. Jagannath, B. N. Subudhi, S. Esakkirajan. 2017. Impulse Noise Removal Using Adaptive Radial Basis Function Interpolation. Circuits, Systems, and Signal Processing. 36(3): 1192-1223.
[6] Z. M. Ramadan. 2014. Salt-and-Pepper Noise Removal and Detail Preservation Using Convolution Kernels and Pixel Neighborhood. American Journal of Signal Processing. 4(1): 16-23.
[7] P. Civicioglu. 2007. Using Uncorrupted Neighborhoods of the Pixels for Impulsive Noise Suppression with ANFIS, IEEE Transactions on Image Processing. 16(3): 759-773.
[8] Z. M. Ramadan. 2018. Optimum Image Filters for Various Types of Noise. TELKOMNIKA. 16(5): 2458-2464.
[9] Z. M. Ramadan. 2015. Restoration of Video Signals Using Adaptive Size of Sliding Window. Electrical and Electronic Engineering. 5(2): 34-41.
[10] A. Buades, B. Coll, and J. M. Morel. 2005. A Non- Local Algorithm for Image Denoising. In Proc. IEEE CVPR. 2: 60-65.
[11] Wong and J. Orchard. 2008. A Nonlocal-Means Approach to Exemplar-Based Inpainting. In Proc. IEEE ICIP. pp. 2600-2603.
[12] P. Lee and Y. Wu. 2011. Nonlocal Matting. In Proc. CVPR. pp. 2193-2200.
[13] M. Protter, M. Elad, H. Takeda, and P. Milanfar. 2009. Generalizing the Nonlocal-Means to Super-Resolution Reconstruction. IEEE Transactions on Image Processing. 18(1): 36-51.
[14] A. Deledalle, L. Denis, and F. Tupin. 2009. Iterative Weighted Maximum Likelihood Denoising with Probabilistic Patch-Based Weights. IEEE Transactions on Image Processing. 18(12): 2661-2672.
[15] S. Parrilli, M. Poderico, C. V. Angelino, L. Verdoliva. 2012. A Nonlocal SAR Image Denoising Algorithm Based on LLMMSE Wavelet Shrinkage.
IEEE Transactions on Geoscience and Remote Sensing. 50(2): 606-616.
[16] A. Deledalle, L. Denis, and F. Tupin. 2011. NL-InSAR: Non-Local Interferogram Estimation. IEEE Transactions on Geoscience and Remote Sensing. 49(4): 1441-1452.
[17] B. Xiong, Z. Yin. 2012. A Universal Denoising Framework with a New Impulse Detector and Nonlocal Means. IEEE Transactions on Image Processing. 21(4): 1663-1675.
[18] Chan, R. Fulton, R. Barnett, D. D. Feng, S. Meikle. 2014. Postreconstruction Nonlocal Means Filtering of Whole-Body PET with an Anatomical Prior. IEEE Transactions on Medical Imaging. 33(3): 636-650.
[19] L. H. Breivik, S. R. Snare, E. N. Steen, A. H. Solberg. 2017. Real-Time Nonlocal Means-Based Despeckling. IEEE Transactions on Ultrasonics, Ferroelectrics, and Frequency Control. 64(6): 959-977.
[20] P. Song, J. D. Trzasko, A. Manduca, R. Huang, R. Kadirvel, D. F. Kallmes, S. Chen. 2018. “Improved Super-Resolution Ultrasound Microvessel Imaging With Spatiotemporal Nonlocal Means Filtering and Bipartite Graph-Based Microbubble Tracking. IEEE Transactions on Ultrasonics, Ferroelectrics, and Frequency Control. 65(2): 149-167.
[21] Zeng, J. Huang, H. Zhang, Z. Bian, S. Niu, Z. Zhang, Q. Feng, W. Chen, J. Ma. 2016. Spectral CT Image Restoration via an Average Image-induced Nonlocal Means Filter. IEEE Transactions on Biomedical Engineering. 63(5): 1044-1057.
[22] C. Zuo, L. Jovanov, B. Goossens, H. Q. Luong, W. Philips, Y. Liu, M. Zhang. 2016. Image Denoising Using Quadtree-Based Nonlocal Means with Locally Adaptive Principal Component Analysis. IEEE Signal Processing Letters. 23(4): 434-438.
[23] H. Yin, S. Li. 2015. Pansharpening with Multiscale Normalized Nonlocal Means Filter: A Two-Step Approach. IEEE Transactions on Geoscience and Remote Sensing. 53(10): 5734-5745.
[25] M. Diwakar, M. Kumar. 2018. CT Image Denoising Using NLM and Correlation-Based Wavelet Packet Thresholding. IET Image Processing. 12(5): 708-715.
[26] S. K. Panigrahi, S. Gupta, P. K. Sahu. 2018. Curvelet-Based Multiscale Denoising Using Non-Local Means & Guided Image Filter. IET Image Processing. 12(6): 909-918.
[27] V. Fedorov, C. Ballester. 2017. Affine Non-Local Means Image Denoising. IEEE Transactions on Image Processing. 26(5): 2137-2148.
[28] S. Ghosh, A. K. Mandal, K. N. Chaudh. 2017. Pruned Non-Local Means. IET Image Processing. 11(5): 317-323.
[29] C. Zachiu, M. Ries, C. M. Senneville. 2017. An Adaptive Non-Local-Means Filter for Real-Time MR-Thermometry. IEEE Transactions on Medical Imaging. 36(4): 904-916.
[30] J. Bai, W. Zhang, Z. Gou, L. Jiao. 2017. Nonlocal-Similarity-Based Sparse Coding for Hyperspectral Imagery Classification. IEEE Geoscience and Remote Sensing Letters. 14(9): 1474-1478.
[31] Huang, B. Lan, J. Tao, Y. Chen, X. Tan, J. Feng, Y. Ma. 2017. A Parallel Nonlocal Means Algorithm for Remote Sensing Image Denoising on an Intel Xeon Phi Platform. IEEE Access. 5: 8559-8567.
[32] M. P. Nguyen, S. Y. Chun. 2017. Bounded Self-Weights Estimation Method for Non-Local Means Image Denoising Using Minimax Estimators. IEEE Transactions on Image Processing. 26(4): 1637-1649.
[33] S. Xu, Y. Zhou, H. Xiang, S. Li. 2017. Remote Sensing Image Denoising Using Patch Grouping-Based Nonlocal Means Algorithm. IEEE Geoscience and Remote Sensing Letters. 14(12): 2275-2279.
[34] J. Jiang, X. Ma, C. Chen, T. Lu, Z. Wang, J. Ma. 2017. Single Image Super-Resolution via Locally Regularized Anchored Neighborhood Regression and Nonlocal Means. IEEE Transactions on Multimedia. 19(1): 15-26.