ScholarWorks @ Georgia State University
ScholarWorks @ Georgia State University
Communication Sciences and Disorders
Dissertations Department of Communication Sciences and Disorders
8-11-2011
Evaluating the Relationship Among Parents' Oral and Written
Evaluating the Relationship Among Parents' Oral and Written
Language Skills, the Home Literacy Environment, and their
Language Skills, the Home Literacy Environment, and their
Preschool Children's Emergent Literacy Skills
Preschool Children's Emergent Literacy Skills
Nicole A. Taylor Georgia State University
Follow this and additional works at: https://scholarworks.gsu.edu/epse_diss
Part of the Educational Psychology Commons, and the Special Education and Teaching Commons
Recommended Citation Recommended Citation
Taylor, Nicole A., "Evaluating the Relationship Among Parents' Oral and Written Language Skills, the Home Literacy Environment, and their Preschool Children's Emergent Literacy Skills." Dissertation, Georgia State University, 2011.
https://scholarworks.gsu.edu/epse_diss/74
This dissertation, EVALUATING THE RELATIONSHIP AMONG PARENTS’ ORAL AND WRITTEN LANGUAGE SKILLS, THE HOME LITERACY ENVIRONMENT, AND THEIR PRESCHOOL CHILDREN’S EMERGENT LITERACY SKILLS by NICOLE A. TAYLOR, was prepared under the direction of the candidate’s Dissertation Advisory Committee. It is accepted by the committee members in partial fulfillment of the requirements for the degree of Doctor of Philosophy in the College of Education, Georgia State University.
The Dissertation Advisory Committee and the student’s Department Chair, as representatives of the faculty, certify that this dissertation has met all standards of excellence and scholarship as determined by the faculty. The Dean of the College of Education concurs.
____________________________ ______________________________
Daphne Greenberg, Ph.D. Nicole Patton-Terry, Ph.D.
Committee Co-Chair Committee Co-Chair
____________________________ ____________________________
Gary Bingham, Ph.D. Laura Fredrick, Ph.D.
Committee Member Committee Member
____________________________ Date
____________________________ Gwendolyn T. Benson, Ph.D.
Interim Chair, Department of Educational Psychology and Special Education Associate Dean of School and Community Partnership
College of Education
____________________________ R. W. Kamphaus, Ph.D.
By presenting this dissertation as a partial fulfillment of the requirements for the
advanced degree from Georgia State University, I agree that the library of Georgia State University shall make it available for inspection and circulation in accordance with its regulations governing materials of this type. I agree that permission to quote, to copy from, or to publish this dissertation may be granted by the professor under whose direction it was written, by the College of Education’s director of graduate studies and research, or by me. Such quoting, copying, or publishing must be solely for scholarly purposes and will not involve potential financial gain. It is understood that any copying from or publication of this dissertation which involves potential financial gain will be not allowed without my written permission.
__________________________________________
All dissertations deposited in the Georgia State University library must be used in
accordance with the stipulations prescribed by the author in the preceding statement. The author of this dissertation is:
Nicole Alicia Taylor 888 Tift Avenue SW Atlanta, GA 30310 The directors of this dissertation are:
Dr. Daphne Greenberg
Department of Educational Psychology and Special Education College of Education
Georgia State University Atlanta, GA 30303-3083
Dr. Nicole Patton-Terry
Department of Educational Psychology and Special Education College of Education
Nicole Alicia Taylor
ADDRESS: 888 Tift Avenue SW
Atlanta, GA 30310 EDUCATION:
Ph.D. 2011 Georgia State University Educational Psychology M.A. 2005 University of Michigan
Educational Studies; Language, Literacy, and Culture
B.A. 2004 Spelman College
Child Development
Certification Early Childhood Education (P-5), State of Georgia, 2005 Reading (P-12), State of Georgia, 2006
PROFESSIONAL EXPERIENCE:
2009-Present Language and Literacy Fellow
Georgia State University, Atlanta, GA
2010-Present Graduate Teaching Assistant
Georgia State University, Atlanta, GA
EDUC 2120: Exploring Sociocultural Perspectives and Diversities on Education
EDUC 2130: Exploring Learning and Teaching EPY 2050: Human Growth and Development
2010-2011 Part-Time Instructor
Spelman College, Atlanta, GA EDU 204: Educational Psychology
EDU 224: Child Development Theories and Patterns
2007-2009 Cognitive Development Specialist
Department of Psychology, Georgia State University, Atlanta, GA
2005-2007 General Education Teacher
Atlanta Public Schools, Atlanta, GA
PUBLICATIONS:
Greenberg, D., & Taylor, N. (in-preparation). A fluency intervention for adult struggling readers.
Greenberg, D., & Taylor, N. (in-preparation). World knowledge and reasoning skills of adults reading below the sixth grade level.
PRESENTATIONS:
Taylor, N. (2011, April). Exploring the syntactic skills of struggling adult readers. Poster Session at Language and Literacy Day; Research on the Challenges of Acquiring Language and Literacy, Atlanta, GA.
Taylor, N., Greenberg, D., Laures-Gore, J., & Wise, J. (2011, February).
Exploring the syntactic skills of struggling adult readers. Poster Session at the Learning Disabilities of America 48th International Conference, Jacksonville, FL.
Greenberg, D., & Taylor, N. (2009, November). Women and literacy: What are the issues? Member of panel at the National Women’s Studies Association
Annual Conference, Atlanta, Georgia.
Taylor, N. (2008, October). Reading in early literacy classrooms, EDLA 8020, Georgia State University, Atlanta, GA.
Cohen, E., Taylor, N., Sevick, R., & Morris, R. (2008, June). Combining the PHAST and RAVE-O programs: Strategies for struggling readers.
Concurrent session presenter at the University ofWest Georgia Learning Festival, Carollton, GA.
Cohen, E., Foster, M., Taylor, N., Bucklen, M., Sevick, R., & Morris, R. (2008, June). Differentiated math instruction for students with intellectual disabilities. Concurrent session presenter at the University of West Georgia Learning Festival, Carollton, GA.
PROFESSIONAL SOCIETIES AND ORGANIZATIONS
American Education Research Association (AERA), Student Affiliate Society for Scientific Studies of Reading (SSSR), Student Affiliate
EVALUATING THE RELATIONSHIP AMONG PARENTS’ ORAL AND WRITTEN LANGUAGE SKILLS, THE HOME LITERACY ENVIRONMENT, AND
THEIR PRESCHOOL CHILDREN’S EMERGENT LITERACY SKILLS
by
Nicole A. Taylor
Studies have examined the impact of parents’ educational level on their child’s
emergent literacy skills and have found positive associations (Korat, 2009). However, a
review of the literature indicates that previous studies have not investigated whether
parents’ oral and written language skills relate to their child’s emergent oral and written
language skills. This is important in light of the fact that parents’ educational level does
not provide a complete picture of their academic skills (Greenberg, 1995). In addition to
parental characteristics, the home literacy environment (HLE) is seen as important in the
growth of children’s emergent literacy skills (Hood, Conlon, & Andrews, 2008). The two
studies in this investigation explored the relationships among parental oral and written
language skills, the HLE, and preschoolers’ emergent literacy skills. Both studies
included 96 parent-child dyads. The first study examined the relationship between
parents’ oral and written language skills and their preschoolers’ oral and written language
skills. All participants were assessed on various oral and written language measures.
Descriptive analyses, one-way Analysis of Variance (ANOVA), correlations, and
regressions were conducted to assess the relationships between the parent skills and child
skills. Most of the parental skills were found to have a relationship with the child skills.
The second study extended the first study by examining the relationships between
and oral and written language skills), and children’s emergent literacy skills. Descriptive
analyses, one-way ANOVA, correlations, and regressions were employed to gain
information about the relationships among the variables. The HLE (measured by
responses to the HLES and TRT) had positive relationships with parents’ skills and
children’s skills. However, the HLE did not predict the children’s skills beyond the
contribution of parental characteristics. Interpreting the results of this study promotes
thought about the specific role of the HLE as a potential mediator between parental
characteristics and child skills. Altogether, both studies provide preliminary information
EVALUATING THE RELATIONSHIP AMONG PARENTS’ ORAL AND WRITTEN LANGUAGE SKILLS, THE HOME LITERACY ENVIRONMENT, AND
THEIR PRESCHOOL CHILDREN’S EMERGENT LITERACY SKILLS
by
Nicole A. Taylor
A Dissertation
Presented in Partial Fulfillment of Requirements for the Degree of
Doctor of Philosophy in
Educational Psychology in
the Department of Educational Psychology and Special Education in
the College of Education Georgia State University
Copyright by Nicole A. Taylor
ii
ACKNOWLEDGMENTS
I would first like to acknowledge God as it is through his plan and perfect will that I have accomplished this dream that he placed in my heart many years ago.
I would like to thank Dr. Daphne Greenberg for the endless hours she contributed to help facilitate my graduate experience. If I had one dollar to give for every time you answered a question or provided guidance, you would be a millionaire! It has truly been an honor to work with an advisor who is as compassionate, meticulous, and knowledgeable as you. The words I speak here do not give justice to the impact you have had, as you are truly one-of a kind.
I would like to thank Dr. Nicole Patton-Terry for her role as my dissertation co-chair. I am grateful to you for seeking opportunities that helped me make great progress during my dissertation process. I also appreciate all of the candid advice you gave as a mentor. I would also like to thank Dr. Laura Fredrick. You have always been encouraging and your wisdom is invaluable. I would also like to thank Dr. Gary Bingham for his willingness to share his expertise in early childhood.
I would like to thank the Atlanta Preschools Pursing Excellence (APPLE) project and Smart Start, the early learning division of United Way Metropolitan Atlanta. Your enthusiasm for my work and partnership is immensely appreciated.
iii
TABLE OF CONTENTS
Page
List of Tables ... iv
Abbreviations ... vii
Chapter 1 THE RELATIONSHIP BETWEEN PARENTS’ ORAL AND WRITTEN LANGUAGE SKILLS AND THEIR PRESCHOOL CHILDREN’S ORAL AND WRITTEN LANGUAGE SKILLS ...1
Introduction ...1
Methods...14
Results ...21
Discussion ...35
References ...41
2 THE RELATIONSHIP BETWEEN THE HOME LITERACY ENVIRONMENT, PARENTAL CHARACTERISTICS, AND CHILDREN’S EMERGENT LITERACY SKILLS ...50
Introduction ...50
Methods...61
Results ...69
Discussion ...82
References ...88
iv
LIST OF TABLES
Table Page
1 Descriptive Statistics for Demographic Characteristics for Adults and
Children………..15
2 Description of Adult Participants by Educational Level………...16
3 Raw Score and Standard Score Performance of Pre-K Parents on Oral and Written Language Measures………..23
4 Raw Score and Standard Score Performance of Pre-K Children on Oral and Written Language Measures………..24
5 Comparison of Adult Demographics by Site………26
6 Comparison of Adult Skills by Site………..27
7 Comparison of Child Demographics by Site………28
8 Comparison of Child Skills by Site………...28
9 Correlations among Parents’ Educational Level, Parental Oral and Written Language Skills, and Child Oral and Written Language Skills……….30
10 Hierarchial Regression Assessing Prediction of Child Receptive Vocabulary….32 11 Hierarchial Regression Assessing Prediction of Child Expressive Vocabulary…32 12 Hierarchial Regression Assessing Prediction of Child Phonological Awareness.33 13 Hierarchial Regression Assessing Prediction of Child Alphabet Knowledge…...34
v
LIST OF TABLES
Table Page
15 Descriptive Statistics for Demographic Characteristics for Adults and
Children………..63
16 Description of Adult Participants by Educational Level………...63
17 Comparison of Adult Demographics by Site……….71
18 Comparison of Adult Skills by Site………...72
19 Comparison of Child Demographics by Site……….72
20 Comparison of Child Skills by Site………...73
21 Percentages and Frequencies of Parent Responses to Engaging in Weekly Reading………..74
22 Percentages and Frequencies of Parent Responses to Question about Another Person Reading to Child………74
23 Percentages and Frequencies of Parent Responses to Questions about Library Visits……….75
24 Percentages and Frequencies for Parents’ Responses to Questions about Teaching of Literacy Skills and Reading Habits………...75
25 Percentage of Parents Indicating Recognition for Real and Foil Titles on the TRT……….76
26 Correlations among Parent Oral and Written Language Skills, and the HLES and TRT………77
27 Correlations among Child Skills, and the HLES and TRT………78
vi
29 Regression Assessing Prediction of Child Expressive Vocabulary………..79
30 Regression Assessing Prediction of Child Alphabet Knowledge……….80
31 Regression Assessing Prediction of Child Phonological Awareness………81
vii
ABBREVIATIONS
EVT Expressive Vocabulary Test
HLE Home Literacy Environment
HLES Home Literacy Environment Survey
PALS Phonological Awareness Literacy Screening
PPVT Peabody Picture Vocabulary Test
TRT Title Recognition Test
CHAPTER 1
THE RELATIONSHIP BETWEEN PARENTS’ ORAL AND WRITTEN LANGUAGE
SKILLS AND THEIR PRESCHOOL CHILDREN’S EMERGENT LITERACY SKILLS
Introduction
Previous literature describes how a child’s oral and written language attainment is
influenced by parents’ educational level (Korat, 2009; Magnuson, Sexton, Davis-Kean, &
Huston, 2009). However, a review of the literature indicates that previous studies have
not investigated the specific relationship between parents’ oral and written language
skills and their children’s oral and written language skills. The purpose of this study is to
expand our understanding of the nature of this relationship. Specifically, this study
explores the relationship between parents’ oral (receptive and expressive vocabulary) and
written (decoding, word recognition, fluency) language skills and their preschool
children’s oral (receptive and expressive vocabulary, phonological awareness) and
written (letter knowledge, print awareness) language skills.
Emergent Oral and Written Language Skills and Their Importance during the
Preschool Years
Emergent literacy, also known as preliteracy skills, consists of several oral and
written elements. Oral related elements include receptive vocabulary (e.g., the vocabulary
an individual understands the meaning of; National Early Literacy Panel [NELP], 2008),
expressive vocabulary (e.g., the vocabulary used to communicate in speaking; Gettinger
& Stoiber, 2008), and phonological awareness (e.g., the ability to detect and manipulate
the sounds of spoken language independent of meaning; Whitehurst & Lonigan, 1998).
the alphabet; Molfese, Modglin, et al., 2006) and print awareness (e.g., knowing that
writing goes from left to right; Whitehurst & Lonigan, 1998).
Most children develop preliteracy skills prior to school attendance, and are better
prepared to engage in the task of learning to read, compared with children who lack these
foundational skills (NELP, 2008; Wasik, Bond, & Hindman, 2006). These foundational
skills are linked to children’s long term academic success (Gettinger & Stoiber, 2008;
NELP, 2008; Townsend & Konold, 2010). For example, Gettinger and Stoiber (2008)
discussed how many young children face difficult challenges learning to read because
they lack significant early literacy skills when they begin school. According to the
authors, children who are poor readers at the end of elementary school are most often
those who failed to develop preliteracy skills in preschool and kindergarten. The
preliteracy skills of oral vocabulary, phonological awareness, letter knowledge, and print
awareness and their importance to reading attainment are described below.
Oral Vocabulary
Researchers distinguish between two types of vocabulary, receptive and
expressive. The National Reading Panel (NRP, 2000) considers the differences between
the two types of vocabulary as follows, “ Receptive vocabulary is the vocabulary that we
can understand when it is presented to us in text, or as we listen to others speak, while
productive (expressive) vocabulary is the vocabulary we use in writing or when speaking
to others” (NRP, 2000, p.2). Previous research shows that there is a connection between
the ways in which parents communicate with their children and their children’s oral
vocabulary skills (Evans & Shaw, 2008; Paris, Morrison, & Miller, 2006). There also is a
skills such as print awareness, letter recognition, and writing in preschool children
(Dickinson & McCabe 2001; Storch & Whitehurst, 2002). This relationship between oral
vocabulary and emergent literacy skills continues and predicts children’s later reading
abilities. For example, the National Institute of Child Health and Human Development
Early Child Care Research Network (NICHD, 2005) investigated the contribution of
preschool oral vocabulary (receptive and expressive) to reading performance in early
elementary school. The results of the study indicated that oral vocabulary skills in
preschool were related to word decoding in first grade and reading comprehension in
third grade, with the strengths of associations being moderate.
Phonological Awareness
Phonological awareness is the understanding that speech (i.e., sentences, words,
syllables) can be divided into smaller components and manipulated. Thus sentences can
be divided into words, words into syllables, and syllables into phonemes (Torgesen,
Wagner, & Rashotte, 1994). Adams (1990) operationally categorized phonological
awareness into five different tasks, knowledge of rhymes, sound categorization, blending,
segmentation, and manipulation. Rhyming tasks require the individual to recognize or
create rhyming words. In sound categorization tasks, the individual must decide which
words start or end with the same or different sounds. An individual is asked to combine a
string of sounds into a recognizable word in blending tasks and break apart words into
constituent sounds in segmenting tasks. Manipulation tasks require one to delete a
particular sound or substitute one sound for another.
Research has indicated there is a strong relationship between phonological
McCutchen (2006) found as the children’s phonological awareness skill increased, so did
their word recognition and reading comprehension abilities. Other researchers found
preschool and kindergarten student’s phonological abilities were a good indicator of their
performance on tasks of word recognition in first through third grade (Blaiklock, 2004;
Muter, Hulme, Snowling, & Stevenson, 2004).
Letter Knowledge
Letter knowledge includes mastering alphabet letter names and comprehending
that they form a class of labels of letters. Furthermore, letter knowledge involves
connecting each letter shape with its name as well as with one or more sounds for which
it stands in written words (Levin, Shatil-Carmon, & Asif-Rave, 2006). To assess letter
knowledge, children are usually instructed to name the letters presented to them in print.
Children who can identify few or no letter names have greater difficulty on tasks of early
literacy (such as print knowledge, emergent writing, and phonological skills) than
children who are able to identify letter names (Johnston, Anderson, & Holligan, 1996;
Molfese, Beswick, Molnar, & Jacobi-Vessels, 2006). Early letter naming skills (i.e.,
preschool and kindergarten) are found to be consistent predictors of reading ability in
Grades 1 to 6 (Badian, 1995; Muter & Diethelm, 2001).
Print Awareness
Printed language is constructed by a set of conventions that can be understood
without being able to read (Whitehurst & Lonigan, 1998). These include such
conventions as the difference between print and pictures, spaces between words, letter
orientations, and the linear arrangement of writing (Levy, Gong, Hessels, Evans, & Jared,
knowledge and early reading skills where an increase in print knowledge constitutes an
increase in early reading skills (e.g., Korat, 2005). In Korat’s (2005) study,
kindergarteners were assessed on print measures (reading environmental print such as a
stop sign and milk container and identifying print material such as a newspaper) and early
reading measures (phonemic awareness, letter naming, emergent writing, and word
recognition). Results indicated that the children’s print awareness was significantly
related to emergent writing and word recognition skills. Levy et al. (2006) reported a
relationship between print awareness and emergent reading in preschool and kindergarten
children. Specifically, the preschool children’s understanding of print positively related to
their letter reading ability. The kindergarten student’s print awareness positively related
to letter naming and word reading.
The Relationship between Parents’ Educational Levels and Children’s Literacy
Skills
According to the 2000 Census, more than 40 million adults, or approximately 21
percent of the adult population in the United States do not have a high school diploma, or
a high school equivalence diploma (Lasater & Elliot, 2005). Since researchers have found
a strong relationship between parents’ educational levels and their children’s literacy
levels, this is important to consider. For example, Hecht, Burgess, Torgesen, Wagner, and
Rashotte (2000) annually assessed a group of children from kindergarten through fifth
grade on measures of decoding, word identification, reading comprehension, print
knowledge, phonological awareness, and naming (letters and digits). Results indicated
that a composite score of higher grade attainment combined with occupation provided an
abilities. In another study (Adult Literacy and Basic Skills Unit [ALBSU], 2003),
participants between the ages of 5 and 18 were assessed on word recognition. A parent
indicated his or her highest attained educational level and any reading difficulties. The
children of parents who reported having difficulties with reading and had the lowest
educational level obtained the lowest reading assessment scores. Parents’ educational
level and parents’ use of print were found to be related in Lynch’s (2008) study. The
ways in which the parents used print (which was indicative of parents’ educational level),
had an impact on their 4-year-old children’s understanding of and uses of print.
Korat (2009)’s study focused on the relationship between mothers’ educational
level and emergent literacy skills. Mothers were considered to have a low-educational
level if they possessed a high school diploma or less and were considered to have a high-
educational level if they possessed a Bachelor’s degree or higher. The children (ages 5 to
6) were assessed on measures of print concept, phonological awareness, receptive
vocabulary, emergent word writing, word recognition, and emergent reading. Korat
indicated a positive association between mothers’ educational level and children’s oral
and written language skills. Children of mothers in the high-education group scored
significantly higher than children of mothers in the low-education group in print concept,
word recognition, receptive vocabulary, emergent word writing, and emergent book
reading, but not phonological awareness. Finally, in another study, Magnuson et al.
(2009) found a positive relationship between mother’s educational level (highest grade or
level of education completed) and preschool children’s emergent oral language skills
(vocabulary comprehension and expressive language). As maternal educational level
Altogether, studies that examined the relationship between parents’ educational
level and their children’s oral and written language levels found positive associations
(ALBSU, 2003; Hecht et al., 2000; Korat, 2009; Magnuson et al. 2009). Parents who
have higher educational levels have children with higher oral and written language levels.
Parents’ low educational levels tend to correspond with their children’s lower oral and
written language levels. These findings are critical, as these relationships may ultimately
be connected to intergenerational patterns of academic achievement (Tracey & Young,
2002).
Despite the aforementioned relationship between parents’ educational level and
children’s oral and written language levels, research is lacking relative to the specific
nature of the relationship. When studies investigate the relationship between parents’
educational level and their children’s emergent literacy skills, parents’ educational level
does not provide a complete picture of their academic ability. For example, Greenberg
(1995) found that 24% of her adult participants who read at a third to fifth grade level
graduated high school. Another 63% completed up to 11th grade. Therefore, it is
important to go beyond parental self report of highest grade completed, and investigate
the relationship between adults’ oral and written language skills and their children’s oral
and written language skills by not only assessing the children’s skills but by also
assessing the parents’ skills. This is important in light of the data that show a prevalence
of low adult literacy levels in the United States. Specifically, the 2003 National
Assessment of Adult Literacy (NAAL) survey reported approximately 63 million
American adults (29% of the adult population) read and understood at a basic level of
literacy tasks (e.g., searching a short pamphlet to find out information). Another 30
million American adults (14% of the adult population) read and understood at a below
basic level of literacy, possessing no more than the most simple and concrete literacy
skills. These adults exhibited limited literacy capabilities and had difficulty with tasks
such as filling out an application, reading news stories, reading labels, or reading
instructional materials (National Center for Educational Statistics, n.d).
Oral and Written Language Skills of Low Literate Adults
Researchers are concerned about the intergenerational transmission of low
literacy skills from parents to their children (e.g., Bus, van Ijzendoorn, & Pellegrini,
1995; Hecht et al., 2000; Korat, 2009). It is suggested that children of low educated
parents are at greater risk for reading failure compared to children of parents with higher
levels of education (Korat, 2009). To further understand the oral and written language
skills of parents with low literacy, the following section provides a review of research
about struggling adult readers and their oral vocabulary, decoding, word recognition, and
fluency skills.
Oral Vocabulary
Historically, it was thought that adults who struggled with reading would not
necessarily have deficits in oral language due to their accumulated years of oral language
experiences (Sticht, 1982). However, some research has emerged indicating adults who
struggle with written language also struggle with oral language. For struggling adult
readers, oral vocabulary skills appear to be poor. In terms of receptive vocabulary,
Greenberg, Ehri, and Perin (1997) found that their sample of adult learners (reading
they scored in the 1st percentile of the norming adult population. Similarly, Davidson and
Strucker (2002) found that their struggling adult reader participants who read between the
fourth and sixth grade levels possessed receptive vocabulary skills below the 10th
percentile of the norming adult population. Finally, Greenberg and colleague’s (2011)
adult participants with reading levels between the third and fifth grade performed two
standard deviations below the mean on a receptive vocabulary measure.
Studies about struggling adult readers’ oral vocabulary skill have also focused on
their expressive vocabulary. In an early study, Gold and Johnson (1982) found the
expressive vocabulary skills of low literate adults to be at a sixth grade level. Cantwell
and Rubin (1992) also assessed a group of adults with written language difficulties along
with a control group. Results indicated the adults with written language difficulties
performed worse than the adults without written language difficulties on a measure of
expressive vocabulary. In another study, Dietrich and Brady (2001) found differences
among the expressive vocabulary skills of skilled adult readers, less skilled adult readers,
and an adolescent reading-matched group (7th and 8th grade reading level). The less
skilled adult readers performed significantly poorer than the adult skilled readers and
equivalent to the reading-matched adolescent group. Also, Sabatini, Sawaki, Shore, and
Scarborough (2010) reported that their adults demonstrated expressive vocabulary skills
similar to their reading ages (6 to 12 years) as opposed to their chronological ages which
ranged between 16 to 76 years. Overall, results of previous research indicate that
struggling adult readers’ oral vocabulary matches more to their reading age than to their
thought (e.g., Sticht, 1982) that adults who struggled with written language would not
struggle with oral language due to their years of exposure to and use with oral language.
Word Recognition
It is clear from studies of struggling adult readers that this group possesses poor
word recognition skills. For example, Greenberg et al.’s (1997) struggling adult readers
recognized words at the third to fifth grade levels and adults enrolled in Adult Basic
Education classes in Davidson and Struckers’ (2002) study recognized words at a fourth
grade level, while MacArthur and colleague’s (2010) adult learners recognized words at a
fifth grade level. Compared to adults with higher word recognition, adults with low word
recognition perform poorer and slower on related reading measures (e.g., passage
comprehension, sentence processing, decoding) (Davidson & Strucker, 2002).
Decoding
Struggling adult readers often have challenges in many areas of reading including
decoding which many consider an indication of a core phonological issue (Sabatini,
2002; Strucker, Yamamoto, & Kirsch, 2007). Sabatini (2002) examined the decoding
skills of two groups of adults: a group of adults with high word recognition ability, and a
group of adults with low word recognition ability. He found the pattern of responses
between the high ability and low ability groups differed. Specifically, the high group on
average missed only one item on each of the decoding tasks while the low group
performed poorly as they struggled with decoding 1, 2, and 3 syllable real words and
nonwords. Greenberg, Ehri, and Perin (2002) found that adult struggling readers
compared to reading matched children at the third to fifth grade levels were less apt to
When reading real words, Binder and Borecki (2007) found adults reading below the
sixth grade level used phonological skills less efficiently during word recognition and
during activation of word meanings compared to adult skilled readers. Finally, Sabatini
and colleagues (2010) assessed the decoding skills of adults reading at or below the
seventh grade level and found their skills to be low (1.8 grade equivalent).
Fluency
Research suggests that adults with low literacy have difficulty with reading
fluency. For example, Mellard, Fall, and Mark (2008) assessed the reading abilities of
low literate adult learners. Compared to the general adult population, most of the adult
learners scored below the 15th percentile on a measure of reading fluency. Sabatini and
colleagues (2010) evaluated adult learners who recognized words at a seventh grade level
and below and found adults’ reading fluency on average was assessed at a second grade
level.
Aims of the Study
The emergent literacy of preschool children has been studied extensively (e.g.,
NELP, 2008; NRP, 2000). The oral and written language skills of low literate adults have
also been studied, though not as extensively (e.g., Dietrich & Brady, 2001; Greenberg et
al., 2010). Even though low literate adults are experienced language users with many
years of exposure to written and oral language, many struggle with both oral and written
language tasks (MacArthur, Greenberg, Mellard, & Sabatini, 2010). Researchers such as
Hecht et al. (2000) and Korat (2009) have found parents’ educational level to have an
impact on children’s oral and written language skills. Specifically, the studies have
and parents with lower education having children with lower skills. Therefore, it is
important for us to understand the extent of the relationship of adults’ skill levels on their
children’s skills especially during the preschool period when young children are
developing concepts about oral and written language that may affect their subsequent
achievement.
Research Questions and Hypotheses
Research Question: 1. What are the relationships among parents’ educational
level, their oral (receptive and expressive vocabulary) and written (decoding, word
recognition, fluency) language skills and their children’s related oral (receptive and
expressive vocabulary, phonological awareness) and written (letter knowledge, print
awareness) language skills?
Hypothesis: It was hypothesized that parents’ educational level and their oral and
written language skills would be positively correlated to their children’s oral and written
language skills.
Rationale: Studies that investigated the relationship between parents’ educational
level and their children’s oral and written language attainment describe a positive
relationship (e.g., Korat, 2009). Even though these studies discussed parents’ educational
level instead of specific skills, it was hypothesized that a similar relationship would also
be found between parents’ specific literacy skills and their children’s specific literacy
skills.
Research Question: 2. After accounting for the child’s age and parents’
educational level, do parental receptive and expressive vocabulary skills account for
Hypothesis: It was hypothesized that parents’ receptive and expressive
vocabulary skills would account for variance in their children’s receptive and expressive
vocabulary skills.
Rationale: The way in which parents communicate with their children is said to
have direct influences on their oral language development (Paris et al., 2006). Research
also has found that the overall amount and complexity of parental speech to children
predicts their vocabulary (Evans & Shaw, 2008). Therefore it was hypothesized that
parents’ receptive and expressive vocabulary skills would account for variance in their
children’s receptive and expressive vocabulary skills.
Research Question: 3. After accounting for the child’s age and parents’
educational level, does parental decoding skill account for variance in the child’s
phonological awareness?
Hypothesis: It was hypothesized that parents’ decoding skill would account for
variance in their children’s phonological skills.
Rationale: Parents’ literacy skills have an impact on the way in which they
interact with their children when teaching them specific literacy skills (Bus et al., 1995).
Parental teaching of specific literacy skills is predictive of children’s literacy skill levels
(e.g., Tracey & Young, 2002). Since researchers often consider decoding an indication of
phonological abilities, it was hypothesized that parents’ decoding skills will predict their
children’s phonological awareness.
Research Questions: 4. After accounting for the child’s age and parents’
educational level, does a combination of parental written language skills (word
After accounting for the child’s age and parents’ educational level, does a combination of
parental written language skills account for variance in the child’s print awareness? Due
to the lack of literature in this area, these questions are exploratory in nature and there are
no hypotheses associated with them.
Method
Participants
The participants in this study consisted of 96 primary caregiver-child dyads. The
children were enrolled in two different urban prekindergarten programs in a large
metropolitan city in the southeastern United States. According to the school descriptions
available to the public, the majority of the households served by these programs are low
income households. The prekindergarten classrooms are state funded and they
participated in an Early Reading First Project (ERF). ERF supports the academic
development of early childhood centers and focuses on early language, literacy, and
prereading development. The participants involved in this study were associated with
programs that focused on developing key literacy skills and high-quality literacy
environments while fostering family involvement.
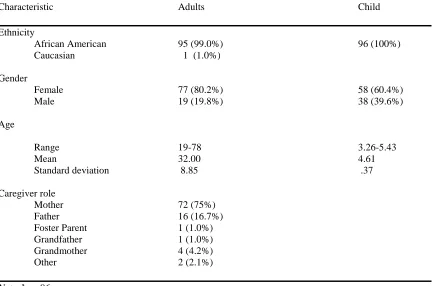
As Table 1 indicates, 99% of the adult participants were African American, 80%
were female, and their average age was 32 years old. Mothers were the majority of the
primary caregivers who participated in the study (i.e., 75%), with others self-identifying
as grandparents, fathers, or other guardians. All participants were native English
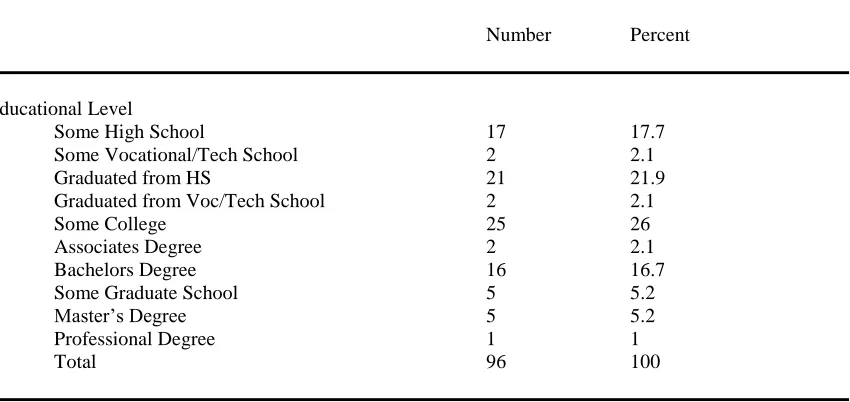
speakers. As Table 2 indicates, the educational levels of the adults varied as 44% had
some high school and or graduated high school while 56% had some college or above.
either high school or technical school, 28% completed some college or earned an
Associate’s degree, 17% earned a Bachelor’s degree, 10% completed some Master’s
level courses or earned a Master’s degree, and 1% earned a Professional degree. The
caregivers’ (herein referred to as parent) children (n = 96) were native English speakers,
African American, 60% female, and were an average age of four and a half years (see
[image:31.612.126.536.319.649.2]Table 1).
Table 1
Descriptive Statistics for Demographic Characteristics for Adults and Children Participantsª
Characteristic Adults Children
Ethnicity
African American 95(99.0%) 96 (100%)
Caucasian 1 (1.0%)
Gender
Female 77(80.2%) 58 (60.4%)
Male 19(19.8%) 38 (39.6%)
Age
Range 19-78 3.26-5.43
Mean 32.00 4.61
Standard deviation 8.85 .37
Caregiver role
Mother 72(75%)
Father 16(16.7%)
Foster Parent 1(1.0%) Grandfather 1 (1.0%) Grandmother 4 (4.2%)
Other 2 (2.1%)
Table 2
Description of Adult Participants by Educational Level
Number Percent
Educational Level
Some High School 17 17.7
Some Vocational/Tech School 2 2.1
Graduated from HS 21 21.9
Graduated from Voc/Tech School 2 2.1
Some College 25 26
Associates Degree 2 2.1
Bachelors Degree 16 16.7
Some Graduate School 5 5.2
Master’s Degree 5 5.2
Professional Degree 1 1
Total 96 100
Measures
Each measure was selected based on its psychometric properties, age range of
intended examinees, and relevance to the study’s aims. It is important to mention that this
study included struggling adult readers and while each test has excellent psychometric
properties for its norm group, none of the norm groups included samples of struggling
adult readers.
The following oral and written language assessments were administered to the
adult participants:
Oral receptive vocabulary. Peabody Picture Vocabulary Test-PPVT (PPVT;
Dunn & Dunn, 1998).The PPVT assessed the extent of the participants’ knowledge of
Designed for use as a measure for receptive vocabulary, this test required participants to
look at a template with four pictures, listen to the word orally presented by the examiner,
and chose the picture that best represents the word. Testing was discontinued when
participants reached a ceiling of eight consecutive errors.
Oral expressive vocabulary. Expressive Vocabulary Test-EVT (EVT; Williams,
2007). The EVT tested expressive vocabulary and word retrieval. This assessment was
normed on people ages 2 to 90+, with a reliability of .97. In this assessment, participants
were shown a picture and asked to provide a single word to label a picture (e.g., a picture
of a cow and the examinee is asked 'what do you see?') or to provide a single word
synonym for the target word (e.g., a picture of someone cleaning and the examinee is
asked to 'tell me another word for busy'). Testing was discontinued when participants
reached a ceiling of five consecutive incorrect answers.
Word recognition. Woodcock-Johnson III Tests of Achievement- WJ III
(Letter-Word Identification; Woodcock, McGrew, & Mather, 2001). The Letter-Word
Identification measured the participant’s word identification skills. This subtest was
normed on people ages 5 to 80+, with a reliability of .94. This subtest required
participants to identify words of increasing difficulty. A ceiling was reached when the
participant responded incorrectly to six consecutive items or when the last test item had
been administered.
Decoding. Woodcock-Johnson III Tests of Achievement- WJ III (Word Attack;
Woodcock et al., 2001). The Word Attack subtest measured the adults’ decoding skills.
This subtest was normed on people ages 4 to 80+, with a reliability of .87. This subtest
phonetically consistent or regular patterns in English orthography. A ceiling was reached
when the participant responded incorrectly to six consecutive items or the last item had
been administered.
Reading fluency. Woodcock-Johnson III Tests of Achievement- WJ III (Reading
Fluency; Woodcock et al., 2001). The Fluency subtest was normed on people ages 6 to
80+, with a reliability of .90. This subtest assessed the participants’ reading speed and
rate within a 3-minute time limit. The task required the participants to quickly read and
comprehend simple sentences. During test administration, the difficulty level of the
sentences gradually increased.
The following oral and written language measures were administered to the child
participants:
Oral receptive vocabulary. Peabody Picture Vocabulary Test-PPVT (PPVT;
Dunn & Dunn, 1998). The PPVT assessed the extent of the participants’ knowledge of
word meanings. This test was normed on people ages 2 to 90+, with reliability of .97.
Designed for use as a measure for receptive vocabulary, this test required participants to
look at a template with four pictures, listen to the word orally presented by the examiner,
and chose the picture that best represents the word. Testing was discontinued when
participants reached a ceiling of eight consecutive errors.
Oral expressive vocabulary. Expressive Vocabulary Test-EVT (EVT; Williams,
2007). The EVT tested expressive vocabulary and word retrieval. This assessment was
normed on people ages 2 to 90+, with a reliability of .97. In this assessment, participants
were shown a picture and asked to provide a single word to label a picture (e.g., a picture
synonym for the target word (e.g., a picture of someone cleaning and the examinee is
asked to 'tell me another word for busy'). Testing was discontinued when participants
reached a ceiling of five consecutive incorrect answers.
Phonological awareness.Beginning Sounds subtest of Phonological Awareness
Literacy Screening (PALS PreK)( PALS PreK; Invernizzi, Sullivan, Meier, & Swank,
2004). PALS is a criterion referenced instrument that measured preschooler’s developing
knowledge of important literacy fundamentals. This assessment was intended for
preschoolers, with a reliability of .93. The phonological awareness subtests measured the
children’s beginning sound skills. The Beginning Sounds subtest was a 10 item test that
required children to orally produce the beginning sounds of words that were first spoken
aloud by the examiner.
Alphabet knowledge. Letter Knowledge subtest of the Phonological Awareness
Literacy Screening (PALS PreK)(PALS PreK; Invernizzi et al., 2004). Alphabet
knowledge was assessed by the Letter Knowledge subtest. This assessment was designed
for preschoolers and no information regarding reliability is available for this subtest. The
test administrator asked children to name the 26 upper-case letters of the alphabet
presented in random order.
Print awareness. Print and Word Awareness subtest Phonological Awareness
Literacy Screening (PALS PreK)(PALS PreK; Invernizzi et al., 2004). The Print
Awareness task included measures of print identification, concepts of print, and concepts
of word. This subtest was designed for preschoolers with a reliability of .75. This subtest
contained 10 items and mimicked a naturally occurring book reading event. The
point to different text components to demonstrate awareness of directionality, and the
difference between pictures, letters, and words.
The following demographic information was obtained on the participants:
Demographics. Parents provided the following demographic information about
themselves: age, gender, ethnicity, educational level, language spoken in the home, and
caregiver role. Parents also reported demographic information about their child (e.g.,
gender, age, and ethnicity).
Procedure
Parents were assessed by the investigator in a quiet location at their child’s
school. The following tasks were administered to the adult participants in the following
order: Demographics Survey (administered orally), WJ Letter-Word Identification
subtest, WJ Word Attack subtest, WJ Fluency subtest, PPVT, EVT. All participants
started with item number 15 on the WJ Letter-Word Identification subtest. This item is
the first word reading item which does not have letter identification items following it,
and is at the k.7 grade level (therefore it was anticipated that all parents would be able to
easily read the first few words). The age level equivalencies obtained on this subtest
forecasted the starting points for the PPVT and EVT tests. As directed by the WJ test
manual, all participants started with the first item on the WJ Word Attack and Fluency
subtests. Testing was completed in one session lasting 25 to 40 minutes, during the
months of November to March.
As part of another study, trained data collectors tested children individually in the
fall (November to December) of the prekindergarten year at their schools. The
Since it is unclear whether standard scores are appropriate for struggling adult
readers and because one of the child assessments (PALS) does not have standard scores
available, raw scores were used for all the analyses. It is important to note that within this
study, reference to phonological awareness only includes beginning sounds since that is
the skill that the PALS subtest assessed. In all regression analyses the children’s ages and
parents’ educational levels were entered before the parental oral and written language
skills. The rationale for entering the children’s ages first is based on the recognized
importance of accounting for age differences in children when assessing emergent
literacy skills (e.g., Bingham, 2007; Evans, Shaw, & Bell, 2000; Hood, Conlon, &
Andrews, 2008). For parents’ educational level the rationale for entering it prior to other
variables results from investigations which indicate that parents’ educational level
impacts children’s emergent literacy skills (e.g., ALBSU, 2003; Hecht et al., 2000; Korat,
2009).
Results
Descriptive Analyses
Descriptive analyses were conducted to provide information about the adult and
child participants’ performances on the oral and written language measures.
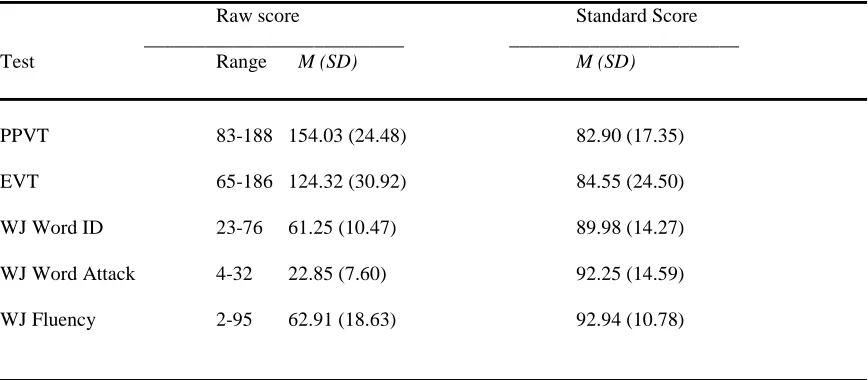
Adult. Table 3 presents descriptive statistics pertaining to the adults’ performance
in word identification, decoding, fluency, receptive vocabulary, and expressive
vocabulary. As the data in Table 3 show, there was a fair amount of variability in
performance on each of the main variables as indicated by the standard deviations and
range statistics. However, based on the average reported educational level of the parents
demonstrate that the adults performed lower than expected. Specifically, their mean
grade equivalency level on word identification was 9.85, on word attack was 8.21, and on
fluency was 10.00. Their mean age equivalency level on receptive vocabulary was 15.30
and on expressive vocabulary was 15.24.
To further explore the variability of the adults’ performance on the assessments,
analyses were conducted to determine the percentage of adults who were one standard
deviation above and below the mean and two or more standard deviations above and
below the mean on all the assessments. Within the analyses, educational level was
considered to determine if there were differences between low-educated adults (some
high school and or graduated high school) and high-educated adults (some college and
above). Results indicated that the high-educated group included a greater percentage of
participants than the low-educated group who performed one standard deviation above
the mean on the assessments (79.7% vs. 66.7%, respectively). Similar results were
obtained when looking at the performance of the adults at two or more standard
deviations above the mean. The high-educated group included a greater percentage of
participants than the low-educated group (55.6% vs. 23.8%, respectively). Likewise, the
low-educated group included a greater percentage of participants than the high-educated
group who performed one standard deviations below the mean (78.6% vs. 64.9%,
respectively) and two or more standard deviations below the mean (35.7% vs. 18.6%,
Table 3
Raw Score and Standard Score Performance of Pre-K Parentsª on Oral and Written Language Measures
Raw score Standard Score
__________________________ _______________________ Test Range M (SD) M (SD)
PPVT 83-188 154.03 (24.48) 82.90 (17.35)
EVT 65-186 124.32 (30.92) 84.55 (24.50)
WJ Word ID 23-76 61.25 (10.47) 89.98 (14.27)
WJ Word Attack 4-32 22.85 (7.60) 92.25 (14.59)
WJ Fluency 2-95 62.91 (18.63) 92.94 (10.78)
Note. PPVT-III= Peabody Picture Vocabulary Test; EVT = Expressive Vocabulary Test; WJ = Woodcock Johnson;ª n = 96.
Child. Table 4 presents descriptive statistics pertaining to the children’s
performance in receptive vocabulary, expressive vocabulary, phonological awareness,
alphabet knowledge, and print awareness. As the data in Table 4 show, there was a fair
amount of variability in performance on each of the main variables as indicated by the
standard deviations and range statistics. Age equivalency means demonstrated that the
children performed lower than expected (the average age of the children was four and a
half years) on receptive vocabulary (M = 3.12) and expressive vocabulary (M = 3.87).
According to the PALS-PreK manual (Invernizzi et al., 2004), by the end of PreK
children’s subtest scores should range between 12 and 21 on alphabet knowledge,
between 5 and 8 on beginning sounds, and between 7 and 9 on print awareness. There are
no developmental ranges provided for how children should perform in the Fall, which is
when the children in this study were tested. The children’s mean performance on alphabet
already at the expected development range performance for what they should know by
the end of Pre-K. The children’s performances on phonological awareness (M = 4.70) and
print awareness (M = 3.93) demonstrated they were below the developmental range
expected for the end of PreK. However, since these scores are an indication of the
children’s performance at the beginning of PreK, it is unclear whether or not their Fall
phonological awareness and print awareness scores were within an appropriate
[image:40.612.106.548.337.525.2]developmental range.
Table 4
Raw Score and Standard Score Performance of Pre-K Childrenª on Oral and Written Language Measures
Raw score Standard Score
______________________ _________________________
Test Range M (SD) M (SD)
PPVT 8-86 44.37 (16.65) 88.38 (13.71)
EVT 25-65 40.46 (8.00) 93.42(10.41)
Sounds 0-10 4.70 (3.43) n/a
Alphabet 0-26 15.60 (9.30) n/a
Print 0-9 3.93 (2.16) n/a
Awareness
Note. PPVT = Peabody Picture Vocabulary Test; EVT = Expressive Vocabulary Test; Sounds = Phonological awareness; Alphabet = Alphabet Knowledge; ª n = 96
Site Differences
Several analysis of variances (ANOVA) were conducted to determine if there
was variation based on school site among the adult and child participants’ demographics
Adult demographic site differences. A one way ANOVA was conducted to
determine if the adult participants’ demographic characteristics differed by site.
Significant differences were found between the gender of the adult participants, F (1, 94)
= 7.23, p < .05 and parent educational level, F (1, 94) = 21.07, p < .05. Site 2 included a
higher proportion of males than Site 1. Also, the parents’ from Site 1 demonstrated
significantly higher educational levels than those at Site 2. No other significant
differences were found between the adults’ demographic characteristics (see Table 5).
Adult literacy skills by site. A one way ANOVA was conducted to determine if
the adult participants differed by site on their oral (PPVT, EVT) and written (word
identification, word attack, fluency) skills. Significant differences were found between
the adults’ word identification, F (1, 94) = 13.59, p < .05 and reading fluency skills, F (1,
94) = 16.88, p < .05. Results indicated that Site 1 had significantly higher scores than Site
2 on measures of word identification and reading fluency. No other significant
Table 5
Comparison of Adult Demographics by Site
Site 1 Site 2
(n = 46) (n = 50)
Characteristic *Gender
Female 42 35
Male 4 15
Ethnicity
African American 45 50
Caucasian 1 0
Age
Range 21-78 19-52
Mean 32.46 31.58
Standard deviation 9.43 8.34
*Parents’ educational level
Range 3-13 3-10
Mean 7.65 5.54
Standard deviation 2.53 1.96
Caregiver role
Mother 40 32
Father 4 12
Grandmother 1 3
Foster Parent 1 0
Grandfather 0 1
Other 0 2
Table 6
Comparison of Adult Skills by Site
______________________________________________________________________________________
Site 1 Site 2
______________ __________________
Test n Range M(SD) n Range M(SD)
______________________________________________________________________________________
PPVT 46 87-187 157.61(23.32) 50 83-188 151.26(25.35)
EVT 46 65-182 123.41(31.37) 50 68-185 125.16(30.80)
*WJ Word ID 46 45-76 65.11(8.16) 50 23-76 57.70(11.15)
WJ Word Attack 46 6-32 23.67(7.87) 50 4-32 22.10(7.11)
*WJ Fluency 46 44-95 70.45(15.15) 50 2-85 55.98(18.96)
______________________________________________________________________________________ Note. PPVT = Peabody Picture Vocabulary Test; EVT = Expressive Vocabulary Test; WJ = Woodcock Johnson; * Indicates a significant difference was found between the site participants.
Child demographics by site. There were no significant differences found
between the children’s demographic characteristics (see Table 7).
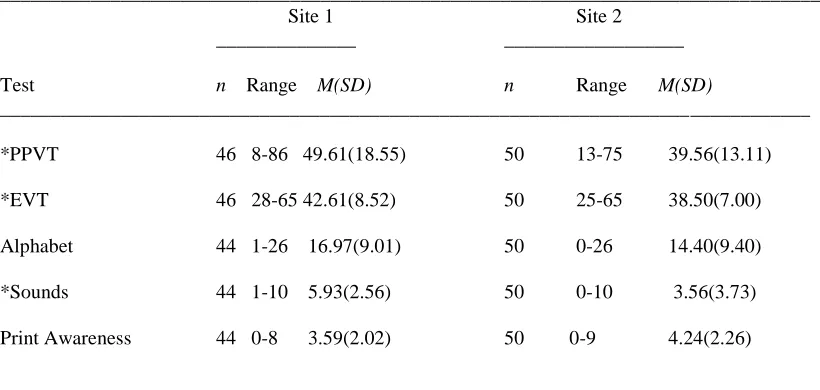
Child literacy skills by site. A one way ANOVA was conducted to see if the
child participants differed by site on their oral (PPVT, EVT, phonological awareness,)
and written (alphabet knowledge, print awareness) language skills. Significant
differences were found between the children’s receptive vocabulary (PPVT), F (1, 94) =
9.51, p < .05, expressive vocabulary (EVT), F (1, 94) = 6.71, p < .05, and phonological
awareness skills, F (1, 94) = 12.57, p < .05, with the children at Site 1 possessing
significantly higher scores than the children at Site 2. No other significant differences
Table 7
Comparison of Child Demographics by Site
Site 1 Site 2
(n = 46) (n = 50) Characteristic
Gender
Girl 25 33
Boy 21 17
Ethnicity
African American 46 50
Age
Range 3.36-5.43 3.26-5.28
Mean 4.58 4.64
Standard deviation .39 .36
Table 8
Comparison of Child Skills by Site
_____________________________________________________________________________________
Site 1 Site 2
______________ __________________
Test n Range M(SD) n Range M(SD)
_________________________________________________________________________________
*PPVT 46 8-86 49.61(18.55) 50 13-75 39.56(13.11)
*EVT 46 28-65 42.61(8.52) 50 25-65 38.50(7.00)
Alphabet 44 1-26 16.97(9.01) 50 0-26 14.40(9.40)
*Sounds 44 1-10 5.93(2.56) 50 0-10 3.56(3.73)
Print Awareness 44 0-8 3.59(2.02) 50 0-9 4.24(2.26)
______________________________________________________________________________
[image:44.612.108.518.457.652.2]Relationship among Parents’ Educational Levels, their Oral and Written Language
Skills and their Children’s Related Oral and Written Language Skills
Research Question 1.What are the relationships among parents’ educational
levels, their oral (receptive vocabulary, expressive vocabulary) and written (decoding,
word recognition, fluency) language skills and their children’s related oral (receptive and
expressive vocabulary, phonological awareness) and written (letter knowledge, print
awareness) language skills?
Correlational data for the relationships among parents’ educational levels, their
oral and written language skills and their children’s oral and written language skills are
presented in Table 9. Even though positive correlations are indicated among many of the
parent and child variables, the strength of associations are small to moderate (r = .21 to
.45). Parents’ educational level positively correlated to all the tested parental literacy
skills, and to all of the children’s literacy skills with the exception of phonological
awareness and print awareness. Parents’ word identification skills correlated with all of
the children’s literacy skills with the exception of print awareness. Parents’ decoding
skills correlated with all of the children’s literacy skills with the exception of
phonological awareness. Parents’ fluency skills correlated with all of the children’s
literacy skills with the exception of print awareness. Parents’ receptive vocabulary skills
correlated with all of the children’s literacy skills with the exception of phonological
awareness. Parents’ expressive vocabulary skills correlated with all of the children’s
Prediction of Children’s Receptive Vocabulary, Expressive Vocabulary, and
Phonological Awareness
Research Questions 2. After accounting for the child’s age and parents’
educational level, do parental receptive and expressive vocabulary skills account for
variance in the child’s receptive and expressive vocabulary skills? 3. After accounting for
the child’s age and parents’ educational level, does parental decoding skill account for
variance in the child’s phonological awareness?
To examine the unique contribution of the parents’ oral vocabulary skills on their
children’s receptive vocabulary skills, a hierarchical regression analysis was conducted.
Child age was entered in the first step, followed by parents’ educational level in the
second step, and receptive vocabulary (PPVT) and expressive vocabulary (EVT) in the
third step. Parents’ educational level accounted for the largest amount of variance (15%)
followed by the child’s age (11%) and parental oral vocabulary skills (5%) (see Table
10).
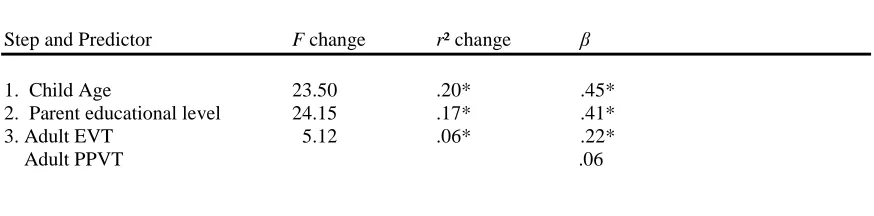
To examine the unique contribution of parents’ oral vocabulary skills on their
children’s expressive vocabulary skills, a hierarchical regression analysis was conducted.
Child age was entered in the first step, followed by parents’ educational level in the
second step, and expressive vocabulary (EVT) and receptive vocabulary (PPVT) in the
third step. Child age accounted for the largest amount of variance (20%) followed by
parents’ educational level (17%) and parental oral vocabulary skills (6%) (see Table 11).
To examine the unique contribution of parents’ decoding skill on their children’s
phonological awareness, a hierarchical regression analysis was conducted. Child age was
decoding (WJ Word Attack) in the third step. None of the variables were found to
[image:48.612.107.543.214.339.2]account for variance in the regression equation (see Table 12).
Table 10
Hierarchical Regression Assessing Prediction of Child Receptive Vocabulary
Receptive Vocabulary (PPVT)
_____________________________________________
Step and Predictor Fchange r² change β
1. Child Age 11.05 .11* .32*
2. Parent educational level 19.15 .15* .39*
3. Adult PPVT 3.37 .05* .26*
Adult EVT -.02
Note. * p < .05
Table 11
Hierarchical Regression Assessing Prediction of Child Expressive Vocabulary (EVT)
Expressive Vocabulary (EVT)
_____________________________________________
Step and Predictor F change r² change β
1. Child Age 23.50 .20* .45*
2. Parent educational level 24.15 .17* .41*
3. Adult EVT 5.12 .06* .22*
Adult PPVT .06
[image:48.612.106.543.480.588.2]Table 12
Hierarchical Regression Assessing Prediction of Child Phonological Awareness
Phonological awareness
_____________________________________________
Step and Predictor F change r² change β
1. Child Age 2.75 .03 .17
2. Parent educational level 3.87 .04 .20
3. WJ Word Attack 1.07 .01 .11
Note. * p < .05
Prediction of Children’s Alphabet Knowledge and Print Awareness
Research Questions 4. After accounting for the child’s age and parents’
educational level, does a combination of parental written language skills (word
identification, decoding, fluency) account for variance in the child’s alphabet knowledge
skills? 5. After accounting for the child’s age and parents’ educational level, does a
combination of parental written language skills (word identification, decoding, fluency)
account for variance in the child’s print awareness?
To examine the unique contribution of parents’ written language skills on their
children’s alphabet knowledge, a hierarchical regression analysis was conducted. The
child’s age was entered in the first step, followed by parents’ educational level in the
second step, and parental written language skills (word identification, decoding, fluency)
in the third step. Parental written language skills accounted for the most variance (14%)
followed by parents’ educational level (12%) (see Table 13).
To examine the unique contribution of parents’ written language skills on their
age was entered in the first step, followed by parents’ educational level in the second
step, and parental written language skills (word identification, decoding, fluency) in the
third step. None of the variables were found to account for variance in the regression
equation (see Table 14).
Table 13
Hierarchical Regression Assessing Prediction of Child Alphabet Knowledge
Alphabet Knowledge
_____________________________________________
Step and Predictor F change r² change β
1. Child Age 1.75 .02 .14
2. Parent educational level 12.28 .12* .34*
3. WJ Word ID 3.47 .14* .07
WJ Word Attack .16
WJ Fluency .02
[image:50.612.104.546.498.660.2]
Note. * p < .05
Table 14
Hierarchical Regression Assessing Prediction of Child Print Awareness
Print Awareness
_____________________________________________
Step and Predictor F change r² change β
1. Child Age 1.98 .02 .14
2. Parent educational level 2.41 .02 .16
3. WJ Word ID 1.65 .03 -.14
WJ Word Attack .24
WJ Fluency .06