2017 International Conference on Mathematics, Modelling and Simulation Technologies and Applications (MMSTA 2017) ISBN: 978-1-60595-530-8
Research on the Influence of Image Quality Based on
Spatial Frequency Change
Cheng-hua FAN
1,2,*, Qun-jing WANG
1and Yi-ying WANG
21School of Electrical Engineering and Automation, Anhui University, Hefei 230601, China
2School of Electrical and Information Engineering, Hefei Normal University, Hefei 230601, China
*Corresponding author
Keywords: Spatial frequency, Contrast sensitivity, Image evaluation.
Abstract. According to the different sensitivity of human eyes to spatial frequency,building the calculation methods of spatial frequency and the character of contrast sensitivity, which comes up with a method that can test the influence of spatial frequency change on image quality and it can be proved by experiment. The method is easy to operate and it can reflect more accurately about the visual perception of human eyes to image quality. The experiment results turns out that the contrast sensitivity is falling to high and low end human eyes.
Introduction
With the development of digital image technology, people have more requests about image quality, but there are many factors which will influence image quality, such as spatial structure, spatial frequency and so on. The present image quality evaluation method [1]which mainly includes subjective evaluation method [2-4]and objective evaluation method[5-6], but both of them have disadvantages. Human eyes is image final receiver,whose feeling is most subjective. At present ,image quality evaluation methods are for the pursuit of consistent with human eyes’ subjective feeling. Due to the contrast sensitivity function is a function of spatial frequency, it has the nature of the band-pass filter[7]. This paper,in order to exam the influence of spatial frequency change on image quality, the introduction of contrast sensitivity awareness, and set up a kind of image quality evaluation method.
The Calculation of Spatial Frequency
For a image, the size is MN, the brightness is L(i,j),and 0iM ,0 jN . Image
spatial frequency
can be expressed as
rf 2 rf 2,Cfis the image of the line frequencyandRfis the field frequency of the image. Field frequency calculation can be expressed as
1
0 1
1
2 )] 1 , ( ) , ( [ 1 M
i N
j
f L i j L i j
MN R
(1) and further considering the actual number of lines is
1
0 1
1
2 )] 1 , ( ) , ( [ ) 1 (
1 M
i N
j
f L i j L i j
N M R
(2) Through normalized, the result is
1 1 M 1N 1[L(i, j) L(i, j 1)]2Line frequency calculation can be expressed as
1 0 1 1 2 )] , 1 ( ) , ( [ 1 N j M if L i j L i j
MN C
(4) and further considering the actual number of lines is
1 0 1 1 2 )] , 1 ( ) , ( [ ) 1 ( 1 M i N jf L i j L i j
N M C
(5)
Through normalized, the result is
1 0 1 1 2 )] , 1 ( ) , ( [ 1 255 1 M i N jf L i j L i j
MN C
(6) and this definition is related to the amplitude.
In contrast sensitivity, spatial frequency represents the unit perspective which can observe black and white stripes, and image spatial frequency
is whole image which contains the number of black and white stripes, and it needs further normalization. We can get the normalization of spatial frequencyby calculating image perspective. The following is the process of normalization[8].Screen height is d, and the horizontal distance of human eyes to screen is D, usually D=4d.Such as figure 1. We can get
8 1 4 2 2 2
tan
d d D d (7) according to picture 1,then we cancalculate the angle of view
14.3
8 1 arctan 2 (8) and then we can get
degree per cycles 3 . 14 (9)
D
d
Figure 1. Angle of view .
Methods of Investigation Contrast Sensitivity
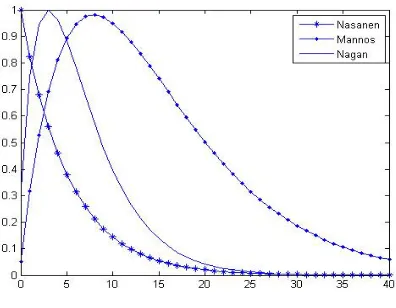
Figure 2. CSF characteristic curve.
CSF function is expressed asCSF
=Output contrast / input contrast.And represents the spatial frequency in cycles per degree. Threshold of contrast is described as C(T), and satisfies the equation:
) ( 1 )
(
T CSF
C (10)
Mathematical Model
The influence of spatial frequency on image quality was mainly researched in this paper. The contrast sensitivity is a function of spatial frequency through the research of it and which represents the contrast of the human eye can distinguish n the different space frequency. Therefore, this article will introduce the contrast sensitivity to study the Influence of spatial frequency change on image quality[11].
First, the spatial frequency of the reference image must be measured to obtain the normalized value. So it can get the value of CSF
according to the equation:
(0.310.69
) 0.29e
CSF (11) As can be seen from (1), we can get C(T), target threshold CT will get with further calculation by the equation:
min )
( L
C
CT T (12)
where Lminis image masking threshold which can be obtained through experiments. In
addition, the smallest brightness changes that the human eye can observe must be calculated according to the following equation:
0
L C LT T
(13)
The average brightness of an image is represented as L0.
Secondly, only if the error image brightness is larger than the minimum luminance variation, the error can be recognized by the human eye, and the rest can be ignored.
Then, the distortion of the image can be obtained.
,
, if
,0 others
e T e T
d
L i j L L i j L
L i j
Finally, the perceptual mean square error and the normalized peak signal to noise ratio(SPSNR) are obtained by the distortion degree.
20 , 0
, d i M j N
L i j
SMSE
M N
(15) And
2 255 10lg
SPSNR
SMSE
(16) Where Ma and N represent the size of the image.
[image:4.612.190.424.241.387.2]The diagram of how to research image quality was shown in in figure 3.
Figure 3. diagram of image quality assessment.
Experimental Results
In this paper, a large number of images are selected to study the e influence of spatial frequency on image quality.
The mean square error(MSE) and peak valueSignal-to-Noise Ratio(PSNR) of the error image
were calculated by using the traditional objective quality evaluation method in a set of different standard images which were added to the same noise according to the following equations:
2 0 , 0, i M j N
L i j MSE
M N
(17)
2 255 10log
PSNR
MSE
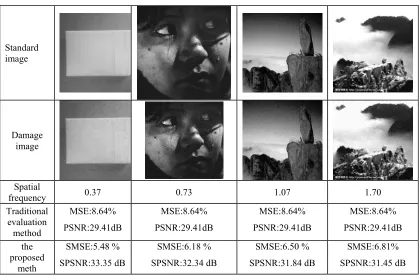
(18) By comparing with the calculation method in this paper,we can get the results of the experiments which were shown in Table 1. It was obvious that,Spatial frequency is different, and the effect of noise on image is different through the analysis of table 1.and which can not reflect the changes in the calculation of the traditional method.
It can be seen that with the increase of the spatial frequency, the influence of the noise on the image is smaller, which is consistent with the subjective perception of the human eye.
calculating contr -ast threshold
reference image
calculating image spatial frequency
error image
calculating the minimum brightness change image
distortion
Table 1. Comparison of different methods.
Standard image
Damage image
Spatial
frequency 0.37 0.73 1.07 1.70 Traditional
evaluation method
MSE:8.64% PSNR:29.41dB
MSE:8.64% PSNR:29.41dB
MSE:8.64% PSNR:29.41dB
MSE:8.64% PSNR:29.41dB
the proposed
meth
SMSE:5.48 % SPSNR:33.35 dB
SMSE:6.18 % SPSNR:32.34 dB
SMSE:6.50 % SPSNR:31.84 dB
SMSE:6.81% SPSNR:31.45 dB
It can be seen from the above Table that the same noise was added to the four images with different spatial frequency. The evaluation results obtained by the traditional objective method are the same, which is not consistent with the subjective feelings of the human eyes. we can make a correct evaluation of the image according to the change of the spatial frequency by the proposed method in this paper.
Summary
In this paper, the influence of spatial frequency on image quality is investigated based on the contrast sensitivity function.The experimental results show that, for the same noise, the spatial frequency of the image, the less the perception of noise, which is consistent with the subjective feelings of the human eye.
Acknowledgements
This research was financially supported by the Excellent Talent Support Program in Colleges and Universities of Anhui Provincial under Grant No gxyq2017049, and the Natural Science Major Foundation of Anhui Provincial Higher Education Institutions under Grant No KJ2013A218 and the Foundation for University Key Teachers from Hefei Normal University under Grant No 2015JG05.
References
[1] M. Yu, K. Zheng, G. Jiang, F. Shao, Z. Peng, Binocular perception based reduced-reference stereo video quality assessment method, Journal of Visual Communication & Image Representation, 38(2016)246-255.
[3] X. Gao, W. Lu, D. Tao, X. Li, Image Quality Assessment-A Multiscale Geometric Analysis-Based Framework and Examples, Springer Berlin Heidelberg. (2012)377-399.
[4] M. Liu, X. Yang, Y. Shang, Image Quality Assessment Based on Multi-scale Geometric Analysis, Image Analysis and Processing. 5716(2009)807-815.
[5] J. Qian, D. Wu, L. Li, D. Cheng, X. Wang, Image quality assessment based on multi-scale representation of structure, Digital Signal Processing. 33(2014)125-133.
[6] M. Narwaria, M. Perreira Da Silva, P. Le Callet, HDR-VQM: An objective quality measure for high dynamic range video. Signal Process. Image Commun. 35(2015)46–60.
[7] S. Bharadwaj, M. Vatsa, R. Singh. Biometric quality: a review of fingerprint, iris, and face, Eurasip Journal on Image & Video Processing. 2014(2014): 1-28.
[8] Ms. Shraddha N. Utane, Prof. V.K. Shandilya. Full-Reference Metric for Image Quality Assessment, International Journal of Advanced Research in Computer Science & Electronics Engineering. 1(2012)149-153.
[9] Y. Li, L.M. Po, X. Xu, L. Feng et al, No-reference image quality assessment with shearlet transform and deep neural networks, Neurocomputing. 154(2015)94-109.
[10] G. Kutyniok, W.Q. Lim, Image Separation using Wavelets and Shearlets, Mathematics. 6920(2011)416-430.