2016 International Conference on Computer, Mechatronics and Electronic Engineering (CMEE 2016) ISBN: 978-1-60595-406-6
Text Document Clustering Based on Density K-means
Di WU
1, Yan ZENG
2and Yin-chuan QU
21College of Computer, National University of Defense, Chang Sha, China 2Beijing Gaodi Information Technology Co., Ltd., Beijing, China
Keywords: K-means, Density, Text document, Clustering.
Abstract. K-means is one of the most fundamental techniques in clustering. It has been applied in many fields, such as image processing and Natural Language Processing. It has good performance in many cases, especially in dealing with large data sets. However, how to choose the initial cluster centers is a hard problem, different choice may cause the clustering results by K-means unstable even get the local optimum. To solve this problem, many methods have be proposed, while these methods only apply in some certain fields and perform disappointed when we use for text documents clustering. In this paper, we designed a novel density K-means algorithm and apply it in the text document clustering. The experimental results show that it performs better than most of the existing methods in Chinese corpus. Furthermore, compared with other algorithms, our algorithm can effectively decrease the iterations.
Introduction
distribution of the data to decide the initial cluster centers. However, this algorithm cannot solve the large iterations of K-means and leaded to high computational complexity. While the mentioned algorithms can solve the initial centers for K-means to some extent, in some certain fields. In addition, most of methods under the assumption that the data obeys mixed Gaussian distributions. However, most data sets are more complicated, especially the information of Text documents, and that will lead to the disappointed performance with these methods.
In this paper, we have two contributions to text document clustering. To solve the problem that caused by choosing initial clustering centers randomly and the large number of iteration, we proposed a new algorithm for center initialization for K-means. Then for text document clustering we put forward a novel clustering method based on density peaks. Experiment demonstrates that the new algorithm has strong ability in text document clustering.
The remainder of paper proceeds as follows. In section 2, we describe the detail of K-means algorithm. Section 3 introduces our method Cluster center initialization of K-means with density peak (CCIDP). In Section 4, we propose a system that used for Text Document clustering. In next section, experimental results demonstrate that our method performs better than other three methods. In the final Section, we give a summary and discuss our future work.
The K-Means Algorithm
In this section, we describe the original K-means algorithm. Let 𝐷 = {𝑑𝑖, 𝑖 = 1, ⋯ , 𝑛} be a data set with k clusters, 𝐶 = {𝑐𝑖, 𝑖 = 1, ⋯ , 𝑘} be a set of k centers and 𝑆𝑗 = {𝑑|𝑑 𝑖𝑠 𝑎 𝑚𝑒𝑚𝑏𝑒𝑟 𝑜𝑓 𝑡ℎ𝑒 𝑐𝑙𝑢𝑠𝑡𝑒𝑟} be the set of samples that belong to the k-th cluster.
The main idea is to classify the given set of data D into k disjoint clusters, and k is a parameter which needs us to impute before clustering. First, we select k centers for each cluster randomly. Then assign each point to the nearest center. After that calculate the average coordinates of all points in each cluster and regard it as the new cluster centroid. The algorithm updates the centers and assigns the point repeatedly until the centers do not change anymore.
K-means algorithm can be described as follows [16]:
Algorithm 1. The K-means algorithm
1. Input: 𝐷 = {𝑑𝑖, 𝑖 = 1, ⋯ , 𝑛}, 𝑘.
2. Output: a set of k clusters.
3. Initiate algorithm by randomly select initial cluster center 𝑐𝑘.
4. Assign each 𝑑𝑖to the cluster 𝑆𝑘, which has minimum distance d(𝑑𝑖, 𝑐𝑘)
5. Calculate new 𝑐𝑘 centers as
𝑐𝑘= ∑𝑑𝑖∈𝑆𝑘|𝑆 𝑑𝑖
𝑘| . (1)
6. Repeat steps 2 and 3 till there is no movement in cluster centers.
The distance between two data points x(𝑥1, 𝑥2, 𝑥3, ⋯ , 𝑥𝑛) and y(𝑦1, 𝑦2, 𝑦3, ⋯ , 𝑦𝑛) is computed
as follows:
d(x, y) = √(𝑥1− 𝑦1)2+ (𝑥2− 𝑦2)2+ ⋯ + (𝑥𝑛− 𝑦𝑛)2 . (2)
The results of K-means are not unique because of the different random initial cluster centers. To get better results, we need to run K -means plenty of times with different random initial centers. In next section, we propose our cluster center initialization algorithm based on finding the centers with density peaks.
Cluster Center Initialization of K-Means with Density Peak
large distance with each other. For each point 𝑑𝑖 in data set D, two parameters determine whether the point has potential to become the next cluster center: 𝑐𝑗+1: 𝜌𝑖, local density and its distance d from points with higher density. The two parameters both based on the distance between points.
Definition 1: 𝜌𝑖 is the density of the point 𝑑𝑖. In this paper, instead of defining the density of 𝑑𝑖 as the number of points that within a radius r around 𝑑𝑖, we use a Gaussian kernel to determine the value of 𝜌𝑖. 𝑑𝑖,𝑗 , which denote the distance between 𝑑𝑖 and 𝑑𝑗, and r is a cut off distance.
𝜌𝑖 = ∑𝑛−1𝑗=1𝑒𝑑𝑖,𝑗𝑟 . (3)
Definition 2: 𝛿𝑖 is the minimal distance from point i to the point with higher local density.
𝛿𝑖 = min𝑗:𝜌𝑗>𝜌𝑖𝑑𝑖,𝑗. (4)
If point i has the highest density, we take 𝛿𝑖 = max𝑗(𝑑𝑖,𝑗). It means that only the point is the local or global density maximum. Its 𝛿𝑖 is much higher than the distance from the nearest point with
higher density.
Definition 3: 𝑟𝑖 is the potential of the point 𝑑𝑖 to become the next cluster center. We combine the 𝜌𝑖 with 𝛿𝑖. In our assumption, the cluster center point 𝑑𝑖 should have higher 𝜌𝑖 and 𝛿𝑖.
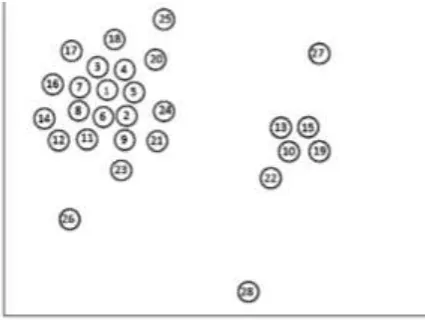
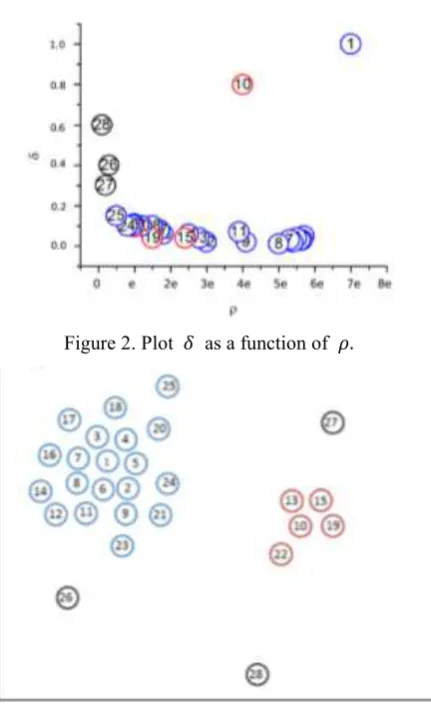
[image:3.595.199.412.479.639.2]𝑟𝑖 = 𝜌𝑖 × 𝛿𝑖 . (5) We can combine the following Figure to express the main idea of the algorithm more vividly. Figure 1 shows 28 points distributed in two dimensions. Firstly, we compute 𝜌𝑖 for each point using formula (3). Then we compute the distance from other points with higher density and Take the minimum value as 𝛿𝑖. We can plot 𝛿𝑖 as the function of 𝜌𝑖 of each point like figure 2. After that, we compute 𝑟𝑖 for each point to denote the potential of becoming the cluster center. In figure 2, point 1 and point 10 are “outliers” with high 𝛿 and 𝜌 which means high 𝑟 value. So point 1 and point 10 are cluster centers. Finally, we can assign the remaining points to the cluster of the nearest neighbor with high density. Figure 3 shows the result of clustering.
Figure 2. Plot 𝛿 as a function of 𝜌.
Figure 3. The clustering result and different colors represent different clusters.
The algorithm CCIDP is described as follows:
Algorithm 2. CCIDP
1. Input: 𝐷 = {𝑑𝑖, 𝑖 = 1, ⋯ , 𝑛}, 𝑘.
2. Output: a set of k clusters.
3. Compute 𝜌𝑖and 𝛿𝑖 of each 𝑑𝑖in set D using equation (3) and equation (4), respectively.
4. Set 𝑚 = 0,𝐶 = { }, 𝑟𝑖= 𝜌𝑖× 𝛿𝑖 .
5. Add 𝑑𝑖 to C, if 𝑟𝑖= max( 𝑟𝑗) , 𝑗 = 1,2, ⋯ , 𝑛.
6. Remove 𝑑𝑖 from D, m=m+1. 7. Repeat step 5 and 6 until m==k
8. Assign each 𝑑𝑖 to corresponding cluster 𝑆𝑘, when 𝑑𝑖 is most closely to 𝑐𝑘 with a minimum distance d(𝑑𝑖, 𝑐𝑘).
9. Compute new 𝑐𝑘 as:
𝑐𝑘=
∑𝑑𝑖∈𝑆𝑘𝑑𝑖 |𝑆𝑘|
10. Repeat step 9 and 10 until there is no movement in cluster centers.
Using this CCIPD, we can find good initial center set and get better results with less iterations. Comparing to other algorithms requires the iterative optimization of the objective function. In our algorithm, clustering is done in one step.
Text Document Clustering Based on CCIPD
The Vector Representation of Texts
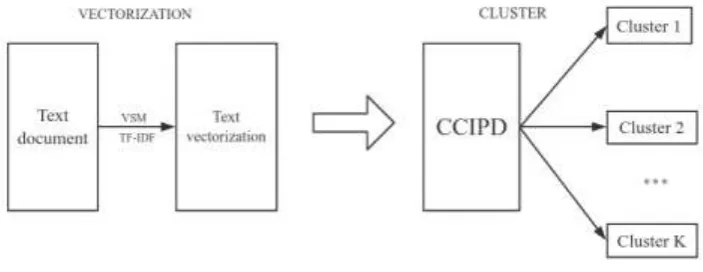
classical technique of text representation is based on the VSM (vector space model), each dimension is composed of a feature item and its weight. The weight of a feature item is calculated by the TF-IDF (term frequency-inverse document frequency) method:
w(𝑡𝑖, 𝑑) = 𝑡𝑓(𝑡𝑖,𝑑)×𝑙𝑜𝑔(
𝑁 𝑛𝑖+0.01)
√∑ 𝑡𝑓(𝑡𝑖,𝑑)×𝑙𝑜𝑔(
𝑁 𝑛𝑖+0.01) 𝑡𝑖∈𝑑
. (6)
[image:5.595.120.472.264.400.2]where w(𝑡𝑖, 𝑑) denotes the weight of the feature item 𝑡𝑖 in document d; 𝑡𝑓(𝑡𝑖, 𝑑) denotes the term frequency of 𝑡𝑖 in document d; N is the total number of documents in the training corpus; 𝑛𝑖 represents the number of documents where the term 𝑡𝑖 appears. The denominator is a normalization factor. Then the document d is represented as: d = (𝑡1: 𝑤1, 𝑡2: 𝑤2, ⋯ , 𝑡𝑚: 𝑤𝑚), that is, 𝑡1is the i-th feature item in the document d, 𝑤𝑖 means its weight and m represents the number of feature items in the vector.
Figure 4. The process of Text Document clustering.
Calculate the Distance between Two Text Documents
The cosine similarity is often used to calculate the similarity between two text documents, while in K-means, we need to calculate the distance between them. It requires a structure that is capable of converting text similarity into distance. The conversion method should satisfy the following two conditions:
1) The greater the similarity of the two text documents, the smaller distance between them; on the contrary, the similarity is smaller, and the distance should be greater.
2) When the similarity between the two text documents is the greatest (the angle of cosine is 1), the distance between them should be 0; on the contrary, when the similarity between them is minimal (the angle of cosine is 0), the distance between them should be positive infinity.
In order to satisfy the above conditions, we use the angle of cosine to calculate the degree of similarity between two text documents [17,18]. Then we transform the raw similarity to its log value to represent the distance between two texts. The logarithm value should be in the range (0, 1). Thus, for given two text vectors 𝑑𝑖, 𝑑𝑗:
𝑑𝑖𝑠(𝑑𝑖,𝑑𝑗) = log (𝑠𝑖𝑚(𝑑𝑖, 𝑑𝑗)) = log 𝑑𝑖×𝑑𝑗
|𝑑𝑖|×|𝑑𝑗| . (7)
Text Document Clustering Based on CCIPD
As the K-means randomly select initial centers will lead to local optimum and cannot get stable results, we use CCIPD after calculating the distance between the two text documents. The process of algorithm see Fig.4.
Experiments and Discussion
from http://www.sogou.com/labs/dl/c.html/, and we selected 5 topics in this data set, including car, information, sports, education, militaries. To compare the performance of different algorithms, we use F-value to evaluate their clustering results. Besides, precision, the rate of recall and the time of algorithm are other factors we considered during experiments.
Table 1. Summary of Index to evaluate different algorithm’s performance.
abbreviation meaning
TP The rate of extracting features
TT The total time of the algorithm
P The precision of the clustering results
R Recall rate
[image:6.595.80.514.292.366.2]F F-value
Table 2. Performance Comparison of Four algorithms on the data set when TP = 0.5%
algorithm TT[ms] P[%] R[%] F[%]
K-means 112590 71.45 59.87 65.15 Lei’s approach [14] 103923 70.05 60.10 64.69 Jianpei Zhang’s approach [15] 90932 71.67 63.57 67.38
CCIPD 89920 72.01 63.64 68.12
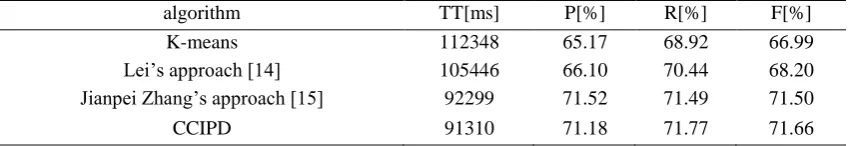
Table 3. Performance Comparison of Four algorithms on the data set when TP = 1%
algorithm TT[ms] P[%] R[%] F[%]
K-means 112348 65.17 68.92 66.99 Lei’s approach [14] 105446 66.10 70.44 68.20 Jianpei Zhang’s approach [15] 92299 71.52 71.49 71.50
CCIPD 91310 71.18 71.77 71.66
Table 2 summarizes the performance of four document clustering algorithms, when the TP is 0.5%. In this case, we can find that the running time of CCIPD and Jianpei’s approach is very similar. Besides, both of them are lower than the other two ways. In view of precision of cluster results, CCIPD is still work well than other results, improving 0.56% compared with K-means. Considering the recall rate, CCIPD improve a lot compared with the original K-means, and also ahead of other two algorithms. In the F-value, CCIPD is higher and standing at 68.12%, while the K-means, Jianpei Zhang’s approach and Lei’s approach is 65.15%, 64.69%, and 67.38% respectively. From the Table III, similarly, the CCIPD has better performance. However, when the TP = 1%, the running time of CCIPD is little higher than Jianpei Zhang’s approach [15]. AS only higher about 11 ms, we think that it is acceptable to improve other performance at the expense of little running time. We can see the result in figure5 and figure 6 more directly.
[image:6.595.86.513.406.479.2]Figure 5. Performance Comparison of Four algorithms on the data set when TP = 0.5%.
Figure 6. Performance Comparison of Four algorithms on the data set When TP = 1%.
Conclusion and Future Work
In this paper, we proposed a method that optimally select cluster centers based on finding density peak. Our idea is on the assumption that the cluster center is in high density and each of them keeps relative distance. Compared with other algorithms for solving center initialization problem for K-means, our method CCIPD has less strict conditions and get better performance when processing the text information. In order to demonstrate the applicability of our algorithm in solving the text document clustering, we conduct CCIPD and other three existing algorithms on Chinese document data sets. The experimental results indicate that CCIPD has less running time and higher precision than other algorithms. Furthermore, the F-value of CCIPD is higher than other algorithms. In the future, we will study on the pre-process of document cluster, especially in the similarity of two text documents.
Acknowledgement
The work is supported by National Basic Research and Development Program (No.2013CB329601, 2013CB329604) and National Natural Science Foundation of China (No.61502517, No.61472433, No.61372191, No.61572492).
References
[1] H. Jiawei and M. Kamber, “Data mining: concepts and techniques,” SanFrancisco, CA, itd: Morgan Kaufmann, vol. 5, 2001.
[2] W. S. Sarle, “Algorithms for clustering data,” Technometrics, vol. 32,no. 2, pp. 227-229, 1990.
[3] M. Steinbach, G. Karypis, V. Kumar et al., “A comparison of document clustering techniques,” in KDD workshop on text mining, vol. 400, no. 1. Boston, 2000, pp. 525-526.
0 20 40 60 80 100 120
TT[ms*1000] P[%] R[%] F[%]
[image:7.595.162.438.232.374.2][4] M. B. Cohen, S. Elder, C. Musco, C. Musco, and M. Persu, “Dimensionality reduction for k-means clustering and low rank approximation,” in Proceedings of the Forty-Seventh Annual ACM on Symposium on Theory of Computing. ACM, 2015, pp. 163-172.
[5] A. C. Joshi, V. R. Padghan, J. R. Vyawahare, and S. P. Saner, “Enforcing document clustering for forensic analysis using weighted matrix method(wmm),” 2015.
[6] A. Fujita, D. Y. Takahashi, and A. G. Patriota, “A non-parametric method to estimate the number of clusters,” Computational Statistics & Data Analysis, vol. 73, pp. 27-39, 2014.
[7] C. Wang, Y. Song, A. El-Kishky, D. Roth, M. Zhang, and J. Han, “Incorporating world knowledge to document clustering via heterogeneous information networks,” in Proceedings of the 21th ACM SIGKDD International Conference on Knowledge Discovery and Data Mining. ACM, 2015, pp. 1215-1224.
[8] M. Bernotas, K. Karklius, R. Laurutis, and A. Slotkien˙e, “The peculiarities of the text document representation, using ontology and tagging-based clustering technique,” Information Technology And Control,vol. 36, no. 2, 2015.
[9] J. MacQueen et al., “Some methods for classification and analysis of multivariate observations,” in Proceedings of the fifth Berkeley symposium on mathematical statistics and probability, vol. 1, no. 14. Oakland, CA, USA., 1967, pp. 281-297.
[10] G. W. Milligan and M. C. Cooper, “An examination of procedures for determining the number of clusters in a data set,” Psychometrika, Vol. 50, no. 2, pp. 159-179, 1985.
[11] A. Rodriguez and A. Laio, “Clustering by fast search and find of density peaks,” Science, vol. 344, no. 6191, pp. 1492-1496, 2014.
[12] E. W. Forgy, “Cluster analysis of multivariate data: efficiency versus interpretability of classifications,” Biometrics, vol. 21, pp. 768-769, 1965.
[13] S. S. Khan and A. Ahmad, “Cluster center initialization algorithm for k-means clustering,” Pattern recognition letters, vol. 25, no. 11, pp.1293-1302, 2004.
[14] Xiao-Feng and K. Xie, “ k-means,” Journal of Software, vol. 19, no. 7, 2008.
[15] D. Zhuo, J. Yu, F. Gao, and L. Yu, “Text document clustering based on maximium distance of selecting initial centers,” Computer science application’s Research, vol. 31, no. 3, pp. 713-715, 2014.
[16] K. A. Nazeer and M. Sebastian, “Improving the accuracy and efficiency of the k-means clustering algorithm,” in Proceedings of the World Congress on Engineering, vol. 1, 2009, pp. 1-3.
[17] J. Zhao and X. Hu, “Similarity computation based on text categorization”, Microcomputer Applications, vol. 24, no. 12, pp. 46-47, 2008.