0095-1137/06/$08.00⫹0 doi:10.1128/JCM.02415-05
Copyright © 2006, American Society for Microbiology. All Rights Reserved.
Evaluation of a Multiple-Cycle, Recombinant Virus, Growth Competition
Assay That Uses Flow Cytometry To Measure Replication Efficiency
of Human Immunodeficiency Virus Type 1 in Cell Culture
Carrie Dykes,
1Jiong Wang,
1Xia Jin,
1Vicente Planelles,
2Dong Sung An,
3Amanda Tallo,
1Yangxin Huang,
4† Hulin Wu,
4and Lisa M. Demeter
1*
Department of Medicine, University of Rochester School of Medicine and Dentistry, Rochester, New York1; Department of Pathology, University of Utah School of Medicine, Salt Lake City, Utah2; Department of Hematology and Oncology,
UCLA AIDS Institute, Los Angeles, California3; and Department of Biostatistics, University of Rochester School of Medicine and Dentistry, Rochester, New York4
Received 21 November 2005/Returned for modification 20 January 2006/Accepted 27 March 2006
Human immunodeficiency virus type 1 (HIV-1) replication efficiency or fitness, as measured in cell culture, has been postulated to correlate with clinical outcome of HIV infection, although this is still controversial. One limitation is the lack of high-throughput assays that can measure replication efficiency over multiple rounds of replication. We have developed a multiple-cycle growth competition assay to measure HIV-1 replication efficiency that uses flow cytometry to determine the relative proportions of test and reference viruses, each of
which expresses a different reporter gene in place ofnef. The reporter genes are expressed on the surface of
infected cells and are detected by commercially available fluorescence-labeled antibodies. This method is less labor-intensive than those that require isolation and amplification of nucleic acids. The two reporter gene products are detected with similar specificity and sensitivity, and the proportion of infected cells in culture correlates with the amount of viral p24 antigen produced in the culture supernatant. HIV replication efficien-cies of six different drug-resistant site-directed mutants were reproducibly quantified and were similar to those obtained with a growth competition assay in which the relative proportion of each variant was measured by
sequence analysis, indicating that recombination between thepoland reporter genes was negligible. This assay
also reproducibly quantified the relative fitness conferred by protease and reverse transcriptase sequences containing multiple drug resistance mutations, amplified from patient plasma. This flow cytometry-based growth competition assay offers advantages over current assays for HIV replication efficiency and should prove useful for the evaluation of patient samples in clinical trials.
Replication fitness can be defined as the efficiency with which a virus replicates in response to the selective pressures present in its environment. Human immunodeficiency virus type 1 (HIV-1) replication fitness is postulated to influence which variants predominate in an HIV-infected patient’s quasi-species and to affect treatment responses and disease progres-sion (28, 31, 39). A critical question is whether assays that measure HIV-1 replication efficiency in cell culture are rea-sonable surrogates of viral replication fitness in patients and thus can be used to predict prognosis of HIV-1 infection or response to therapy. If so, assays of HIV-1 replication effi-ciency might be used to determine how aggressively to initiate treatment and the optimal time to switch a failing regimen.
All assays that measure HIV-1 replication efficiency in cell culture compare the clinical (or test) virus to a reference HIV-1 isolate. These assays vary widely, although they differ primarily in at least one of four different characteristics. First, such assays may either measure the replication efficiency of virus cultured directly from the patient sample or a
recombi-nant virus constructed by combining a PCR-amplified segment of the patient virus genome with the sequence backbone from a laboratory strain of HIV-1. Second, these assays may mea-sure the replication efficiency during a single virus replication cycle or over multiple cycles. Third, these assays may measure virus growth directly, using a viral gene or gene product, or measure virus growth indirectly by assaying a reporter gene substituted for a nonessential viral gene. Fourth, assays of HIV-1 replication efficiency may evaluate the growth of test and reference viruses in the same or separate cultures (re-ferred to as growth competition and parallel infections, respec-tively) (28, 31).
Growth competition assays are considered to be the pre-ferred method for measuring HIV-1 replication fitness in cell culture because they are more sensitive to subtle differences in replication efficiency than parallel infections and are not sub-ject to artifact due to differences in culture conditions (10, 30). Growth competition assays require a method to distinguish the two virus variants, usually by measuring the relative propor-tions of each mutant (or a linked reporter gene) using bulk DNA sequencing, clonal analysis, heteroduplex tracking assay, or real-time PCR (16, 22, 26, 27, 32, 33, 36, 40). These methods make growth competition assays more labor-intensive than par-allel infections, thus limiting their use in larger clinical trials.
We have designed a multiple-cycle, recombinant-virus, growth competition assay that obviates the need to purify and analyze
* Corresponding author. Mailing address: University of Rochester School of Medicine and Dentistry, Infectious Diseases Unit, 601 Elm-wood Ave., Box 689, Rochester, NY 14642. Phone: (585) 275-4764. Fax: (585) 442-9328. E-mail: [email protected].
† Present address: Department of Epidemiology and Biostatistics, College of Public Health, University of South Florida, Tampa, FL 33612.
1930
on May 16, 2020 by guest
http://jcm.asm.org/
Downloaded from
on May 16, 2020 by guest
http://jcm.asm.org/
Downloaded from
on May 16, 2020 by guest
http://jcm.asm.org/
HIV-1 RNA or DNA. Two recombinant HIV-1 virus constructs
were designed to express either the mouseThy1.1or the mouse
Thy1.2genes in place of HIV-1nef. The proportions of test and reference HIV-1 isolates were measured by using flow cytometry to detect the Thy1.1 or Thy1.2 gene products expressed by each virus on the surface of infected cells. Here we show that this assay can be used to reliably quantify the relative replication efficiencies of HIV-1 drug-resistant mutants, including those derived from clinical samples.
MATERIALS AND METHODS
Reagents.pNLThy is a derivative of pNL4-3 (1), which has the mouseThy1.2
gene in place ofnef (29, 35). Fluorescein isothiocyanate (FITC)-conjugated mouse rat Thy1.1 (HIS51) and R-phycoerythrin (PE)-conjugated rat anti-mouse Thy1.2 (30-H12) monoclonal antibodies were obtained from BD Phar-mingen (San Jose, CA). The PM1 cell line, a clonal derivative of HUT 78 that is permissive for both macrophage-tropic and lymphocyte-tropic strains of HIV-1, was obtained from the AIDS Research and Reference Reagent Program, Divi-sion of AIDS, NIAID, NIH, from Marvin Reitz (24). The 293 cell line was obtained from American Type Culture Collection (ATCC, Rockville, MD). Fetal bovine serum (FBS) was obtained from Valley Biomedical (Winchester, VA) or the ATCC. Restriction enzymes were obtained from either New England Biolabs (Beverly, MA) or MBI Fermentas (Hanover, MD).
Cell culture.PM1 cells were grown in the presence of RPMI (Cellgro, Hern-don, VA), supplemented with 10% FBS,L-glutamine (2 mM), penicillin (100
U/ml), and streptomycin (100 U/ml). 293 cells were grown in Dulbecco modified Eagle medium with 10% FBS, penicillin (100 U/ml), and streptomycin (100 U/ml).
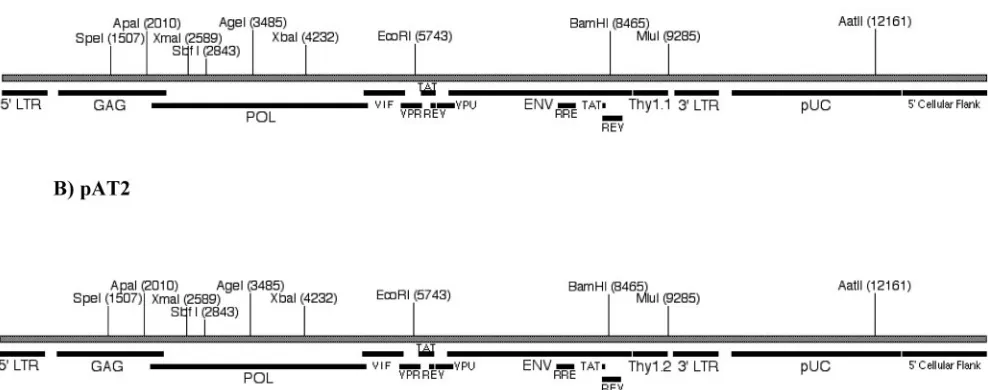
Construction of pAT2 and pAT1 HIV-1 vectors.Construction of the pAT1 and pAT2 vectors shown in Fig. 1 was accomplished in three separate steps. (i) The BamHI-NcoI fragment of the Thy1.2 gene of pNLThy was subcloned into pQE-31 and mutagenized at codon 108 (CAA3CGC) using PCR-mediated mutagenesis (QuikChange; Stratagene, La Jolla, CA). After we verified the absence of spurious mutations, this fragment was cloned back into the pNLThy vector to create the Thy1.1-expressing pNL4-3 vector pNLThy1.1. (ii) In order to facilitate the cloning of reverse transcriptase (RT) sequences amplified from patient plasma, we then introduced silent XmaI and XbaI sites near the begin-ning and end of the RT coding region by subclobegin-ning the SpeI-EcoRI fragment from the pNL4-3XX construct described previously (14). (iii) We next removed a second XbaI site which had been introduced between the 3⬘long terminal
repeat and pUC19 bacterial plasmid sequence whenThy1.2was originally intro-duced into the pNL4-3 vector (29). Removal of the additional XbaI site was accomplished by digesting the pNLThy vector with NcoI and XbaI, filling in the ends with T4 polymerase, and religating. The AatII-MluI fragment containing the deleted XbaI site was then subcloned into the pNLThy1.1 and pNLThy to generate pAT1 and pAT2, respectively (Fig. 1).
Introduction of drug resistance mutations into pAT1 and pAT2.The protease (PR) inhibitor resistance mutations, L90M and D30N, and the RT mutant, G190S, were made by mutagenizing pRHAXX, which contains the SpeI-EcoRI fragment of pNL4-3XX, described previously (14). PCR-mediated mutagenesis was performed (QuikChange) with the following pairs of primers: L90M sense-L90M antisense, D30N sense-D30N antisense, and G190S sense-G190S anti-sense. The sense primer sequences were as follows (the mutant codon is under-lined): L90M sense, 5⬘-GTC AAC ATA ATT GGA AGA AAT CTG ATG ACT CAG AT; D30N sense, 5⬘-T ACA GGA GCA GAT AAT ACA GTA TTA GAA G; and G190S sense, 5⬘-TTG TAT GTA TCA TCT GAC TTA GAA ATA GGG CAG C.
The antisense primers used for mutagenesis were the reverse and complement of each sense primer. The resultant clones were sequenced to confirm the presence of the mutation and the absence of spurious mutations. PR inhibitor resistance mutations were introduced into pAT1 and pAT2 by subcloning the ApaI-XmaI fragment from the mutant pRHAXX constructs, and the G190S mutation was introduced into pAT1 and pAT2 by subcloning the XmaI-XbaI fragment from the mutant pRHAXX. The V106A and P236L mutations were introduced separately into pAT1 and pAT2 by subcloning the SbfI-AgeI frag-ment from 3(V106A) (3) and the XmaI-XbaI fragfrag-ment from pNL4-3XXP236L (14). All mutant pAT1 and pAT2 clones were sequenced to verify the presence of the appropriate mutation, the integrity of the cloning sites, and the presence of the correct Thy allele.
[image:2.585.46.540.96.291.2]Amplification and cloning of HIV-1 PR and RT sequences from patient plasma.Plasma was obtained from HIV-infected patients seen at the University of Rochester Infectious Diseases Clinic, after obtaining informed consent, ac-cording to the guidelines of the University of Rochester Research Subjects Review Board. Viral RNA was purified from plasma, amplified by RT-PCR, and sequenced by using the Viroseq HIV-1 Genotyping System V2.0 (Celera, Rock-ville, MD). Amplification of viral RNA for cloning was performed with RNA purified from the Viroseq kit and the QIAGEN One-step RT-PCR kit (QIAGEN, Valencia, CA). The following primers were used, which contain ApaI and AgeI sites (underlined) to facilitate cloning: GagApaI-sense, 5⬘-GCAGGG CCCCTAGGAAAAAGGGCTGTTGGAAATGTGGAAAGGAAGG; and Age I-antisense, 5⬘-ACCGGTTCTTTTAGAATCTCCCTGTTTTCTGCC. The FIG. 1. Maps of pAT1 (A) and pAT2 (B). The open reading frame locations forgag,pol,env, the accessory proteins, Thy, and the long terminal repeats (LTRs) are shown as black bars. The region containing the bacterial plasmid pUC19 sequence is marked as pUC. The 5⬘cellular flanking sequence is also marked by a black bar. The locations of restriction enzyme sites used to construct each vector are each marked with a vertical line and labeled with the nucleotide position. See Materials and Methods for details on the construction of each vector.
on May 16, 2020 by guest
http://jcm.asm.org/
cycling conditions were as follows: reverse transcription (50°C for 50 min), PCR activation (95°C for 15 min), PCR cycling (40 cycles of 94°C for 30 s, 60°C for 30 s, and 72°C for 2 min), and a final extension (72°C for 10 min). The ApaI-AgeI product includes the 3⬘end of thegagcoding region (codons 29 to 55 of p7 and all of p1 and p6), as well as the complete coding region of protease and the first 314 amino acids of the RT. The PCR product was gel isolated and cloned into pCR4-TOPO (Invitrogen, Carlsbad, CA). Clones were sequenced to ensure the absence of frameshift mutations and to characterize the PR and RT sequence. In order to generate recombinant infectious vectors, the ApaI-AgeI region was subcloned from the pCR4-TOPO constructs into pAT1. pAT1 clones were se-quenced from the ApaI site to the AgeI site to be sure they were identical to the TOPO version of the clone. In addition, a panel of restriction digests were performed to ensure that no significant deletions or rearrangements occurred elsewhere in the genome due to a cloning artifact.
Generation of virus stocks. pAT1 and pAT2 containing wild-type NL4-3, mutant NL4-3, or patient viral sequences were purified fromEscherichia coliand used to transiently transfect 293 cells (Superfect; QIAGEN). Because 293 cells have no CD4 receptor, progeny virus cannot reinfect these cells. This minimizes the introduction of spurious mutations and the loss of mutations due to rever-sion. Supernatants were harvested 72 h later and clarified by centrifugation at 500⫻g. HIV-1 virus capsid protein (p24) quantitation was performed on virus stocks by using an HIV-1 p24 enzyme-linked immunosorbent assay (Perkin-Elmer, Norwalk, CT).
Growth competition assay.Seven million PM1 cells, pretreated with 10g of Polybrene (Sigma; St. Louis, MO)/ml in phosphate-buffered saline (PBS), were coinfected with a total of 300 ng of two virus stocks, one expressing Thy1.1 and the other expressing Thy1.2. The relative proportions were varied in different experiments and estimated based on the p24 antigen content of the virus stocks. Virus and cells were incubated at 37°C in a total volume of 3.5 ml for 1 h. To remove unbound virus, cells were washed with PBS and centrifuged at 500⫻g. Cells were then seeded at 200,000 cells/ml in medium and cultured at 37°C. On days 3, 4, 5, and 6, half the culture was removed and replaced with fresh medium. A subset of cells removed during this process was stained with trypan blue and counted to determine the number of viable cells in the total culture. Cells were then stained with the Thy1.1 and Thy1.2 antibodies, either alone or in combi-nation. The Thy1.1 and Thy1.2 antibodies were diluted 1:200 and 1:100, respec-tively, in wash buffer before use (Dulbecco PBS [Invitrogen], with 0.02% FBS [Valley], 0.02% sodium azide, 0.5 mM EDTA [Gibco]). Cells were fixed (4% paraformaldehyde [Sigma, St. Louis, MO] in Dulbecco PBS [Invitrogen]; pH 7.4 to 7.6) before analysis with a FACSCalibur (Becton Dickinson, San Jose, CA). A total of 100,000 events were collected from each stained sample. Cells were also collected and frozen as nonviable cell pellets for sequence analysis. Culture supernatant was collected and used for p24 quantitation.
Sequence analysis.Genomic DNA was extracted from 2 million cells by using the QIAGEN DNA Blood Minikit (QIAGEN). DNA was eluted with 200l of nuclease-free water. A 50-l PCR was performed with 10l of genomic DNA and the following reagents: 1 U of PlatinumTaqHiFi (Invitrogen, Carlsbad, CA), 0.2 mM deoxynucleoside triphosphates (PE Applied Biosystems, Foster City, CA), 2 mM MgSO4, and 0.2M primer RT18 and primer RT21 (the sequences are shown below). The following cycling conditions were used: 94°C for 2 min, 40 cycles of 94°C for 15 s, 55°C for 30 s, and 68°C for 2 min. PCR products were sequenced by using BigDye v3.1 (PE Applied Biosystems) and the primers RT18 and RT127 for protease codon 90, RT60 and 215D for RT codons 103 and 106, the primers RT162 and 215D for RT codon 190, and the primers RT162 and RT21 for RT codon 236.
The PCR and sequencing primers were as follows: RT18, 5⬘-GGAAACCAA AAATGATAGGGGGAATTGGAGG; RT21, 5⬘-CTGTATTTCTGCTATTAA GTCTTTTGATGGG; RT60, 5⬘-CTGAAAATCCATACAATACTCC; RT127, 5⬘-CTAGGTATGGTAAATGCAGT; RT162, 5⬘-AAAGGATCACCAGCAAT ATTCC; and 215D, 5⬘-TCTGTATGTCATTGACAGTCCAGC.
The relative prevalence of mutant variants at each time point was quanti-tated by averaging the relative peak heights from the sense and antisense sequencing reactions from a minimum of two replicate infections. We have found that this approach correlates with relative proportions as measured by clonal analysis (40).
Analysis of flow data.Flow cytometry data were analyzed by using CellQuest software (Becton Dickinson, San Jose, CA). Viable cells were gated based on their forward-scatter and side-scatter profiles. Gated cells were then analyzed by using a density plot of FL1 (FITC-Thy1.1) versus FL2 (PE-Thy1.2). Each culture was stained with either the anti-Thy1.1 or anti-Thy1.2 antibodies alone or with both antibodies. The gate defining positivity for the Thy1.1-stained sample was set using the Thy1.2 antibody-stained sample as a negative control, with a thresh-old of⬍0.05%. The same was done for the gate defining positivity for Thy1.2
using cells stained with the Thy1.1 antibody alone as a negative control. These gates were then used to determine the proportions of Thy1.1-infected cells, Thy1.2-infected cells, and dually infected cells in the dual-antibody-stained sam-ple. The total percentage of Thy1.1-infected cells for each sample was deter-mined by adding the percentage of singly stained (Thy1.1) positive cells and dually stained (Thy1.1 and Thy1.2) positive cells. The same was done for the total percentage of Thy1.2-positive cells. In order to minimize variability in setting gates, all gates were set by one observer, who was blinded as to the PR and RT genotype of the competing variants.
Fitness calculation and statistical analysis.The replication efficiency of each variant was estimated by using two time points according to the method of Maree et al. (25). We have shown that relative fitness, as estimated using this method is different than the selection coefficient (s), used in population genetics, which reflects the number of progeny contributed to the next generation by a mutant (41). We have therefore referred to the replication efficiency as estimated by Maree and coworkers as the production rate ratio or “p” (41).
We used the equation:p⫽ln[H(T)/H(0)]/(ln[W(T)/W(0)]⫹ ␦T). W(T)/W(0)is the fold expansion of wild-type virus, which was calculated by dividing the number of wild-type infected cells in the culture at timeTby the number at time zero. The number of viable wild-type or mutant infected cells was calculated by multiplying the number of viable cells in the total culture by the percent as determined by flow cytometry. H(T)/H(0)is the fold change in the mutant to wild-type ratio overTdays of the experiment. This was calculated by determining the proportion of mutant to wild-type at timeT(the number of cells infected by mutant virus divided by the sum of mutant and wild-type infected cells), divided by the same proportion at time zero. Delta (␦) is defined as the life span of an infected cell and was assumed to be 0.5/day (25).
Three criteria were used to determine which two time points from each experiment to include in the calculation ofp: (i) the percentage of dually infected cells, defined as cells which express both Thy1.1 and Thy1.2, should not be significant (defined asⱖ20% of the less-well-replicating virus); (ii) measurable growth of the wild-type virus should be detected (defined as a positive slope in a plot of log percent infected cells versus time); and (iii) the percentage of cells infected by each variant should be above background (ⱖ0.05%). If more than one combination of time points satisfied these three criteria, then the longest and latest window of time was chosen.
Each mutant was competed against a reference strain in at least three separate infections, and the values ofpwere averaged. The averages of the production rate ratio,p, for each mutant were compared to K103N by using thettest. A significantPvalue was corrected for nonorthogonal multiple comparisons by using the Bonferroni adjustment.
RESULTS
Assay design.We have designed a recombinant-virus,
mul-tiple-cycle growth competition assay that obviates the need to purify and analyze HIV-1 RNA or DNA. The proportions of test and reference HIV-1 isolates are measured by using flow cytometry to detect reporter genes expressed by each virus on the surface of infected cells. The constructs used for this assay are shown in Fig. 1. The Thy1.1 and Thy1.2 coding sequences are identical except for the mutation at codon 108 and yet can be distinguished by using commercially available fluorescence-labeled monoclonal antibodies. Thus, the backbone of the two viruses that are competing are nearly identical. We produced separate virus stocks by transfection in 293 cells and then performed infections with each mutant in combination with a
wild-type reference strain expressing a different Thy allele.
Different p24 antigen ratios of the mutant and reference strain were chosen that were either equal or favored the mutant. Cells were removed from each culture at days 3, 4, 5, and 6 for staining.
Specificity and linearity of staining. Figure 2 shows the
staining of cells coinfected with K103N-AT1 and wild-type-AT2 viruses at day 6, stained with either anti-Thy1.1 antibody alone (Fig. 2A), anti-Thy1.2 antibody alone (Fig. 2B), or both antibodies (Fig. 2C). Staining with the fluorescent-labeled
on May 16, 2020 by guest
http://jcm.asm.org/
Thy1.1 and Thy1.2 antibodies is specific: we found no staining of infected cells using isotype control antibodies (data not shown) and detected no staining when each Thy antibody was used to stain cells infected by the heterologous virus (Fig. 2A and B). Thresholds to distinguish positive- from negative-stain-ing cells were set usnegative-stain-ing the heterologous anti-Thy antibody as a control. Thresholds using singly stained samples were set
so that ⬍0.05% of Thy1.1-infected cells were positive when
stained with the Thy1.2 antibody and vice versa. The percent infected cells, as determined by the dually stained sample, was used to calculate the proportions of the wild type and mutant. The percentage of cells infected by both viruses (upper right quadrant, Fig. 2C) was added to both the singly infected Thy1.1 positive and the Thy1.2 cells. All data presented here use gates set by one observer, who was blinded as to the genotype of the Thy1.1 and Thy1.2 viruses. We noted some minor differences in quantitation of the two viruses depending on whether single- or dual-stained samples were used. There-fore, we always compared the two variants using the dual-stained sample.
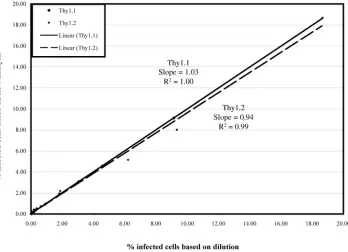
In order to determine whether staining was linear, PM1 cells were singly infected with wild-type virus expressing either Thy1.1 or Thy1.2. Thy1.1-infected cells were then serially di-luted with Thy1.2-infected cells and stained with the anti-Thy1.1 antibody. The reverse was done with Thy1.2-infected cells. Figure 3 shows that measurement of the percentage of infected cells is linear through the entire range of dilutions tested. The Thy1.1 and 1.2 antibodies also have similar
sensi-tivities (Thy1.1, slope of line⫽1.03 and R2 ⫽ 1.00; Thy1.2,
slope of line⫽0.94 andR2⫽0.99).
Correlation of infected cell number, as measured by flow
cytometry, with p24 antigen accumulation.In order to
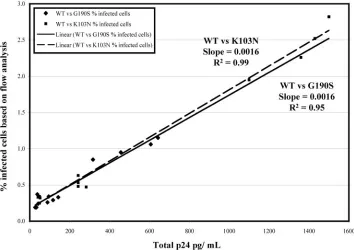
deter-mine whether the number of infected cells, as measured by flow cytometry, correlated with a more traditional measure of virus replication, the p24 antigen concentration in the culture supernatant was measured in addition to the proportion of infected cells for competition experiments between wild-type and either the G190S or the K103N mutant. Figure 4 shows that the total percentage of infected cells measured by flow cytometry correlated linearly with p24 antigen content of the
culture (slope of G190S ⫽ 0.0016 and R2 ⫽ 0.99; slope of
K103N⫽0.0016 andR2⫽0.95).
Replication efficiencies of the wild-type AT1 and AT2
vi-ruses.Before we tested site-directed mutants in the Thy1.1 and
Thy1.2 backgrounds, we wanted to determine whether the growth or change in proportion over time of wild-type viruses expressing the Thy1.1 and Thy1.2 gene products were the same. PM1 cells were coinfected with different ratios of the wild-type AT1 and AT2 viruses. Cells were removed from each culture at days 3, 4, 5, and 6 for staining with Thy1.1- and 1.2-specific antibodies. The growth of the wild-type AT1 and AT2 viruses was similar regardless of whether the percent infected cells or absolute numbers of infected cells is plotted over time, indicating that the total number of cells in culture remained relatively constant over the time course of the assay (Fig. 5A). Importantly, there were no significant changes in the relative proportions of each virus over the
time course of the assay, suggesting that the differentThy
[image:4.585.52.270.83.626.2]alleles do not have significantly different effects on HIV replication efficiency (Fig. 5B).
FIG. 2. Density plots of infected cells. PM1 cells were coinfected with K103N-AT1 and wild-type AT2 viruses. Cells were stained at day 6 with either FITC-Thy1.1 antibody alone (A), PE-Thy1.2 antibody alone (B), or both antibodies (C). The log fluorescence intensities of FL1-H (FITC-Thy1.1) and FL2-H (PE-Thy1.2) are shown on thexaxis andy axis, respectively. The horizontal and vertical lines represent gates that define positivity. The number of cells infected with K103N virus, wild-type virus, and both viruses is shown as a percentage in the upper left, lower right, and upper right quadrants, respectively.
on May 16, 2020 by guest
http://jcm.asm.org/
Abililty of the assay to categorize the relative replication
efficiency of site-directed mutants of PR and RT.In order to
evaluate the performance of the assay, a series of drug-resis-tant PR and RT mudrug-resis-tants whose fitness had been previously measured using growth competition experiments was analyzed. We wanted to include mutants in PR and RT, which had either been shown to have minimal reductions in fitness relative to wild-type virus, or substantial reductions in fitness. This would allow us to determine whether this flow cytometry-based assay was able to provide the same fitness classification as traditional multiple-cycle growth competition experiments. Because we wanted to determine the effects of specific mutations and be-cause we were comparing our results with published or pre-sented data, we chose to use site-directed mutants in an NL4-3 backbone for these studies. We chose PR inhibitor-resistant mutants D30N and L90M, which have been shown to have substantial and minor impairments, respectively, in replication efficiency (27). We also tested the RT mutants K103N, V106A, G190S, and P236L. K103N has replication efficiency that is minimally impaired compared to wild-type virus, whereas the other mutants confer more substantial reductions in replica-tion efficiency (3, 15, 20, 40).
Using these mutant viruses, this assay can distinguish the K103N mutant, which has a relatively preserved replication efficiency, from G190S, which has a replication efficiency sub-stantially reduced compared to the wild type (Fig. 6). For example, the growth rate of G190S is substantially slower than the wild type in the same culture, even though the mutant was
initially at a higher prevalence than wild-type virus (Fig. 6A and B). No such difference in replication rates can be seen with the K103N mutant over the 6-day course of the experiment (Fig. 6C and D).
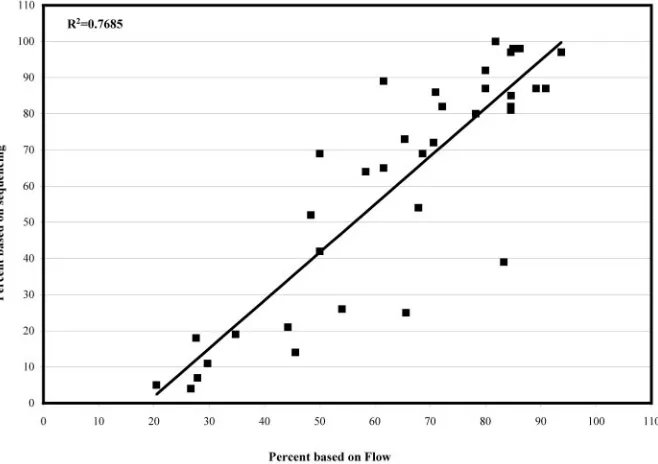
This assay also detected reductions in replication efficiency conferred by the P236L (Fig. 7D), D30N, and V106A mutants (data not shown). No significant reduction in replication effi-ciency for the L90M mutant was observed (Fig. 7A). In gen-eral, sequence analysis and flow cytometry detected similar changes in the relative proportions of each mutant over time (Fig. 7A to D), suggesting that recombination between the Thy
reporter gene andpol was not occurring at a significant
fre-quency during the course of this assay. The correlation be-tween the proportion of a mutant detected by sequencing ver-sus flow cytometry showed a reasonably good correlation for
all of the mutants tested (R2⫽0.77, Fig. 8).
Estimation of relative replication efficiencies of
drug-resis-tant mudrug-resis-tants.We then quantified the relative replication
effi-ciencies of each mutant relative to the wild-type virus. We tested each mutant in both the Thy1.1 and the Thy1.2 back-grounds, compared to the appropriate Thy-expressing
wild-type virus. We calculated the production rate ratio (p), as
described in Materials and Methods. More detail on how these estimates are derived can be found elsewhere (25, 41).
[image:5.585.120.468.71.323.2]We observed that certain experimental conditions led to higher variability in the production rate ratios for the same mutant. These conditions included the presence of significant proportions of cells that were dually infected with both viruses,
FIG. 3. Linearity of flow staining. PM1 cells were singly infected with or Thy1.2-expressing wild-type virus. Cells from the Thy1.1-infected culture were counted and diluted with cells from the Thy1.2-Thy1.1-infected culture, and the reciprocal was done for the Thy1.2-Thy1.1-infected culture. The following dilutions of cells were then stained with either the Thy1.1 or the Thy1.2 antibodies: undiluted, 1:2, 1:3, 1:5, 1:10, 1:30, 1:50, 1:100, 1:500, and 1:1,000. Thexaxis represents the percentage of infected cells based on dilution. For the Thy1.1 data, this number was obtained by taking the percentage of Thy1.1-positive cells from the undiluted sample as measured by flow and dividing it by each dilution. The same was done for the Thy1.2 data. Theyaxis represents the percentage of infected cells as measured by flow cytometry.}, Cells infected with wild-type Thy1.1;■, cells infected with wild-type Thy1.2. The solid and dotted lines represent the best-fit linear curves for Thy1.1 and Thy1.2, respectively. The slopes andR2values are shown next to each curve.
on May 16, 2020 by guest
http://jcm.asm.org/
significant lags in growth of wild-type virus, and levels of in-fected cells that were at or below our defined background threshold of 0.05%. As a result, we defined specific criteria for which datum points are included in the calculation of the production rate ratio. We observed that after day 6 the number of susceptible cells is limiting enough that significant numbers of dually infected cells occur. Since dually infected cells can produce recombinant viruses and since we have not evaluated the effect of dual infection on the competition between two viruses, we did not include time points in which there was
significant dual infection (defined as ⱖ20% of the
less-well-replicating virus). We also required that there should be de-tectable growth of the wild-type virus (defined as a positive slope in a plot of log percent infected cells versus time) and that the percentage of cells infected by each variant should be
ⱖ0.05%. These guidelines were established during early
exper-iments with the wild-type and K103N variants and were for-mulated before we initiated this analysis of the different mu-tants.
Using these criteria, we calculated the production rate ratio,
p, for each of the mutants in both the Thy1.1 and the Thy1.2
backgrounds (Table 1). In order to limit the number of com-parisons performed, we compared the value for each mutant to that of K103N, using it as an example of a mutant with rela-tively preserved fitness. The D30N, G190S, and P236L mutants all had significantly negative production rate ratios compared to K103N in both backgrounds, whereas L90M was not signif-icantly different. The reduction in replication efficiency for V106A was significantly reduced compared to K103N when
V106A was placed in the Thy1.2 background, but this reduc-tion only trended toward statistical significance in the 1.1
back-ground, when we corrected for multiple comparisons (P ⫽
0.027). With the exception of the D30N mutant, all values for replication efficiency tended to be more negative when assayed in a Thy1.2 background compared to the Thy1.1 background. Thus, there may be a slight improvement in the relative fitness of the AT1 viruses relative to AT2, which we did not detect in our wild-type–wild-type competitions, that could have led to an obscuring of the fitness reduction conferred by V106A in the Thy1.1 background.
Fitness assay using patient PR and RT sequences.We then
[image:6.585.115.469.72.322.2]assayed recombinant viruses that contained PR and RT se-quences from five different patients who had prior treatment experience and were failing a combination antiretroviral regi-men. Primers containing ApaI and AgeI restriction endonu-clease sites were used to amplify PR and RT from patient plasma, and then the resulting product was cloned into a PCR cloning vector. The entire insert from the ApaI to AgeI re-striction sites was screened by sequencing and then subcloned into pAT1. Clones from each patient were sequenced and compared to the bulk plasma sequence. Three clones that had a single base deletion were not tested further. A panel of restriction digests was performed to ensure that there were no significant deletions or duplications present in these clones in areas outside the sequenced region. Virus stocks were pro-duced from the selected clones, as was done for the site-directed mutants, and each was assayed in growth competition experiments with wild-type AT2 virus.
FIG. 4. Correlation of p24 quantitation with flow analysis. Seven million PM1 cells were coinfected with the following combinations of virus: wild-type AT1/G190S-AT2, wild-type AT2/G190S-AT1, wild-type AT1/K103N-AT2, and wild-type AT2/K103N-AT1. A total of 300 ng of p24 was used at either equal ratios or ratios favoring the mutant. On days 3, 4, 5, and 6 cells were removed from the culture for staining, and supernatant was removed for p24 antigen quantitation. Thexaxis represents the p24 concentration in pg/ml. Theyaxis represents the percentage of infected cells obtained by flow analysis. The data from both Thy alleles were combined into one plot for each mutant competition.}, G190S versus wild-type competitions;■, K103N versus wild-type competitions. The solid and dotted lines represent the best-fit linear curve for the G190S and K103N competitions, respectively.
on May 16, 2020 by guest
http://jcm.asm.org/
Table 2 provides a summary for the patient clones tested. The sequences of p6, PR, and RT show that each clone had a unique genotype. Two of seventeen clones produced virus stocks with p24 concentrations too low to test in the competi-tion assay (clones 3-1 and 5-1). These defects in p24
produc-tion may be due to one or more mutaproduc-tions ingagor protease
that are unique to these clinical viral sequences or may reflect incompatibility between these clinical viral sequences and that of NL4-3. We think this is probably not due to a cloning artifact
because we performed extensive restriction digests and se-quenced the clinical isolate insert through the cloning sites, but we cannot completely rule out a small deletion or duplication in the viral vector sequence that may have been missed by our restriction enzyme digests and sequence analysis (see Materi-als and Methods). Of the 15 clones tested in culture, 7 did not establish a productive infection in the growth competition as-say, with productive infection defined as a percentage of
in-fected cells above baseline (ⱖ0.05%) at a minimum of 2 time
FIG. 5. Competition assay of wild-type Thy1.1 versus wild-type Thy1.2. Seven million PM1 cells were coinfected with wild-type AT2 and AT1. A total of 300 ng of p24 was used at a ratio of 150 ng (50%) of Thy1.2 to 150 ng (50%) of Thy1.1. (A) Theyaxis represents the percentage of cells infected on a logarithmic scale (left side) or the corresponding total number of infected viable cells (right side) versus time after infection in days. (B) The percentage of the culture contributed by each genotype was calculated by dividing the percentage of infected cells (or the number of infected cells) determined for each virus and dividing it by the sum of the percent infected cells (or the number of infected cells) for both viruses and then multiplying that value by 100%.
on May 16, 2020 by guest
http://jcm.asm.org/
FIG.
6.
Competition
of
G190S
and
K103N
versus
wild
type.
Seven
million
PM1
cells
were
coinfected
with
wild-type
AT2
and
G190S-AT1
or
wild-type
AT2
and
K103N-AT1.
A
total
of
300
ng
of
p24
was
used
at
a
ratio
of
225
ng
(75%)
of
mutant
to
75
ng
(25%)
of
wild
type
(WT).
The
x
axis
represents
time
in
days.
The
y
axis
represents
either
the
percentage
of
infected
cells
on
a
logarithmic
scale
for
G190S
versus
the
wild
type
(A)
and
K103N
versus
the
wild
type
(C)
or
the
pro
portions
of
mutant
and
wild
type
for
G190S
versus
the
wild
type
(B)
and
K103N
versus
the
wild
type
(D).
The
dotted
line
represents
the
mutant,
and
the
solid
line
repre
sents
the
wild
type.
The
proportion
of
each
genotype
was
calculated
by
dividing
the
percent
infected
cells
or
the
number
of
infected
cells
determined
for
each
virus
and
dividing
it
by
the
sum
of
the
percent
infected
cells
or
the
number
of
infected
cells
for
both
viruses.
on May 16, 2020 by guest
http://jcm.asm.org/
FIG.
7.
Proportion
of
mutant
over
time
measured
by
flow
or
sequencing.
Seven
million
PM1
cells
were
coinfected
with
wild-type
and
one
of
the
following
mu
tant
viruses:
L90M,
K103N,
G190S,
or
P236L.
A
total
of
300
ng
of
p24
was
used
at
a
ratio
equal
to
or
favoring
the
mutant,
either
50:50
or
75:25.
The
x
axis
represents
time
in
days.
The
y
axis
represents
the
percent
mutant.
(A)
L90M;
(B)
K103N;
(C)
G190S;
(D)
P236L.
The
dotted
line
represents
the
percent
mutant
as
measured
by
sequencing,
and
the
solid
line
represents
the
percent
mutant
as
measured
by
flow.
on May 16, 2020 by guest
http://jcm.asm.org/
[image:9.585.60.527.114.668.2]points (clones 1-1, 2-1, 3-4, 4-1, 4-2, 5-2, and 5-3). Again, this may be due to deleterious mutations or, less likely, a cloning artifact. As can be seen in Table 2, when three to four clones per sample were tested, all patient samples yielded at least one clone that could be assayed and which resulted in a productive infection.
Of three patients from whom we were able to obtain more than one clone that led to productive infection, two had cloned viruses with similar relative replication efficiencies. For exam-ple, clones from subject 1 demonstrated reduced replication efficiency relative to the wild type (Fig. 9B and Table 2),
whereas those from subject 2 had a similar replication effi-ciency compared to the wild-type virus (Fig. 9A and Table 2). An exception to this is subject 3, who had one clone (3–2) with reduced replication efficiency and one clone (3–3) with a less severe replication defect (Table 2).
DISCUSSION
We have developed a growth competition assay to measure HIV-1 replication efficiency over multiple virus replication cy-cles, using flow cytometry to quantify the relative amounts of reference and test virus. Over the course of the 6-day growth competition, we found no significant differences between the wild-type AT1 and AT2 viruses, suggesting that the different
Thyalleles do not significantly impact HIV-1 replication
effi-ciency. Advantages of the assay are the ease with which mutant and reference strains can be distinguished and the ability to detect dually infected cells. The ability to detect significant dual infection is important, since intracellular competition or compensation could affect apparent relative replication effi-ciencies. It has also been demonstrated that coinfection is a prerequisite for recombination (18) and that superinfection occurs readily in cell culture and in patients (2, 12, 21, 34); one can thus avoid conditions that would promote recombination between the test and reference strains. The assay is also repro-ducible and correlates well with a more traditional method for detecting viral growth and the relative proportions of the com-peting viruses.
This assay gives results similar to a traditional growth com-petition assay when the relative replication efficiencies of single drug-resistant mutants are compared. Using this assay we con-firmed studies by Martinez-Picado et al. showing that the PR inhibitor-resistant mutant D30N has reduced replication
[image:10.585.129.458.72.304.2]effi-FIG. 8. Correlation of the proportion of infected cells, determined by flow cytometry, with sequence analysis. The proportions of mutant determined at each time point were combined into one plot of proportion measured by flow (xaxis) versus proportion measured by sequencing (yaxis).
TABLE 1. Values for the production rate ratio (p)for site-directed mutants of HIV-1 PR and RT
PR or RT
Mutant/Thy allele
No. of replicates
Production rate ratio (p)
relative to wild-type virus
SD Pa
PR D30N/Thy1.1 5 ⫺0.64 0.10 ⬍0.0001
L90M/Thy1.1 6 0.09 0.17 0.3836
RT K103N/Thy1.1 9 0.03 0.12 NA
V106A/Thy1.1 5 ⫺0.12 0.08 0.0270
G190S/Thy1.1 14 ⫺0.28 0.12 ⬍0.0001 P236L/Thy1.1 8 ⫺0.23 0.07 ⬍0.0001
PR D30N/Thy1.2 6 ⫺0.47 0.11 ⬍0.0001
L90M/Thy1.2 6 ⫺0.04 0.11 0.3595
RT K103N/Thy1.2 9 ⫺0.08 0.09 NA
V106A/Thy1.2 8 ⫺0.22 0.03 0.0018
G190S/Thy1.2 11 ⫺0.34 0.09 ⬍0.0001 P236L/Thy1.2 6 ⫺0.29 0.06 ⬍0.0001
aThat is, thePvalue comparing the production rate ratio to K103N with the
same Thy allele(s). A significantPvalue, corrected for nonorthogonal multiple comparisons based on Bonferronitprocedure (Bonferroni adjustment), is con-sidered to be⬍0.01 (0.05/5). The correction is based on a total of five pairwise comparisons: each mutant versus K103N in the same Thy background.
on May 16, 2020 by guest
http://jcm.asm.org/
TABLE 2. Mutations ap24 titer, and production rate ratios for clones derived from patient samples Patient Clone Gag p6 mutations f PR mutations RT mutations p24 titer g (ng/ml) p value relative to wild-type virus b SD 1 c 1 S47N L10I, L63P, A71V, I72L, G73S, V82A, L90M V35T, V60I, D67N, T69N, K70R, V90I, A98S, Q102K, K104N, K122E, I135V, A158S, C162S, M184V, R211K, T215F, K219Q, V245K, A272P, E297K 633 ND d ND 2 S47N, S50L L10I, K45R , L63P, H69R, A71V, I72L, G73S, V82A, L90M V35T, V60I, D67N, T69N, K70R, V90I, A98S, Q102K, K104N, K122E, I135V, A158S, C162S, M184V, R211K, T215F, D218E , K219Q, V245K, A272P, E297K 227 ⫺ 0.39 0.05 3 S47N L10I, L63P, H69R, A71V, I72L, G73S, V82A, L90M V21I , V35T, V60I, D67N, T69N, K70R, V90I, A98S, Q102K, K104N, K122E, I135V, A158S, C162S, M184V, R211K, T215F, D218E , K219Q, V245K, A272P, 5297K 317 ⫺ 0.46 0.05 2 1 S47N L10I, E35D , M36I, N37T , I62V, L63P, I64V, A71V, I84V, I85V , N88S , L90M, I93L V35T, M41L, E44D, D67N, T69D, Q102K, V106I, V188I, K122E, D123E, I142S , C162S, G196E, Q197R , E203K, H208Y, L210W, R211K, T215C, K223Q, A272P, R277K, K281R, V293I, E297K 483 ND ND 2 L1P, P5L, F17C, E20G, Q28P, A39T, S47N L10I, M36I, N37T , M46I, R57G, I62V, L63P, A71V, I84V, L90M, I93L T39A, M41L, E44D, D67N, T69D, Q102K, V106I, V188I, K122E, D123E, C162S, N175S , I178L, G196E, E203K, H208Y, L210W, R211K, T215Y, K223Q, A272P, R277K, K281R, E297K 853 0.04 0.09 3 L1P, P5L, F15C, F17C, E20G, Q28P, A39T, S47N L10I, M36I, N37S, M46I, R57G, I62V, L63P, I64V, A71V, I84V, L90M, I93L T39A, M41L, E44D, D67N, T69D, Q102K, V106I, V188I, K122E, D123E, C162S, I178L, G196E, E203K, H208Y, L210W, R211K, T215Y, K223Q, A272P, R277K, K281R, E297K 770 0.05 0.07 3 1 R42K, S47N T12S, N37S, L63P, I72V, V77I , I93L L74V, A98S, Q102K, K103N, D123E, C162S, D177E, M184V, K259E , R277K, E297A, E298G 2N T e NT 2 R42K, S47N T12A, L63P, I72V, I93L K70R , L74V, A98S, Q102K, K103N, D123E, C162S, D177E, M184V, G196E, R277K, E297A 703 ⫺ 0.52 0.04 3 R42K, S47N, S51L L19I , N37S, L63P, A71T , I72V, I93L L74V, A98S, Q102K, K103N, D123E, C162S, D177E, M184V, G196E, K219R , D237G , R277K, E297A 533 ⫺ 0.15 0.04 4 S3N, T8S, T21A, P30T, R42K, S47N T12A, G57R, L63P, I72V, I93L L74V, A98S, Q102K, K103N, D123E, Q151R , C162S, D177E, M184V, G196E, R277K, E297A 213 ND ND 4 1 S47N K14R , E35D, N37D , L63P E6D , M16T , M41L, Q102K, K103N, D123E, C162S, D185G , Q207E, T215Y, M230L , K275R , R277K 540 ND ND 2 S47N E35D, N37S, L63P M41L, L74V, Q102K, D123E, F160L , C162S, Y181C, Q207E, T215Y, R277K, V293I 617 ND ND 3 S3N, T8S, T22A, S47N E35D, N37S, G57R, L63P M41L, Q102K, K103N, D123E, I142V , C162S, T215Y, R277K 163 ⫺ 0.56 0.35 5 1 S47N T12P, L19I, D25N , M36I, N37T, L63T M41L, V60I, D67G , R83K, Q102K, D123E, I135T, C162S, K166R, R211K, T215Y, A272P, R277K, V293I, E297K 2N T N T 2 L1P, P5L, F17Y, S25D, Q28P, P30L, L35R T12P, L19I, M36I, N37T, G57R, I62V, L63S, I64V M41L, V60I, R83K, Q102K, D123E, I135T, C162S, K166R, R211K, T215Y, A272P, K275E , R277K, V293I, E297K 187 ND ND 3 S47N T12P, L19I, M36I, N37A, L63T M41L, V60I, R83K, Q102K, D123E, I135T, C162S, K166R, K201E , R211K, A272P, R277K, K281R , V293I, E297K 61 ND ND 4 S47N T12P, L19I, M36I, N37A, L63T E6K , V60I, K70R , R83K, Q102K, D123E, I135T, C162S, K166R, F171L , E203K , R211K, A272P, R277K, V293I, E297K 83 ⫺ 0.77 0.10 aThe amino acid mutations listed are dif ferences between the patient clone sequence and NL4-3. Mutations in boldface were not present in the patient’s bulk plasma sequence. The bulk sequence starts at amino acid 42 of p6. bEach clone was tested in triplicate against wild-type AT2 at a ratio of 75 to 25. p , production rate ratio. cAll three clones from this patient had the following 30-bp insertion in p6 after codon 11: GAGAGCAGGCCAGAGCCAACAGCCCCACCA. This insertion was not pr esent in the plasma sequence. dND, calculation not done; virus derived from this clone was unable to establish productive infection ( ⬍ 0.05% infected cells). eNT, not nested; the clone did not produce enough p24 to test in this assay. fOnly two clones had mutations in p7 and p1. 013RWS clone 7 had two mutations in p7: M17I and T21S. 008JSM clone 5 had one mutation in p1: H9N. gp24 content of the viral stock produced after transfection.
on May 16, 2020 by guest
http://jcm.asm.org/
ciency compared to L90M (26). Our laboratory has character-ized the replication efficiencies of the non-nucleoside RT in-hibitor-resistant mutants K103N, V106A, G190S, and P236L. We have consistently observed that the K103N mutant repli-cates more efficiently than V106A, G190S, and P236L (3, 15, 40). Although our early studies demonstrated a reduction in the replication kinetics of K103N relative to wild-type virus in
parallel infections (15), our subsequent studies using growth competition assays have shown minimal reductions in the rep-lication efficiency of K103N, which require 2 to 3 weeks of coculture to detect, using direct sequence analysis of PCR products (20). Another group, using a different cell line and approach to calculating relative fitness, has also found that K103N is more fit than other non-nucleoside RT
inhibitor-FIG. 9. Replication of patient clones. Seven million PM1 cells were coinfected with a total of 300 ng of p24 at a ratio of 225 ng (75%) of patient clone to 75 ng (25%) of wild type (WT). Thexaxis represents time in days. Theyaxis represents either the number of cells infected on a logarithmic scale for patient 2-clone B12 (‚) versus wild type or patient 2-clone C7 (䊐) (A) or patient 1-clone 2 (‚) versus wild type or patient 1-clone 7 (䊐) versus wild type (B). The dotted lines represent the patient clones, and the solid lines represent wild-type virus.
on May 16, 2020 by guest
http://jcm.asm.org/
resistant mutants tested, including G190A and V106A (10). The reduced fitness of G190S has also been noted by other investigators (19). The results produced with our flow cytom-etry-based assay are thus consistent with these previously pub-lished works.
In general, we found similar results for each mutant virus whether it was derived from the pAT1 or the pAT2 vector. We
did note that the V106A production rate ratio,p, was
signifi-cantly reduced compared to K103N when the V106A mutation was present in the Thy1.2 background but only showed a trend to being reduced in the Thy1.1 background. We have con-firmed this result with independently generated virus stocks and independently cloned constructs (data not shown), so we do not believe this finding reflects a technical artifact. Al-though we have not definitively determined the cause for this finding, we postulate that there is a subtle increase in the relative replication efficiency of the AT1 viruses relative to AT2 that was not detected in our 6-day competition assay between the wild-type AT1 and AT2 viruses. If so, this could explain the observed trend toward slightly higher (i.e., less negative) relative fitness values for most of the AT1 viruses (Table 2) and may explain the lack of a significant reduction in the replication efficiency of the V106A-AT1 virus relative to the K103N mutant.
We did not observe significant reductions in the replication efficiency of the L90M and K103N mutants relative to wild-type virus using this assay. This finding is compatible with the relative preservation of replication efficiency of these mutants that has been observed in previous studies. We would not expect a growth competition assay that occurs over a week’s time to reliably detect the subtle reductions in replication ef-ficiency that occur with the K103N and L90M mutants; pre-sumably, assaying replication over larger numbers of replica-tion cycles would amplify the differences between the mutant and reference viruses and allow the detection of these subtle replication defects (9). The assay we present here is designed to detect larger reductions in replication efficiency, which we believe are more likely to be clinically significant. We believe that modifying the assay, so that culture supernatant from the day 6 culture can be used to reinfect fresh cells, could improve the sensitivity of this assay, although it would lengthen its turnaround time and increase its complexity.
It should be noted that the flow cytometry-based competi-tion assay described here has some limitacompeti-tions. For example, this assay utilizes cell lines, rather than primary human periph-eral blood mononuclear cells (PBMC), for both the production and the propagation of test and reference viruses. An advan-tage of using cell lines is reduced variability in infection effi-ciency; such variability can be observed in PBMC obtained from different donors. However, it is possible that the replica-tion in these cell lines may not fully reflect the replicareplica-tion fitness of HIV-1 variants compared to the replication in PBMC. The lamivudine-resistant RT mutant M184V has been shown to have different replication properties in PBMC com-pared to MT2 cells (5). In contrast, similar relative replication efficiencies were observed in cell lines and PBMC for some non-nucleoside inhibitor- and enfuvirtide-resistant HIV vari-ants (15, 23). Another potential problem that has been ob-served by others is the rapid reversion of a mutant over the course of a replication assay (37). To date, we have not
ob-served reversion using direct sequence analysis (data not shown), but this could occur, particularly with poorly fit mu-tants, such as those studied by Sharma et al. (37). In addition, our assay is a recombinant virus assay, reflecting only determi-nants of replication efficiency that are present in the PR and RT regions of the viral genome. Thus, this assay may give different results than an assay that utilizes whole virus isolates. A whole virus growth competition assay has been shown to correlate with clinical progression in small numbers of patients (32) and may explain the relative prevalence of different HIV variants worldwide (4). Recombinant virus assays may prove to be more predictive of outcome in treatment-experienced, rather than untreated patients, although this remains to be demonstrated.
It is also not clear at present whether multiple cycle or single cycle assays best reflect replication fitness of virus isolates in patients. Much of the preliminary data correlating replication capacity with viral load and CD4 responses has been obtained using a commercially available recombinant-virus, single-cycle assay, in which test and reference strains are compared in parallel infections (7, 8, 13). Although extensive comparisons of single- and multiple-cycle assays have not been performed, it is quite possible that these assays could result in different assessments of relative fitness. Single-cycle assays primarily measure the infectivity of the virus, whereas multiple-cycle assays evaluate infectivity, as well as the rate and efficiency of virus production.
Some data suggest that replication efficiency, measured in cell culture by using different assays, correlates with CD4 count and viral load (6, 11, 13, 17, 38) and clinical prognosis (32). However, there is not yet a consensus on the clinical signifi-cance of replication fitness or the best way to measure this parameter. Further studies are thus needed to confirm these observations. Barbour et al. have also shown that the replica-tion capacity conferred by clinical HIV-1 PR and RT sequences, as measured by a recombinant virus single-cycle parallel infection assay, varies dramatically (5 to 81% of the wild-type reference strain NL4-3) (7). It is not known whether differences such as these can influence the natural history of HIV-1 infection or response to therapy. These studies have primarily been per-formed by using parallel infections, in which the test and ref-erence virus are cultured separately. Growth competition as-says to measure replication fitness have not been used in large numbers of clinical samples, primarily because of the labor-intensive nature of these assays. This is unfortunate, because when directly compared, growth competition assays are more sensitive to subtle differences in replication fitness than are parallel cultures (10, 30). An important question is whether stronger correlations between fitness and outcome would be seen if test and reference viruses could be compared in the same culture. We have demonstrated with this assay that pa-tient PR and RT sequences can be cloned into our vectors and tested against a wild-type reference strain to determine their fitness. Since our assay is less labor-intensive, we should be able to test a larger number of patient samples and address some of these questions.
ACKNOWLEDGMENTS
We thank Kyriakos Deriziotis, Amanda Moore, Kora Fox, and Patrice Kurnath for their technical expertise.
on May 16, 2020 by guest
http://jcm.asm.org/
This study was supported by National Institutes of Health grants R01-AI-041387, R01-AI-065217, and N01-AI-38858 (subcontract 200VC007) to L.M.D. and grant R01-AI-049075 to V.P.
REFERENCES
1.Adachi, A., H. E. Gendelman, S. Koenig, T. Folks, R. Willey, A. Rabson, and M. A. Martin.1986. Production of acquired immunodeficiency syndrome-associated retrovirus in human and nonhuman cells transfected with an infectious molecular clone. J. Virol.59:284–291.
2.Altfeld, M., T. M. Allen, X. G. Yu, M. N. Johnston, D. Agrawal, B. T. Korber, D. C. Montefiori, D. H. O’Connor, B. T. Davis, P. K. Lee, E. L. Maier, J. Harlow, P. J. Goulder, C. Brander, E. S. Rosenberg, and B. D. Walker.2002. HIV-1 superinfection despite broad CD8⫹T-cell responses containing rep-lication of the primary virus. Nature420:434–439.
3.Archer, R. H., C. Dykes, P. Gerondelis, A. Lloyd, P. Fay, R. C. Reichman, R. A. Bambara, and L. M. Demeter.2000. Mutants of human immunodefi-ciency virus type 1 (HIV-1) reverse transcriptase resistant to nonnucleoside reverse transcriptase inhibitors demonstrate altered rates of RNase H cleav-age that correlate with HIV-1 replication fitness in cell culture. J. Virol.
74:8390–8401.
4.Arien, K. K., A. Abraha, M. E. Quinones-Mateu, L. Kestens, G. Vanham, and E. J. Arts.2005. The replicative fitness of primary human immunode-ficiency virus type 1 (HIV-1) group M, HIV-1 group O, and HIV-2 isolates. J. Virol.79:8979–8990.
5.Back, N. K., M. Nijhuis, W. Keulen, C. A. Boucher, B. O. Oude Essink, A. B. van Kuilenburg, A. H. van Gennip, and B. Berkhout.1996. Reduced repli-cation of 3TC-resistant HIV-1 variants in primary cells due to a processivity defect of the reverse transcriptase enzyme. EMBO J.15:4040–4049. 6.Barbour, J. D., F. M. Hecht, T. Wrin, M. R. Segal, C. A. Ramstead, T. J.
Liegler, M. P. Busch, C. J. Petropoulos, N. S. Hellmann, J. O. Kahn, and R. M. Grant.2004. Higher CD4⫹T-cell counts associated with low viral pol replication capacity among treatment-naive adults in early HIV-1 infection. J. Infect. Dis.190:251–256.
7.Barbour, J. D., T. Wrin, R. M. Grant, J. N. Martin, M. R. Segal, C. J. Petropoulos, and S. G. Deeks.2002. Evolution of phenotypic drug suscepti-bility and viral replication capacity during long-term virologic failure of protease inhibitor therapy in human immunodeficiency virus-infected adults. J. Virol.76:11104–11112.
8.Bates, M., T. Wrin, W. Huang, C. Petropoulos, and N. Hellmann.2003. Practical applications of viral fitness in clinical practice. Curr. Opin. Infect. Dis.16:11–18.
9.Coffin, J. M.1995. HIV population dynamics in vivo: implications for genetic variation, pathogenesis, and therapy. Science267:483–489.
10.Collins, J. A., M. G. Thompson, E. Paintsil, M. Ricketts, J. Gedzior, and L. Alexander.2004. Competitive fitness of nevirapine-resistant human immu-nodeficiency virus type 1 mutants. J. Virol.78:603–611.
11.Daar, E. S., K. L. Kesler, T. Wrin, C. J. Petropoulo, M. Bates, A. Lail, N. S. Hellmann, E. Gomperts, and S. Donfield.2005. HIV-1 pol replication ca-pacity predicts disease progression. AIDS19:871–877.
12.Dang, Q., J. Chen, D. Unutmaz, J. M. Coffin, V. K. Pathak, D. Powell, V. N. KewalRamani, F. Maldarelli, and W. S. Hu.2004. Nonrandom HIV-1 in-fection and double inin-fection via direct and cell-mediated pathways. Proc. Natl. Acad. Sci. USA101:632–637.
13.Deeks, S. G., T. Wrin, T. Liegler, R. Hoh, M. Hayden, J. D. Barbour, N. S. Hellmann, C. J. Petropoulos, J. M. McCune, M. K. Hellerstein, and R. M. Grant. 2001. Virologic and immunologic consequences of discontinuing combination antiretroviral-drug therapy in HIV-infected patients with de-tectable viremia. N. Engl. J. Med.344:472–480.
14.Dykes, C., K. Fox, A. Lloyd, M. Chiulli, E. Morse, and L. M. Demeter.2001. Impact of clinical reverse transcriptase sequences on the replication capacity of HIV-1 drug-resistant mutants. Virology285:193–203.
15.Gerondelis, P., R. H. Archer, C. Palaniappan, R. C. Reichman, P. J. Fay, R. A. Bambara, and L. M. Demeter.1999. The P236L delavirdine-resistant human immunodeficiency virus type 1 mutant is replication defective and demonstrates alterations in both RNA 5⬘-end- and DNA 3⬘-end-directed RNase H activities. J. Virol.73:5803–5813.
16.Harrigan, P. R., S. Bloor, and B. A. Larder.1998. Relative replicative fitness of zidovudine-resistant human immunodeficiency virus type 1 isolates in vitro. J. Virol.72:3773–3778.
17.Hellmann, N. S., T. Wrin, M. Bates, R. Grant, C. Hicks, R. Haubrich, and C. J. Petropoulos.2002. Modeling the effect of HIV replication capacity on treatment outcomes. Abstr. 63. XI International HIV Drug Resistance Workshop, Seville, Spain.
18.Hu, W. S., and H. M. Temin.1990. Genetic consequences of packaging two RNA genomes in one retroviral particle: pseudodiploidy and high rate of genetic recombination. Proc. Natl. Acad. Sci. USA87:1556–1560. 19.Huang, W., A. Gamarnik, K. Limoli, C. J. Petropoulos, and J. M. Whitcomb.
2003. Amino acid substitutions at position 190 of human immunodeficiency virus type 1 reverse transcriptase increase susceptibility to delavirdine and impair virus replication. J. Virol.77:1512–1523.
20.Koval, C. E., C. Dykes, and L. M. Demeter.2004. Ex vivo replication fitness
of efavirenz-resistant mutants. Abstr. 640. 11th Conference on Retroviruses and Opportunistic Infections, San Francisco, Calif.
21.Levy, D. N., G. M. Aldrovandi, O. Kutsch, and G. M. Shaw.2004. Dynamics of HIV-1 recombination in its natural target cells. Proc. Natl. Acad. Sci. USA
101:4204–4209.
22.Lu, J., and D. R. Kuritzkes.2001. A novel recombinant marker virus assay for comparing the relative fitness of HIV-1 reverse transcriptase variants. J. Acquir. Immune Defic. Syndr.27:7–13.
23.Lu, J., P. Sista, F. Giguel, M. Greenberg, and D. R. Kuritzkes.2004. Relative replicative fitness of human immunodeficiency virus type 1 mutants resistant to enfuvirtide (T-20). J. Virol.78:4628–4637.
24.Lusso, P., F. Cocchi, C. Balotta, P. D. Markham, A. Louie, P. Farci, R. Pal, R. C. Gallo, and M. S. Reitz, Jr.1995. Growth of macrophage-tropic and primary human immunodeficiency virus type 1 (HIV-1) isolates in a unique CD4⫹T-cell clone (PM1): failure to downregulate CD4 and to interfere with cell-line-tropic HIV-1. J. Virol.69:3712–3720.
25.Maree, A. F., W. Keulen, C. A. Boucher, and R. J. De Boer.2000. Estimating relative fitness in viral competition experiments. J. Virol.74:11067–11072. 26.Martinez-Picado, J., A. V. Savara, L. Shi, L. Sutton, and R. T. D’Aquila.
2000. Fitness of human immunodeficiency virus type 1 protease inhibitor-selected single mutants. Virology275:318–322.
27.Martinez-Picado, J., A. V. Savara, L. Sutton, and R. T. D’Aquila.1999. Replicative fitness of protease inhibitor-resistant mutants of human immu-nodeficiency virus type 1. J. Virol.73:3744–3752.
28.Nijhuis, M., S. Deeks, and C. Boucher.2001. Implications of antiretroviral resistance on viral fitness. Curr. Opin. Infect. Dis.14:23–28.
29.Planelles, V., A. Haislip, E. S. Withers-Ward, S. A. Stewart, Y. Xie, N. P. Shah, and I. S. Chen.1995. A new reporter system for detection of retroviral infection. Gene Ther.2:369–376.
30.Prado, J. G., S. Franco, T. Matamoros, L. Ruiz, B. Clotet, L. Menendez-Arias, M. A. Martinez, and J. Martinez-Picado.2004. Relative replication fitness of multi-nucleoside analogue-resistant HIV-1 strains bearing a dipep-tide insertion in the fingers subdomain of the reverse transcriptase and mutations at codons 67 and 215. Virology326:103–112.
31.Quinones-Mateu, M. E., and E. J. Arts.2001. HIV-1 fitness: implications for drug resistance, disease progression, and global epidemic evolution. Los Alamos National Laboratory, Los Alamos, N.M.
32.Quinones-Mateu, M. E., S. C. Ball, A. J. Marozsan, V. S. Torre, J. L. Albright, G. Vanham, G. van Der Groen, R. L. Colebunders, and E. J. Arts.
2000. A dual infection/competition assay shows a correlation between ex vivo human immunodeficiency virus type 1 fitness and disease progression. J. Vi-rol.74:9222–9233.
33.Quinones-Mateu, M. E., M. Tadele, M. Parera, A. Mas, J. Weber, H. R. Rangel, B. Chakraborty, B. Clotet, E. Domingo, L. Menendez-Arias, and M. A. Martinez.2002. Insertions in the reverse transcriptase increase both drug resistance and viral fitness in a human immunodeficiency virus type 1 isolate harboring the multi-nucleoside reverse transcriptase inhibitor resis-tance 69 insertion complex mutation. J. Virol.76:10546–10552.
34.Ramos, A., D. J. Hu, L. Nguyen, K. O. Phan, S. Vanichseni, N. Promadej, K. Choopanya, M. Callahan, N. L. Young, J. McNicholl, T. D. Mastro, T. M. Folks, and S. Subbarao.2002. Intersubtype human immunodeficiency virus type 1 superinfection following seroconversion to primary infection in two injection drug users. J. Virol.76:7444–7452.
35.Renda, M. J., J. D. Rosenblatt, E. Klimatcheva, L. M. Demeter, R. A. Bambara, and V. Planelles.2001. Mutation of the methylated tRNA residue A58 disrupts reverse transcription and inhibits replication of human immu-nodeficiency virus type 1. J. Virol.75:9671–9678.
36.Sharma, P. L., and C. S. Crumpacker.1997. Attenuated replication of human immunodeficiency virus type 1 with a didanosine-selected reverse transcriptase mutation. J. Virol.71:8846–8851.
37.Sharma, P. L., V. Nurpeisov, K. Lee, S. Skaggs, C. A. Di San Filippo, and R. F. Schinazi.2004. Replication-dependent 65R3K reversion in human immuno-deficiency virus type 1 reverse transcriptase double mutant K65R⫹L74V. Vi-rology321:222–234.
38.Trkola, A., H. Kuster, C. Leemann, C. Ruprecht, B. Joos, A. Telenti, B. Hirschel, R. Weber, S. Bonhoeffer, and H. F. Gunthard.2003. Human im-munodeficiency virus type 1 fitness is a determining factor in viral rebound and set point in chronic infection. J. Virol.77:13146–13155.
39.Troyer, R. M., K. R. Collins, A. Abraha, E. Fraundorf, D. M. Moore, R. W. Krizan, Z. Toossi, R. L. Colebunders, M. A. Jensen, J. I. Mullins, G. Vanham, and E. J. Arts.2005. Changes in human immunodeficiency virus type 1 fitness and genetic diversity during disease progression. J. Virol.79:9006–9018. 40.Wang, J., C. Dykes, R. A. Domaoal, C. E. Koval, R. A. Bambara, and L. M.
Demeter.2006. The HIV-1 reverse transcriptase mutants G190S and G190A, which confer resistance to non-nucleoside reverse transcriptase inhibitors, demonstrate reductions in RNase H activity and DNA synthesis from tRNA(Lys, 3) that correlate with reductions in replication efficiency. Virol-ogy [Online.] http://www.sciencedirect.com/science/journal/00426822. 41.Wu, H., Y. Huang, C. Dykes, D. Liu, J. Ma, A. S. Perelson, and L. M.
Demeter.2006. Modeling and estimation of replication fitness of human immunodeficiency virus type 1 in vitro experiments by using a growth com-petition assay. J. Virol.80:2380–2389.
on May 16, 2020 by guest
http://jcm.asm.org/
0095-1137/07/$08.00⫹0 doi:10.1128/JCM.00821-07
ERRATUM
Evaluation of a Multiple-Cycle, Recombinant Virus, Growth Competition Assay
That Uses Flow Cytometry To Measure Replication Efficiency of Human
Immunodeficiency Virus Type 1 in Cell Culture
Carrie Dykes, Jiong Wang, Xia Jin, Vicente Planelles, Dong Sung An, Amanda Tallo, Yangxin Huang,
Hulin Wu, and Lisa M. Demeter
Department of Medicine, University of Rochester School of Medicine and Dentistry, Rochester, New York; Department of Pathology, University of Utah School of Medicine, Salt Lake City, Utah; Department of Hematology and Oncology, UCLA AIDS Institute,
Los Angeles, California; and Department of Biostatistics, University of Rochester School of Medicine and Dentistry, Rochester, New York
Volume 44, no. 6, p. 1930–1943, 2006. Page 1940, Table 2: Footnotefshould read as follows. “Only two clones had mutations
in p7 and p1. Patient 3 clone 4 had two mutations in p7: M17I and T21S. Patient 4 clone 3 had one mutation in p1: H9N.”