Analysis and Simulation of Factory Layout using
ARENA
Bobby John *, Jenson Joseph E
**Department of Mechanical Engineering, SCMS School of Engineering and Technology, Kerala, India
Abstract- Attempt is made to simulate the factory layout using the software ARENA (student’s version). Utilization of each machine is calculated. The efficiency of production depends on how well the various machines; production facilities and employee’s amenities are located in a plant. Only the properly laid out plant can ensure the smooth and rapid movement of material, from the raw material stage to the end product stage.
Index Terms- arena, simulation, layout utilization, KEL
I. INTRODUCTION
he paper presents solving an industrial problem using software. Here we use the software ARENA (student version) for the simulation purpose. A simulation study was under taken to find out the efficiencies of the machines in the industry. The main aim is to find out most efficient arrangement of machines in the machine shop. By the simulation we can see the individual movements from one machine to other. This paper tries to illustrate how the plant lay out problem can be solved using simulation technique. It also helps to think how the efficiency can be improved.
Extensive interviews and discussions are conducted withe engineers and top management of industry to get the clear idea of lay out of plant. A step wise analysis procedure is followed to reduce the complexity
II. LAYOUT OF INDUSTRY AND DATA COLLECTION
This study is based on the analysis of existing layout. The existing layout is analyzed. The arrangement of machines is
simulated using the software and efficiency of each machine is analyzed. Plant layout design is one of the basis of plants
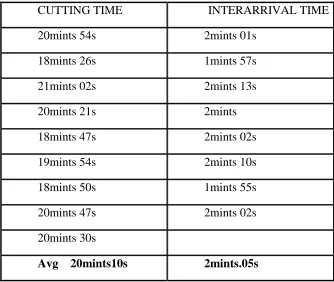
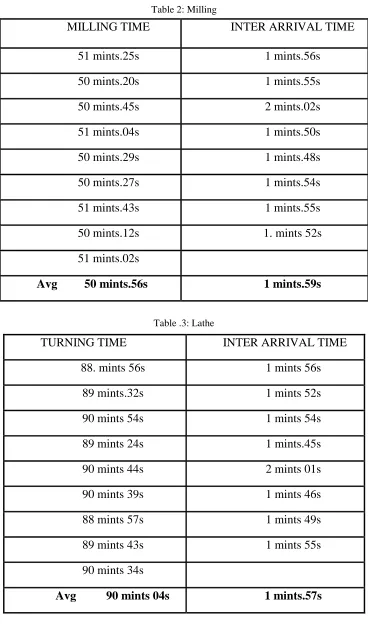
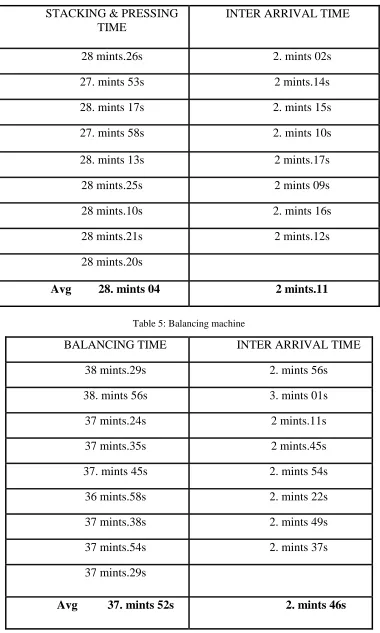
work efficiency. For the analysis using ARENA machining time of each machines are calculated and also the inter arrival
time is also noted using these data the material flow is simulated and machines with largest queue is found and also
efficiencies of different machines are found out.
The software ARENA is used for plant layout modeling. Different
process are represented by rectangular boxes, diamond boxes etc. The starting and ending are represented by pentagons.
These processes are connected by lines which show the flow of the product.
T
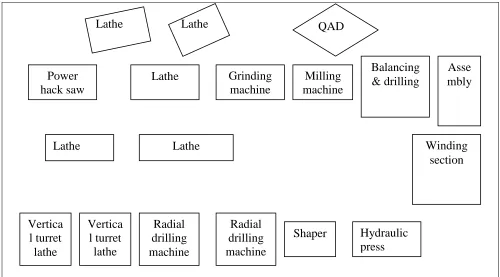
In KEL we conducted a work flow study of 4.5Kw shafts. The arrangement of the machines is not according to the flow of work. The layout of the machine shop is shown below
Figure 1:
Layout of New Machine ShopQAD- Quality Assurance Department
Power
hack saw
Lathe
Grinding
machine
Milling
machine
Balancing
& drilling
Lathe
Lathe
Lathe
Lathe
Vertica
l turret
lathe
Vertica
l turret
lathe
Radial
drilling
machine
Radial
drilling
machine
Shaper
Hydraulic
press
QAD
Winding
section
Figure2: Flow of 4.5 KW alternator shaft
[image:3.612.133.467.419.701.2]Data collection
Table 1: Power hack saw
CUTTING TIME
INTERARRIVAL TIME
20mints 54s
2mints 01s
18mints 26s
1mints 57s
21mints 02s
2mints 13s
20mints 21s
2mints
18mints 47s
2mints 02s
19mints 54s
2mints 10s
18mints 50s
1mints 55s
20mints 47s
2mints 02s
20mints 30s
Avg 20mints10s
2mints.05s
Power
hack saw
Lathe
Grinding
machine
Milling
machine
Balancing
& drilling
Stacking&
Hydraulic press
QAD
Table 2: Milling
Table .3: Lathe
MILLING TIME
INTER ARRIVAL TIME
51 mints.25s
1 mints.56s
50 mints.20s
1 mints.55s
50 mints.45s
2 mints.02s
51 mints.04s
1 mints.50s
50 mints.29s
1 mints.48s
50 mints.27s
1 mints.54s
51 mints.43s
1 mints.55s
50 mints.12s
1. mints 52s
51 mints.02s
Avg 50 mints.56s
1 mints.59s
TURNING TIME
INTER ARRIVAL TIME
88. mints 56s
1 mints 56s
89 mints.32s
1 mints 52s
90 mints 54s
1 mints 54s
89 mints 24s
1 mints.45s
90 mints 44s
2 mints 01s
90 mints 39s
1 mints 46s
88 mints 57s
1 mints 49s
89 mints 43s
1 mints 55s
90 mints 34s
Table 4: Hydraulic press
Table 5:Balancing machine
STACKING & PRESSING
TIME
INTER ARRIVAL TIME
28 mints.26s
2. mints 02s
27. mints 53s
2 mints.14s
28. mints 17s
2. mints 15s
27. mints 58s
2. mints 10s
28. mints 13s
2 mints.17s
28 mints.25s
2 mints 09s
28 mints.10s
2. mints 16s
28 mints.21s
2 mints.12s
28 mints.20s
Avg 28. mints 04
2 mints.11
BALANCING TIME
INTER ARRIVAL TIME
38 mints.29s
2. mints 56s
38. mints 56s
3. mints 01s
37 mints.24s
2 mints.11s
37 mints.35s
2 mints.45s
37. mints 45s
2. mints 54s
36 mints.58s
2. mints 22s
37 mints.38s
2. mints 49s
37 mints.54s
2. mints 37s
37 mints.29s
Using these data I simulated the current new machine shop layout of KEL Kundara in arena 10.0(student’s version). Arena is software used for visualizing the business. Here I simulated the shop lay out in arena student’s version and utilization of each machines are calculated
III. RESULTS AND DISCUSSION
The production efficiency depends on how well the various production facilities, employee’s amenities and, machines are located in a plant. Only the properly laid out plant can ensure the smooth and rapid movement of material, from the raw material stage to the end product stage. Plant layout study helps much in improvement in the existing layout.
The 4.5 kW shaft flow is simulated and the results are given below.
Figure3: simulation results
The
Figure5: simulation results
The utilization of the different machines is given above. The results show that out of these machines lathe has highest utilization 26% which is very low. All other machines have very low utilization
SUGGESTIONS
The following suggestions have been made to improve the utilization of the machines
There should be a change in the lay out to improve the utilization
There should much more advanced material handling system
Introduction of new machines may alleviate the problem
Multi skilled employees should be introduced to the organization
Introduction of CNC machines helps to improve plant lay out
Improved lay out design would help the company to reduce production cost
IV.CONCLUSION
The production efficiency depends on how well the various machines; production facilities and amenities are located in a plant. There should be an optimum relationship among the output, floor area and manufacturing process. KEL came into the field of the Alternator production by 1970’s .The company is tuned with modern technology. Products are marketed through all India network marketing and after sales service offices are located in all metropolitan cities. The major customer of the company is Indian railways.
Being a public sector company KEL has its own limitations. But when we analyze the organization, through the efficiency of work and the brand name they have created among their customers as well as competitors their work was more than that of a private sector company. This is one of the factors that make the organization in the lime light in this world of competition.
ACKNOWLEDGMENT
The authors would like to thank Mr.SreeKumar T KGeneral manager of Kerala Electricals and Allied Engineering Co Ltd (KEL ) Kundara Kollam India for their technical support and innovative guidance.
REFERENCES
[2] Anucha Watanapa, Phichit Kajondecha, Patcharee Duangpitakwong , and Wisitsree Wiyaratn, “Analysis Plant Layout Design for Effective Production,” IMECS2011March 16-18 2011Hong Kong .
[3] Emmanuel S. Eneyo, “A THE USE OF SIMULATION IN FACILITY LAYOUT DESIGN: A PRACTICAL CONSULTING EXPERIENCE,” Proceedings of the 1998 Winter Simulation Conference.
[4] N. Shariatzadeh, “Software Evaluation Criteria for Rapid Factory Layout Planning, Design and Simulation,” 45th CIRP Conference on Manufacturing Systems 2012 n., submitted for publication.
[5] Saifallah Benjafaar "NEXT GENERATION FACTORY LAYOUTS: RESEARCH CHALLENGES AND RECENT PROGRESS" December, 2000
AUTHORS First Author – Bobby John, graduated in Mechanical
Engineering from Kerala University, doing Post Graduate Student in Production & Industrial Engineering at SCMS School of Engineering and Technology, affiliated to Mahatma Gandhi University, Kerala, India, Email : [email protected].
Second Author –