Analysis of the Contribution of Partnership Strategy
to the Economic Development in Rwanda
Aimé Muyombano I. PhD Scholar*; Prof. Maurice M. SAKWA, PhD**, Dr. Jared DEYA, PhD ***; Prof. Eugene
Ndabaga, PhD****
* School of Development Studies and Communication, JKUAT, Nairobi-Rwanda **Senior Lecturer and COD Development Studies, JKUAT, Nairobi-Kenya *** Lecturer School of Development Studies and Communication, JKUAT, Nairobi-Kenya
**** Senior Lecturer School of Education, University of Rwanda, Kigali-Rwanda"
DOI: 10.29322/IJSRP.8.5.2018.p7745 http://dx.doi.org/10.29322/IJSRP.8.5.2018.p7745
Abstract- The aim of the study was to analyses contribution of Rwanda Partnership Strategy to its Economic Development, from 2000 up to 2015; The study was guided by the following specific objectives: to demonstrate the contribution of Technical partnership on economic development in Rwanda; to assess the contribution of Financial partnership on economic development and lastly to determine the contribution of common market partnership on economic development in Rwanda. Both qualitative and quantitative research approaches were used. Data were collected by means of interviews, observational schedules, and documentary analysis procedures. The number of questionnaires, administered to all the respondents was 82. A total of 81 questionnaires were properly filled and returned from the Institutions employees. This represented an overall successful response rate of 98.8%. The study found that majority of respondents (49.4% strongly agreed, 48.1% agreed) supported the idea that Technical and Financial Partnership with different countries in terms of investing in infrastructures and services (Financial services, Banks & Insurances) raise the access of Rwandan exports to foreign markets. The findings also revealed that majority of respondents have affirmed that Technical& financial partnership (assistance, Aid tourism contribute to the wealth creation. Among 81 respondents, 78 or 96.3% (53.1% strongly agreed and 43.2% agreed) agreed that it contribute on wealth creation. The findings showed that from 80 responses 77 or 96.25% supported the idea (38 strongly agree and 39 agree) that Common market through free movement of goods, services, People, capital, residence is increasing GDP per capita and Balance of Trade by allow foreigners in the Regional invest in Country and vice-versa.
Index Terms- Technical Partnership; Financial Partnership and common market
I. INTRODUCTION
istorical perspective, Partnerships have a long history, they were already in use in Medieval times in Europe and in the Middle East; In Europe, the partnerships contributed to the Commercial Revolution which started in the 13th century, Laiou,
E. (2008). In the 15th, century the cities member of the Hanseatic League, would mutually strengthen each other; a ship from Hamburg to Danzig, would not only carry its own cargo but was also commissioned to transport freight for other members of the league that the practice was not only saved time and money; but also constituted a first step toward partnership. This capacity to join forces in reciprocal services became a distinctive feature, and a long lasting success factor, of the hanseatic team spirit, (ibid 2008)
According to Coispeau, O. (2015). A close examination of medieval trade in Europe shows that numerous significant credit based trades were not bearing interest. Hence, pragmatism and common sense called for a fair compensation for the risk of lending money, and a compensation for the opportunity cost of lending money without using it for other fruitful purposes. In the Middle East, the Qirad and Mudarabas institutions developed when trade with the Levant, namely the Ottoman Empire and the Muslim Near East, flourished and when early trading companies, contracts, bills of exchange and long-distance international trade were established.
At the Continental, regional historical and theoretical perspective of African states was awash with the phenomenon of seeking political independence for the purpose of achieving all socio-economic development of the continent; the initiative is anchored on the determination of Africans to extricate themselves and the continent from the malaise of underdevelopment and exclusion in a globalizing world; it is a call for a new relationship of partnership between Africa and the international community to overcome the development chasm, Cyril I. Obi (2001).
which specifically recommended establishment of African regional integration which currently targeting to achieve the socio-economic development of Africa through African Union umbrella, (ibid, 2013).
For Diana C. et al. (2007) demonstrated how the East African Community as region started with Kenya, Tanzania, and Uganda by applied the partnership each other since the early 20th century; The customs union between Kenya and Uganda in 1917, which Tanganyika joined in 1927, followed by the East African High Commission (EAHC) from 1948 to 1961, the East African Common Services Organization (EACSO) from 1961 to 1967, and the 1967 to 1977 EAC. Burundi and Rwanda joined the EAC on 6 July 2009 and now South Sudan
The East African Community established a customs union in 2005 which was fully fledged with zero internal tariffs as in were made in action in 2010. In 2013 East African Community members signed a protocol on the monetary union, (Ombeni N. 2015) these advantages provide them with a unique framework for regional co-operation and integration. Within this situation, the EAC offers many benefits to its Partner States including: increased trade, expanded markets, attraction of Foreign Direct Investment (FDI), increased bargaining power, strengthened security and conflict resolution in the region, and the free movement of people across the region
Supachai P. et al. (2012), Rwanda has come from far over the past 18 years. It has established a stable government, secured peace and safety in its territory, made great strides in restoring and reforming the economy and in 2010 was named by the World Bank as the world’s top reformer because of good partnership established with rest of the world affairs; It has also articulated an inspiring vision of its future (Vision 2020) that sees the country reaching middle-income status over the next eight years and positioning itself as a high quality hub for an increasingly integrated region, the East African community (EAC). Rwanda has shown that it has the will power and determination to reach this. While still a poor country, it has come a very long way in just over a decade, (ibid. 2012).
Her technical &financial partnership as a country is based on mutual cooperation supporting technical, financial partnership with others and Common market partnership under regional partnership which has evolved through a period of economic prosperity and macroeconomic stability in the past two decades; Real GDP grew by an average of 8% annually during the period 2000 to 2013, which is among the highest average growth rates in East Africa and currently is one of few countries anywhere in the world that has managed fast economic growth, robust reductions in poverty, and a narrowing of inequality based on the mutual partnership with the rest of the world, (Ombeni N. 2015) A number of studies including one by the, (2015), demonstrates that Rwanda’s foreign policy strategies such as strengthening her partnership, Regional & global relations and wealth creation don’t have a lot of influence on the growth of national economic development even though, imports have risen sharply since 2004, largely as result of the cumulate the costs of importing different products fuel and energy included.
A number of studies including one by Minicofin, (2006), demonstrates that the Government of Rwanda receives a large volume of technical &financial assistance (partnerships), much of it in the form of experts appointed on both short- and long-term contracts which normally are supposed to build the national capacity. Really, it became a criticised for failing to transfer those technical &financial partnership capacity.
Founding on this enthusiastic perception specified by Rwandan Government on which her technical &financial assistance (partnerships) should improve her economic development. The researcher found that there is still a critical gaps on demonstrating the contribution of Rwanda’ Foreign policy strategies which one the researcher’ supposition opinion settled that only 30% of the population can describe the huge contribution is conveying by the Rwanda’s foreign policy strategies on the economic development in Rwanda which is totally different to the assumption provided by the researcher on the what community think is the contribution. Through this gaps exemplified, the researcher decided to carry out a study with title “Analyse the contribution of Foreign policy strategies on Economic Development in Rwanda”, Ministry of Foreign Affairs, Cooperation and East Africa Community.
II. LITERATURE REVIEWS
This study is built on the underpinning theories and models, including the Technical Partnership theory by Rornald W. Mc Quaid (2000); Mastering Finance Business Partnering model by KPMG et al, (2011) and common market, the political economy of international factor mobility in a multi−country setting Giovanni Facchini: (2002)
2.1 Theoretical and empirical framework 2.1.1 Theoretical Framework
2.1.1.1 Technical Partnership theory by Rornald W. Mc Quaid (2000),
The technical partnerships theory developed by Rornald W. Mc Quaid (2000), with the purpose of promote cooperation between Industrialized Countries or developed Sphere and developing countries or regeneration that should increase their National economic development. There are a number of assumptions underlying design the technical partnership component.
2.1.1.1.1 Data-Driven Partnership through Open States model
Figure 2.1: Data-Driven Partnership through Open States
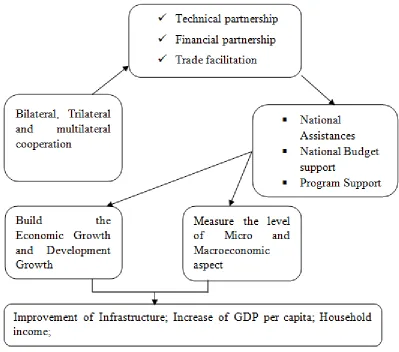
Martha, B. et al. (2010) demonstrates that Strengthening bilateral, trilateral and multilateral partnership is one of the strategies that should assist the cooperation between countries in term of International trade and investment for one hand but also technical and financial support which back the economic development of those countries by increasing the community’ GDP per capita, household income, Infrastructure and so on. This model illustrates how government should determine in advance, if a relationship is one that will result in competitive advantage and is worthy of the time and resources needed to fully develop into a partnership. Further, all partnerships are not
2.1.1.1.2 The Sustainability of Community Coalitions technical Partnership Model.
Figure 2.2: Developing a Conceptual Framework to Assess the Sustainability of Community Coalitions, (2008) Post-Federal Funding. USA HH&NORC, (2008) Take look
on the National economic development perspective, Sellgren, (1990) describes partnership as a scheme with involvement or funding from more than one agency, he adds that the joint objectives of the bodies and states partnership as co-operation between actors where they agree to work together towards a specified economic development objective and draw the key distinction between generalized policy communities that develop a broad National or local vision for the area or local economy and the specific networks (or partnerships) that are necessary to support individual projects
2.1.1.2. Mastering Finance Business Partnering model by KPMG et al, (2011)
According to KPMG et al, (2011), the recent economic turmoil left most companies exposed to heightened commercial and financial risks. This ‘wrong-footed’ many finance teams, leading them to re-evaluate their role. At the same time, tough economic conditions, volatile markets and intense competitive
pressures provide a real opportunity for finance teams to step up their influence, bringing benefits to the whole business. The 2009 ‘Thriving Not Just Surviving’1 survey found 82% of CFOs were working to improve how their team challenges and supports the business twice the number who gave this response in 2006. There is a link between strong company performance and the way Finance works with the rest of the organisation. In ‘Thriving Not Just Surviving’, when we asked CFOs about their team’s influence, a greater proportion of high-performing than lower-performing organisations reported high levels of influence in all functional areas of the business. ‘Finance Business Partnering’ is increasingly viewed as the most effective way for in-house finance teams to add value. Some high performing firms already fully embrace business partnering - in finance, HR and other functional areas - and some elements of partnering are seen in many companies.
Source: Finance Effectiveness Benchmark Report 2017 Technology has been changing finance. Cloud, robotics
process automation, and analytics are all now widely used as part of a company’s digital transformation.
But technology alone won’t get you the transformation you need. Not without a plan for how it should also change your organization and the demands on your people. Finance leaders are facing this challenge now as they shift their organizations from transactional processing and toward business partnering. In our seventh finance benchmarking report, we mine the practices of the world's finance functions and draw on in-depth benchmarking studies we have performed for nearly 600 finance organizations around the globe so you can learn from the best of them.
2.1.1.3. Common market, the political economy of international factor mobility in a multi country setting Giovanni Facchini: (2002)
Understanding the workings of Preferential Trading Arrangements (PTA’s) has become increasingly important, since a very large proportion of the world’s more than 200 nations has undertaken economic integration projects, and a vast literature has emerged. Both normative questions like “under which
conditions is a preferential trading arrangement welfare improving?”
o As well as positive questions like “Under which conditions will a Free Trade Area emerge as a result of a given political process?”
o Have been addressed, and attention has also been dedicated to the potential effects of regional trading arrangements on the multilateral trading system. o So far the research effort has been focused on analysing
free trade areas or customs unions, but the recent experience of the most successful PTA, the European Union, calls for new research on the way the integration process deepens, moving beyond commercial liberalization. In particular, surprisingly little has been said on what is behind the decision of a group of countries to bilaterally liberalize factor flows, and this paper represents a first attempt at answering this question.
o
Figure 2.2: The Wealth Creation Model, Wealth Building 101 Steps The model demonstrates the importance of the wealth
creation on Economic development of a community in terms of Building wealth with goal which is also very broad. When planned to work with a wealth manager initiate, there should drill down and examine the end game on a granular level. With the model, there is recognized the Transformation and Education way that can be used to create wealth in a determine community by considering the national savings which increase the national investment and offer as a result to the economic growth normally which attract the Foreign Direct Investment (FDI).
2.1.2 Empirical review
Different Knowledge and results derived from investigation, observation, experimentation, or experience done by different researches on similar work with partnership strategy (Technical partnership, financial partnership, common market partnership) as opposed to theoretical knowledge based on logical or mathematical assumptions were based on which push the researcher to provide his addition.
2.1.2.1 The contribution of technical partnership on economic development in Rwanda
In terms of the number of technical partnership, the patterns have remained largely similar to those observed in the 2014/15 fiscal year. A large number of projects have been registered by the UN system represented by 7 agencies reported to DAD-Rwanda, including One UN Fund, IFAD and GEF. The US has been traditionally reporting at the program level hence a small number have been recorded under the category “number of projects”.
IMF (2008), demonstrates that technical partnership Rwanda has experienced strong trade performance with exports growing at an average of 12.5 % per year since 2001 (Appendix
Figure 2). Rwanda’s exports reached an estimated US$152 million in 2006, more than twice the receipts generated in 2002. Coffee, tourism and tea have fuelled this growth, accounting for 60% of the 2005 export numbers. Besides private Sector mobilisation, an important driver of export growth has been the restructuring of front agencies (OCIR-Café, OCIR-Thé, ORTPN), RIEPA (Rwanda Investment and Export Promotion Agency) and BRD. While this performance is short of desired targets, it provides evidence that Rwanda can generate growth when informed choices and timely action are made on specific export industries
Minicofin (2017), demonstrates how technical partnership contributes to the implementation of an inclusive poverty-reducing growth model of the country, which has yielded, inter alia, a stable average economic growth rate of 8-9% on average, reduced the poverty rate from 60.4% in 2011 to 39.1% in 2014 (1). Additionally, improved governance, better management of public finances, a strengthened private sector and an enhanced investment climate has led to the continuous growth of foreign private investments over the past decade, complementing public resources for development.
Figure2.3 Rwanda GDP growth 2.1.2.2 The contribution of financial partnership on economic
development in Rwanda.
Minicofin (2017), the development finance to Rwanda was also supplemented by flows originated from non-public entities and private philanthropic foundations, which disbursed US$ 10.1 million in 2015/16 fiscal year. Considering the above, the total amount of external development finance flown to Rwanda in 2015/16 fiscal year was US$ 1,479.6 million, of which US$ 984.9 million from public sources (ODA and NTA) and US$ 494.7 million from private sources, including FDIs, overseas remittances, non-public organizations. The share of ODA in total development resource has decreased, while private flows FDI and overseas remittances have significantly increased in the past decade, reaching 22.0% and 11.0% of the total respectively, as opposed to less than 6% each in 2006. Flows from non-traditional sources, originated primarily from Arab Development Funds, China and India made up 3.5% of the total development finance provided to Rwanda in 2015. In a nutshell, the ODA currently makes up 63%, and beyond-ODA flows 37% of total external development finance, the latter largely represented by private capital. Compared to 2006, when the proportion was 89% vs 11%, this undoubtedly depicts a distinctive change in the external development finance landscape.
UNDP (2015), Rwanda met most of the Millennium Development Goals (MDGs) by the end of 2015. Strong economic growth was accompanied by substantial improvements in living standards, with a two-thirds drop in child mortality and near-universal primary school enrolment. A strong focus on homegrown policies and initiatives has contributed to significant improvement in access to services and human development indicators. The poverty rate dropped from 44% in 2011 to 39% in 2014, while inequality measured by the Gini coefficient fell from 0.49 to 0.45.
The Government of Rwanda was determined her partnership strategy which assisted on the increasing of 23% of her Gross Domestic Product; This amounted as an addition of $55 per capita, compared with an average that use to have in Sub-Saharan Africa of approximately $25 per capita in 2008; and
assistance accounts for more than half of the Government of Rwanda’s annual budgets and aid’ shaped by principles defined in Millennium Development Goals (MDGs), Sustainable Development Goals (SDGs), the Monterrey Consensus, the Rome Declaration on Harmonization and the Paris Declaration on Aid Effectiveness, Ownership, Harmonisation, Alignment, Results and Mutual Accountability.
ODA inflows to Rwanda have been on steady rise from 2006 to 2011, exceeding US$ 1 billion in 2011, reduced notably in the following 2 years and restored to pre-2012 level in 2014. The researcher thinks that the underlying elite bargain is robust and more inclusive than many believe, maintaining it against the natural tendencies that associate with ‘limited access orders’ produces casualties of various kinds, Frederick, G. et al. (2013), the benefits of regional and global relation economic integration strategy should depend on the level of economic integration and the deeper the integration, the greater the benefits to the participating of the Partner States.
As for Ombeni, N.M.(2010), the measures taken to ease border crossing for East Africans include issuance of inter-state passes which commenced on 2003; a single immigration Departure/Entry card which has been adopted by the partner states; harmonization of the procedures of work permits and the classification process which has been finalized; and the studies on the harmonization of Labour Laws and Employment Policies which were identified as the main tools which increased a lot on Rwanda economic development as element of partnership; These include the Lake Victoria Development Programme, the East African Road Network Project, East African Power Master Plan and other high profile infrastructure projects that are at various stages of implementation, (Ombeni, N., M.2010).
world that some lessons was used to support regional and global relation strategy to be achieved.
Generally, Rwanda’s increasing profile in its foreign relations implies that the nation has regained its role as a leading player in multilateral politics and diplomacy. It can be said
therefore that during the period (covering 2006-2015) Rwanda’s foreign policy has improved over time with creation of wealth in the domestic economic environment.
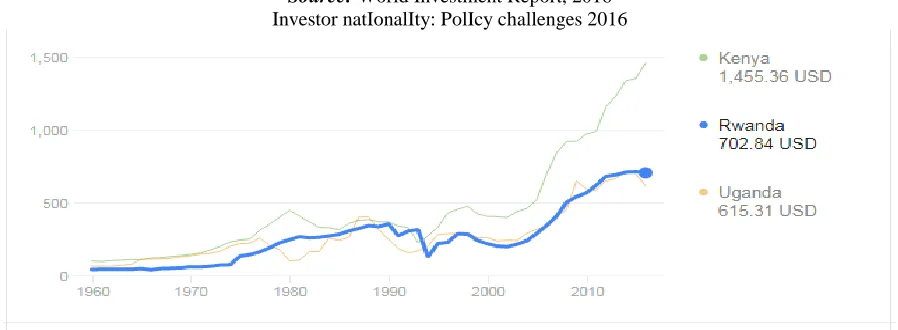
[image:8.612.81.530.281.446.2]Figure2. 4 Increasing of Rwanda GDP Source: World Investment Report, 2016 Investor natIonalIty: PolIcy challenges 2016
Figure 2. 5 GDP per capita comparison Source: Mineacom report. 2015
Rwanda’s exports to the world affairs such as United States of America, German, United Kingdom and other that have been growing steadily over the past 10 years, with an annual average growth rate of 21% and he total trade of Rwanda at the global affairs amounted to $60 million in 2015, with exports to the USA valued at around $46 million, while imports were only $14m down from $21m in 2014, (Mineacom report. 2015).
The largest export was coffee at over $23 million. Others were minerals ($17.8 million), pyrethrum ($2.1 million) and a range of smaller value exports, (ibid, 2015).
2.1.2.3 The contribution of Common market on economic Development in Rwanda
According to The Ministry of Public Service policy (2007), in 2003, the real Gross Domestic Product growth rate was 0.9% compared to 9.4% for 2002 and estimated at 4% for 2004. After exceeding 10% before 2000, the investment rate by providing the wealth creation started declining until it was less than 10% in the same period of before 2000. One of the explanations for this situation is the persistence of negative levels of domestic savings
and the reduction of the flow of foreign aid, considering that investment is greatly dependent on foreign aid.
The value of services exports in the same year was $144 million and that of imports $277 million, which represented 4 per cent and 8 per cent of Gross Domestic Product respectively, leading to a $133 million deficit in services trade. The trade deficit has been increasing drastically and shows no signs of slowing down. The government indicates that the widening trade deficit as a percentage of Gross Domestic Product grew from 8 per cent in 2001 to 12 per cent in 2006. Services exports’ share in global services exports was 0.005 per cent while services imports’ share in global trade was 0.009 per cent. By encouraging foreign direct investors on wealth creation, Rwandan Economy sustained high growth: average year-on year real Gross Domestic Product Growth rate from 2007-2011; stable inflation and exchange rate well managed; 3 years Gross Domestic Product growth rate was one of the highest among major African economies and neighboring countries, (ICES SC- RDB Report. 2014)
0 200 400 600 800
Table 2.0.1: East Africa community comparison table
No EAC countries 2011 2012 2013 2014 Mean in 4 years
01 Rwanda 7.9 8.8 4.7 7.0 28.4/4=7.1
02 Kenya 6.1 4.6 5.7 5.3 21.7/4=5.4
03 Uganda 9.7 4.4 3.3 4.8 22.2/4=5.6
04 Tanzania 7.9 5.1 7.3 7.0 27.3/4=6.8
05 Burundi 4.2 4.0 4.6 4.7 17.5/4=4.4
06 South Sudan -4.6 -46.1 13.1 3.4 -37.7/4=-9.4
Source: East Africa community comparison, 2015
With Global Competitiveness Report (2012), Investor friendly climate in Rwanda was characterized by official ranking given to Rwanda according to the effort country is using which affect it as 2nd best global reformer 2012; most competitive place to do business in east Africa countries and 3rd in Africa. As the Global Competitiveness Report (2012) continue mentioning, Rwanda was ranked as a 2nd most reformed country in the world'; 3rd most competitive place to do business in Africa'; 1st Most competitive place to do business in East African Community region; 8th easiest place to start a business; 6hrs to register business; 19th easiest place to pay taxes worldwide.
A market assessment that was conducted revealed the demand for extending the network to a total number of 7,300 Public and Private Institutions in all administrative sectors of Rwanda that would be connected to the broadband backbone network(government offices, schools, hospitals, churches,
International Development and no-governmental organization, Embassies and High Commissions accredited with residence in Rwanda as well as Multinational, transnational and Regional Corporate, (ibid 2012).
The Rwandan foreign policy has been developed in response to Rwanda’s rise in
According to National bank of Rwanda Report (2015), with strengthening and broadening the participation and involvement of Rwanda Foreign policy, the Gross Fixed Capital Formation in Rwanda decreased to 342 Billion RwF in 2015 from 343 Billion in 2014. This Gross Fixed Capital Formation in Rwanda decrease had had an average of 316.69 Billion RwF from 1999 until 2015, reaching an all-time high of 804 Billion RwF in 2010 and a record low of 128 Billion RwF in 1999.
2.2 Models on the best practices 2.2.1 Conceptual framework
2.2.1.1 Derivation of Conceptual Framework
A lot of empirical evidence can be found in the literature that foreign policy strategies contributes on economic development in Rwanda by rising different strategies such as technical Partnership; Financial Partnership and Common market partnership which should support on the implementation to achieve the economic development in Rwanda. The conceptual framework illustrates that foreign policy strategies indeed affect economic development of a country.
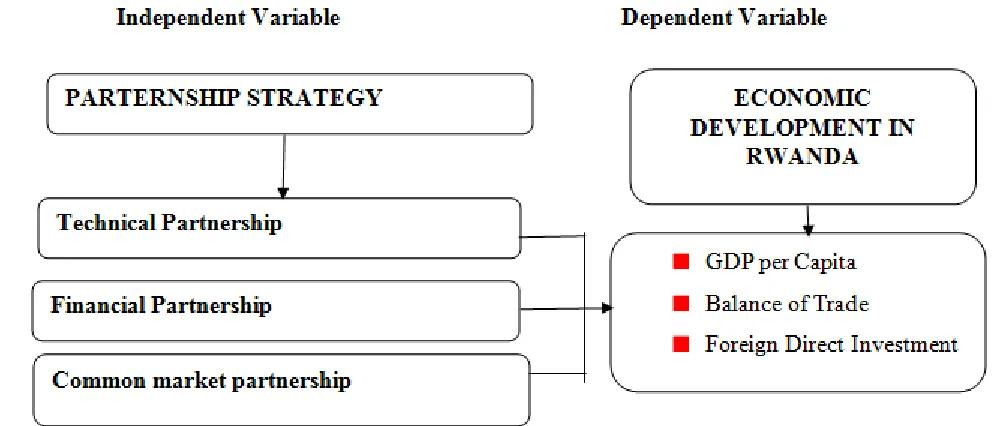
[image:9.612.53.550.402.615.2]
Figure 2.6: Derivation of Conceptual Framework, 2017
The conceptual framework gives an overview of the types of the research variables that play a role in the research. the independent variables which is Foreign Policy Strategies are also referred to as manipulation variables deal with all theories and practices related to Foreign Policy strategies such as technical Partnership; Financial Partnership and Common market partnership which affect direct the dependent variables (economic development in Rwanda) with tangible economic
development such as GDP per capita, Balance of trade and Foreign Direct Investment.
For the overall view of the study, the research will identify how these variables interact to each other and how they contribute on the economic development in Rwanda.
This model was used several time by Robert M. Solow (2009), demonstrated how the Economic Growth proceeded from the effects of exporter sector performance and was added by saying that using the function of aggregate production as a starting point should increase a lot on the measures of the sources of Economic Development.
These models were modified and specified as follow: GDP = f (BOT, , FDI,)
Y= α0+ α1BOT+ + α3FDI Where:
i. Y: Gross Domestic Product per capita (GDP)
ii. { α i; i=1,2,} = The coefficients for the various independent variables
iii. BOT: Balance of Trade iv. FDI: Foreign direct investment
III. MATERIALS AND METHODS
The ethnicity variable in this study was based on the sample of the population working in Public and Private Institutions with daily activities in foreign policy. The study also had a sample of Single Institutions. The participation in the study was voluntary and anonymous; The research designs of this study was applied Qualitative research paradigm as a systematic subject approach used to describe the Profitability, Capital adequacy, Asset quality, Liquidity and Risk management through specific approach which was a Case study that described in-depth
the experience of one or more than one Public and Private Institutions with method of direct observation and interaction on the subject.
In the findings it was established that Partnership strategy, Regional and Global relations strategy and Wealth creation strategy can have a significant contribution on economic development in Rwanda. Different Data have been obtained from officials of the Public and Private Institutions from 16 from 30 Cooperatives, 11 from MINICOM, 13 from MINICOFIN, 7 from Internationals NGOs, 10 from Rwanda Local NGOs, 3 from Rwanda Civil Society Platform, 6 from Multinational and Transnational Corporate (investors), and 16 from 30 District Mayors which given 82.
In practice different tools have been used to support gears component with the following activities such as Selection of sample techniques, Develop research instruments questionnaires, Collection of data (the research has been used both primary and secondary data), data was Processed (using SPSS software which assisted on process) and analysis, interpretation and recommendations have been determined by the researcher.
3.1 Research approach
3.1.1 Qualitative versus quantitative research approach of 462 from 30 Rwanda Cooperatives, Ministry of Trade, Industry, Ministry of Finance and Planning, Internationals NGOs, Rwanda Local NGOs, Rwanda Civil Society Platform Multinational and Transnational Corporate (investors) and 30
District Mayors
Source: Secondary data, 2017
3.1.2 Proportional stratified sample size:
The proportional stratified sample size means that, the number of sampling units drawn from each stratum is in the proportion to the relative population size of that stratum.
A sample size of 82 was used on this study after a simplified formula calculated the said sample sizes according to Yamane (1967) which provided a simplified formula as its bellow.
𝒏 = 𝑵
[image:10.612.112.588.425.583.2]𝟏 + 𝑵(𝒆𝟐)
Table 3.2: Stratum sample size
Stratified random sampling is a method of sampling that involves the division of a population into smaller groups known as strata. In stratified random sampling, the strata are formed based on members' shared attributes or characteristics. A random sample from each stratum is taken in a number proportional to the stratum's size when compared to the population. These subsets of the strata are then pooled to form a random sample. Where n is the sample size, N is the population size, and e is the level of precision 10% for our study
Thus, 𝑛 = 462
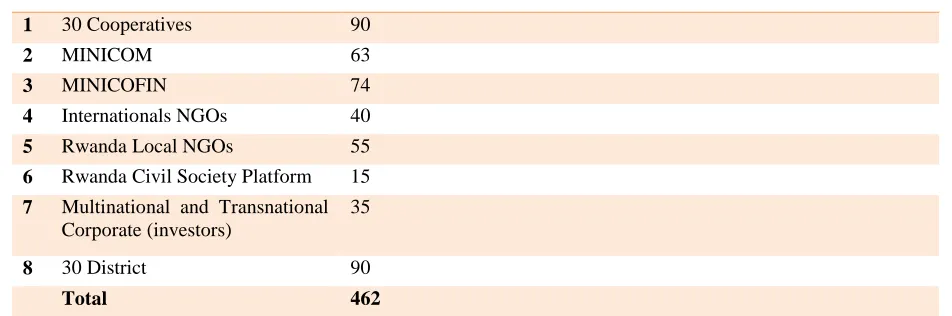
1+462(0.1)2≞ 82 N Stratum composition Nh(the population size for stratum h)
1 30 Cooperatives 90
2 MINICOM 63
3 MINICOFIN 74
4 Internationals NGOs 40
5 Rwanda Local NGOs 55
6 Rwanda Civil Society Platform 15 7 Multinational and Transnational
Corporate (investors)
35
8 30 District 90
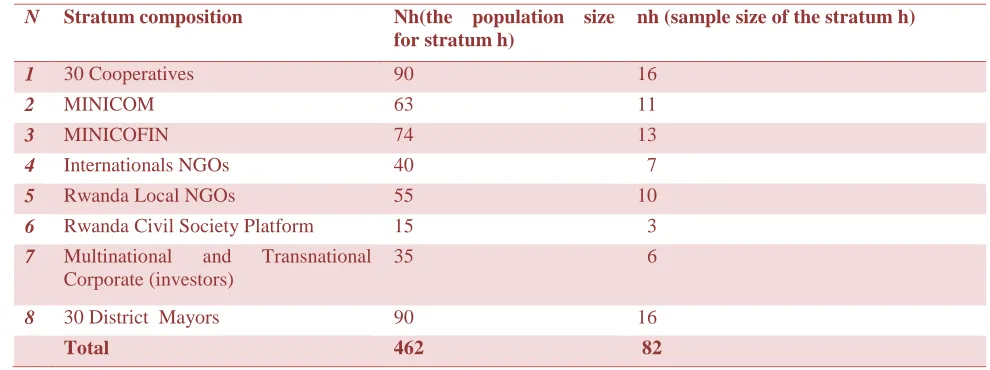
As Yamane (1967) added, The proportional stratified sample size means that, the number of sampling units drawn from each
[image:11.612.56.551.110.295.2]stratum is in the proportion to the relative population size of that stratum
Table 3.3 Proportional stratified sample size is determined by the following formula:
Source: Secondary data, 2017
A sampling frame facilitates formation of a sampling unit that refers to one member of a set of entities being studied, which is the material source of the random variable (Bailey, R. A. 2008). Common examples of a unit would be a single person, animal, plant, or manufactured item that belongs to a larger collection of such entities being studied. For the purpose of this study, the sampling frame for the target population should be all 81 selected officials from 30 Cooperatives, MINICOM, MINICOFIN, Internationals NGOs, Rwanda Local NGOs, Rwanda Civil Society Platform, Multinational and Transnational
Corporate (investors) and 30 District A Stratified random sampling methodology was employed
since 82 Official individuals from different Institution working in the Country was selected using Yamane (1967) formula at the research that will be conducted on the impact of economic analysis on project implementation selected from total of 413 population working in different Public-Private Institutions
3.1.3 Data Collection Instruments
The researcher collected primary and secondary data. Primary data was collected using structured questionnaires designed to find answers from respondents and are comprising closed and open questions to seek specific answers on the variables under study. While secondary data was collected through consultation of different documents as registration book, monitoring books, Reports and Experts status books all from Public-Private Institutions
3.1.3.1 Data Validity
In order for a questionnaire to be useful, the data it produces must be truthful, a researcher must know that the results are meaningful and can be applied more generally than to just the sample tested. Proving the credibility of the questionnaire and ensuring that the resulting data reflect the “truth”. For validation of data during this research, questionnaire will be
consulted by experts and professors who understanding well the topic, their opinions was taken into considerations and collections was made until their satisfactory level before questionnaires are distributed to the site.
Use the following formula, using the total number of experts (N) and the number who rated the object as essential (E): CVT = [(E - (N / 2)) / (N / 2)]
3.1.3.2 Data Reliability
A researcher confirmed the reliability of data collected using a test/retest technics meaning that repeatability of measurement where a person's score on the same test given twice is similar. Conclusion validity was used to confirm if there is connection between the Foreign Policies strategies and Rwandan economic development. The inter-rater reliability coefficient is often calculated as a Kappa statistic. The formula for inter-rater reliability Kappa is this:
K=𝑃𝑜𝑏𝑠𝑒𝑟𝑣𝑒𝑑−𝑃𝑐ℎ𝑎𝑛𝑐𝑒
1−𝑃𝑐ℎ𝑎𝑛𝑐𝑒
In this formula, P observed is the observed percentage of agreement.
3.1.4 Data Processing and Analysis
According to Zikmund G.W., et al. (2010), data analysis refers to the application of reasoning to understand the data that will be gathering with the aim of determine the consistent patterns and summarizing the relevant details revealed in the investigation. To determine the patterns revealed in the data that was collected regarding the selected variables, data analysis will be guided by the objectives of the research and the measurement of the data collected. Information will sort, code and input into the statistical package for social sciences (SPSS) for production of graphs, tables, descriptive statistics and inferential statistics.
N Stratum composition Nh(the population size for stratum h)
nh (sample size of the stratum h)
1 30 Cooperatives 90 16
2 MINICOM 63 11
3 MINICOFIN 74 13
4 Internationals NGOs 40 7
5 Rwanda Local NGOs 55 10
6 Rwanda Civil Society Platform 15 3
7 Multinational and Transnational Corporate (investors)
35 6
8 30 District Mayors 90 16
The above model was helped the Researcher to tests the causal relationship between Gross Domestic Product and independents variables such as: Balance of trade, balance of payment, total foreign aid, foreign direct investment, Human Development Index for Rwanda and movements of people.
IV. RESULTS, ARGUMENT, CONCLUSION AND RECOMMENDATIONS
The Facts and critical analysis done after collection of data by scholars on cases well identified with the purpose of provide
the clarification on the objectives determined either by the scholars or any one from the private or public and come up with findings to be based on any measurement resolution
4.1 Results and Arguments 4.1.1 Response Rate
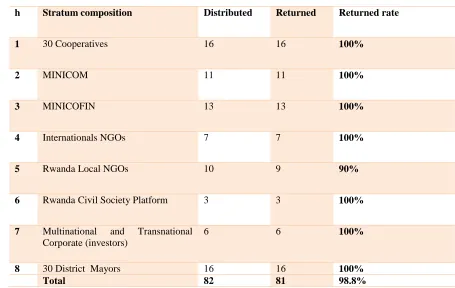
[image:12.612.74.529.217.505.2]The number of questionnaires, administered to all the respondents, was 82. A total of 81 questionnaires were properly filled and returned from the Institutions employees.
Table 4.4: Response Rate
h Stratum composition Distributed Returned Returned rate
1 30 Cooperatives 16 16 100%
2 MINICOM 11 11 100%
3 MINICOFIN 13 13 100%
4 Internationals NGOs 7 7 100%
5 Rwanda Local NGOs 10 9 90%
6 Rwanda Civil Society Platform 3 3 100%
7 Multinational and Transnational Corporate (investors)
6 6 100%
8 30 District Mayors 16 16 100%
Total 82 81 98.8%
Source: Primary data, 2017
This represented an overall successful response rate of 98.8%. According to Mugenda (2003), a response rate of 50% or more is adequate. Babbie (2004) also asserted that return rates of 50% are acceptable to analyse and publish, 60% is good and 70% is very good.
4.2 Demographic information
This section presents the demographic characteristics such as gender, level of education, year worked in the Organizations or Institutions size of the organization and years of Institutions and organization’ existence consult
4.2.1 Gender of the Respondents
Figure 4 .1: Gender of the Respondents Source: Primary data, 2017
4.2.2 Level of Education
Respondents’ qualifications varied greatly. Although most employees had University level qualifications, 32 (39.5%), the study recorded 27 postgraduate level respondents (33.3%), 12 respondents with college level (or 14.8%) and 10 respondents with secondary level (or 12.3%).
[image:13.612.82.528.61.161.2]Figure 4.3 indicates that the majority of respondents had reached university level that could contribute to accurate responses.
Figure 4 2: Level of Education Source: Primary data, 2017
4.2.3 Years Worked in the Institution or Organization
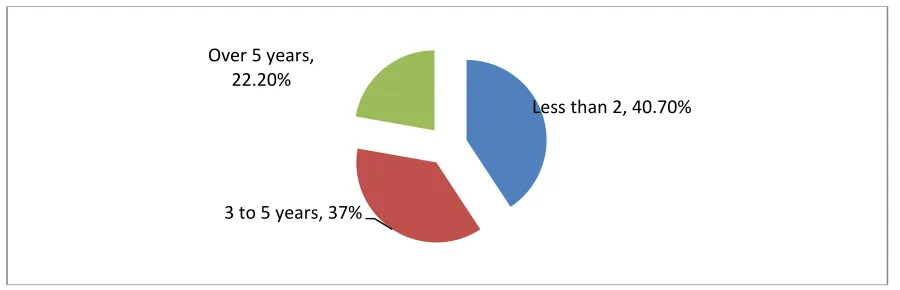
[image:13.612.87.527.288.449.2]The researcher to present experience/duration distribution categories of the respondents used frequency tabulation. Table 4.4 below presents the results:
Figure 4 3: Working experience in Institution Source: Primary data, 2017
Secondary level, 12.30%
College level, 14.80%
University level, 39.50% Post graduate level,
33.30%
Less than 2, 40.70%
3 to 5 years, 37% Over 5 years,
[image:13.612.82.532.522.667.2]The study sought to find out the years the respondents had worked in the organization. The figure 4.3 shows that 40.70% of respondents indicated that they had worked for less than 2 years while 37% indicated between 3 to 5 years and 22.2% indicated over 5 years. The findings imply that the respondents had worked
This implies that majority of respondents at least are experienced with at least three or more years in institution (37%+22.2%=59.3%). Those with low experience estimated to two years or less were not ignored (40.7%).
4.2.4 Years of working experience
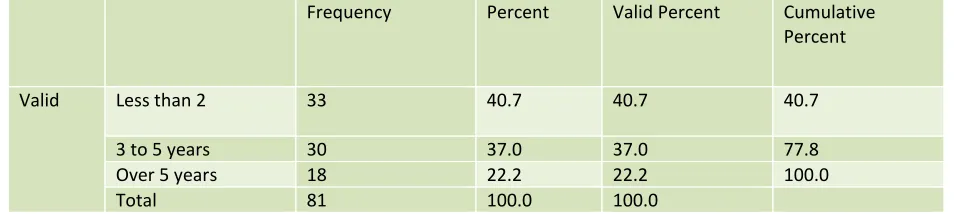
[image:14.612.68.545.208.315.2]During the research, we were interested in working experience to view if the responses were valid and could contribute to the research objectives. The following table gives us the picture.
Table 4.5. Working experience in Institution
Frequency Percent Valid Percent Cumulative
Percent
Valid Less than 2 33 40.7 40.7 40.7
3 to 5 years 30 37.0 37.0 77.8
Over 5 years 18 22.2 22.2 100.0
Total 81 100.0 100.0
Source: Primary data, 2017
[image:14.612.71.542.417.513.2]From table 4.2 above, 40% of the respondents have less than 2 years of working experience, 37% have 3 to 5 years, 22.2% have over 5 years. This implies that majority of respondents are less experienced in their institutions or organization.
Table 4.6 Type of Institution
Frequency Percent Valid Percent Cumulative Percent
Valid public 51 63.0 63.0 63.0
Private 28 34.6 34.6 97.5
NGOs 1 1.2 1.2 98.8
Both public-Private 1 1.2 1.2 100.0
Total 81 100.0 100.0
Source: Primary data, 2017
From table 4.3 above, 63.0% of respondents were from public institution, 34.6% were from private sector, and 1.2% were from NGOs and Both public-Private institutions separately.
Table 4.7 Life of institutions
Frequency Percent Valid Percent Cumulative Percent
Valid 1 to 5 years 19 23.5 23.5 23.5
6 to 10 years 17 21.0 21.0 44.4
11 to 15 years 8 9.9 9.9 54.3
Over 15 years 37 45.7 45.7 100.0
Total 81 100.0 100.0
[image:14.612.67.546.584.696.2]The results from table 4.4 indicates that 45.7% of respondents approved that their organization or institutions have been in operation over 15 years, 23.5% between 1 to 5 years, 21% between 6 to 10 years and 9.9% between 11 to 15 years.
4.2.5 Institution’ contribution to the Rwanda’s Partnership strategy
[image:15.612.63.546.170.286.2]The researcher wanted to know the respondents views to the contribution of their working institution in the Partnership strategy implementation. This shows also the dispersion of the sector and different knowledge from different sources.
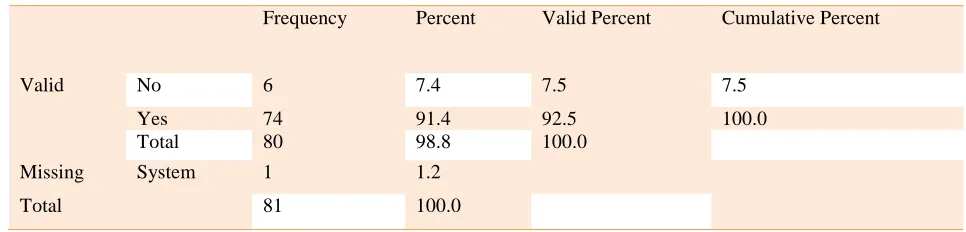
Table 4.8 Does your Organisation or Institution works with one of these strategies of Rwanda’s Foreign Policy which are technical partnership, Technical partnership, and common market partnership?
Frequency Percent Valid Percent Cumulative Percent
Valid No 6 7.4 7.5 7.5
Yes 74 91.4 92.5 100.0
Total 80 98.8 100.0
Missing System 1 1.2
Total 81 100.0
Source: Primary data, 2017
The findings from table 4.5 show that 91.4% of Respondents said that their institutions work closely with the Rwanda’s foreign policy, and only 7.4% said their Institutions are not contribute to the implementation of the foreign policy while only one respondents did not say nothing. This gives the researcher, a picture that the majority of respondents consider the contribution of their respective institutions in the implementation of the Foreign Policy.
Table 4.9 If yes how your institution contribute on the economic development of Rwanda Frequency Percent Valid Percent Cumulative Percent
Valid Attracting foreign investors
26 32.1 32.1 32.1
Promote Bilateral and multilateral cooperation
6 7.4 7.4 39.5
Facilitating trade 21 25.9 25.9 65.4
Equipping students with relevant skills
4 4.9 4.9 70.4
Improving export promotion
24 29.6 29.6 100.0
Total 81 100.0 100.0
Source: Primary data, 2017
The results from table 4.6 reveal that 26 from 81 respondents equivalent to 32.1% confirmed that their institution contribute on the economic development of Rwanda through Attracting foreign investors, 24 equivalent to 29.6% through Improving export promotion, 21 respondents equivalent to 25.9% through Facilitating trade, 7.4% through promoting Bilateral and multilateral cooperation, and 4.9% through equipping students with relevant skills.
4.2.6 Perceptions and attitudes towards the contribution of technical partnership between Rwanda and the rest of the world This section aim to establish the views of respondents to the contribution of partnership strategy on increasing the economic development of Rwanda. The tables below show the respondents perspectives to the strategy.
4.2.6.1 Contribution of Rwanda foreign strategy to her economy
Respondents were asked whether Rwandan foreign strategy was contributed to her economy.
[image:15.612.70.543.387.539.2]As illustrated in the table below, respondents have shown their perception of Rwanda foreign strategy contribution to the technical and financial contribution to the economy. All respondents support that Rwanda foreign strategy contributes to the financial and technical cooperation between countries and international organs.
Table 4.10 The Technical, Financial bilateral and multilateral cooperation between Rwanda and world have a positive influence on Rwanda GDP
Frequency Percent Valid Percent Cumulative Percent
Valid Strongly agree 43 53.1 53.1 53.1
Agree 38 46.9 46.9 100.0
Total 81 100.0 100.0
Source: Primary data, 2017
Among 81 respondents, 53.1% strongly supported and 46.9% supported the idea of technical and financial cooperation between countries and organs. There was any disagree in the responses.
4.2.7 Investments contribution to raise Rwanda exports partnership
[image:16.612.64.540.361.469.2]For the case of rising Rwanda exports partnership from the investments interviewers were shown their views regarding the contribution of foreign strategy to the exports growth.
Table 4.11 Partnership with countries in terms of trade and investment raise the access of Rwandan exports to foreign markets
Frequency Percent Valid Percent Cumulative Percent
Valid Strongly agree
40 49.4 49.4 49.4
Agree 39 48.1 48.1 97.5
Disagree 2 2.5 2.5 100.0
Total 81 100.0 100.0
Source: Primary data, 2017
From the table above, 79/81 of respondents agreed that this strategy contribute to the export growth of Rwanda and only two respondents challenges the foreign strategy to do not contribute to the export growth. Those two respondents said that it is not contributing because Rwanda still importing more than what it is exporting abroad.
4.2.8 Perception on the Rwandan development vis a vis the foreign strategy
Respondents perception to the Rwandan development vis a vis the bilateral and multilateral partnership were to classify their views on the issue. Their responses were summarized in the table below.
Table 4.12 Development through bilateral and multilateral affect positively the economic development of Rwanda community by providing necessary
Frequency Percent Valid Percent Cumulative
Percent
Valid Strongly agree 33 40.7 40.7 40.7
Agree 43 53.1 53.1 93.8
Disagree 5 6.2 6.2 100.0
Total 81 100.0 100.0
[image:16.612.77.539.620.723.2]93.8% of all respondent agreed (strongly agree and Agree) that bilateral and multilateral cooperation contribution was one of the sources of economic development of the country. While other 6.2% disagreed that, the cooperation did not contribute to the Rwandan development. The 6.2%’s perception was that collaborating with neighboring countries like DRC and Burundi could not develop a country.
4.2.8 Perception on the Rwandan unemployment status vis a vis the foreign strategy
[image:17.612.23.583.181.296.2]zRespondents perception to the Rwandan unemployment status vis a vis the bilateral and multilateral partnership were to classify their views on the issue. Their responses were summarized in the table below.
Table 4.13 Partnerships decrease number of unemployment and opened a free movement system
Frequency Percent Valid Percent Cumulative Percent
Valid 1 1.2 1.2 1.2
Strongly agree 36 44.4 44.4 45.7
Agree 37 45.7 45.7 91.4
Disagree 6 7.4 7.4 98.8
Strongly disagree 1 1.2 1.2 100.0
Total 81 100.0 100.0
Source: Primary data, 2017
Among 81 respondents, 80 responds and one not respond. In addition, from the responds 73 or agreed (Strongly agree were 36 and agree were 37) and 7 disagreed (6 disagree and 1 strongly disagree). This shows that majority of respondents supported that partnership help in decrease of number of unemployment and opened movement system where Rwandans should move with their capital, their goods and services even working abroad by importing and exporting and business experiences that affect passively the economic development of Rwanda.
4.2.9 Other factors of partnership strategy contributively on Rwanda economy
[image:17.612.68.548.452.628.2]During the research, respondents have given some factors, which could contribute on the economic development of a country. Some of them have grouped in seven main economic sectors:
Table 4.14 Factors of partnership used by institution that contribute to Rwanda development Frequency Percent Valid Percent Cumulative
Percent Valid Regional and global
cooperation
16 19.8 19.8 19.8
Facilitating trade 13 16.0 16.0 35.8
Facilitating foreign investors 11 13.6 13.6 49.4
Free movement promotion 9 11.1 11.1 60.5
Made in Rwanda promotion 12 14.8 14.8 75.3
increase investment in infrastructure
10 12.3 12.3 87.7
Peace keeping 6 7.4 7.4 95.1
Skills transfers 4 4.9 4.9 100.0
Total 81 100.0 100.0
Source: Primary data, 2017
4.2.10 Perceptions and attitudes towards the contribution of collaborating with Financial partnership to the economic development in Rwanda
This section focuses on the results of the research on the contribution of regional and global relations strategy on the economic development of Rwanda. Respondents have shown their views on the importance of Rwanda for being a member on the international or regional organs.
4.2.10.1 Trust to the international view
[image:18.612.81.533.217.325.2]Rwanda to be a dignity country, trusted and capable to govern and develop its economic is the main social scene, which shows the performance of a country economy. Effort to make peace through direct negotiations, to collaborate in tripartite trade and being respective country has been shows to enhance the economic growth. The respondents given their views on the view of international trust of Rwanda.
Table 4.15 Being a member encourage international community to trust Rwanda Frequency Percent Valid Percent Cumulative
Percent
Valid Strongly agree 40 49.4 49.4 49.4
Agree 38 46.9 46.9 96.3
Disagree 3 3.7 3.7 100.0
Total 81 100.0 100.0
Source: Primary data, 2017
Table 4.12. Shows the factor that respondents view the trust of international and regional organs to Rwanda to which it could and is important player in multilateral system. Among 81 respondents 78 or 96.3% (strongly agree 49.4% and agree 46.9%) agreed that being a member in different organs bring trust to the country being categorized as an important player in multilateral system. Other 3 or 3.7% disagree that being member in different international or regional organs could bring trust to the country.
4.2.10.2 Relationship with financial partnership increase the economic development in Rwanda
This question in brought to check the perception of respondents to the importance of being part in regional and international organs.
Table 4.16 Financial partnership values support free movement of goods, services, people, capital, residence is increasing GDP, life expectancy, literacy and level of employment
Frequency Percent Valid Percent Cumulative Percent
Valid 1 1.2 1.2 1.2
Strongly agree 38 46.9 46.9 48.1
Agree 39 48.1 48.1 96.3
Disagree 3 3.7 3.7 100.0
Total 81 100.0 100.0
Source: Primary data, 2017
Among 81 respondents, 80 have given their views and one not say anything. From 80 responses 77 or 96.25% supported, the idea (strongly agree 38 and agree 39). While 3 or 3.75% of them disagree that being part of regional or global organs could increase the wealth of Rwandan. This shows that Rwanda growth from 2000 until now is growing. And for sure the partnership strategy has play a big role.
4.2.10.3 being a member of financial group to Rwanda extend trade territory
Table 4.17 Regional bloc active membership enables Rwanda to extend trade territory Frequency Percent Valid Percent Cumulative Percent
Valid 2 2.5 2.5 2.5
Strongly agree 34 42.0 42.0 44.4
Agree 44 54.3 54.3 98.8
Strongly disagree 1 1.2 1.2 100.0
Total 81 100.0 100.0
Source: Primary data, 2017
Viewing the data presented in the table above, among 81 responds, only 79 responds to the question and two did not. 77 or 97.5% (Strongly agree 34 and 44 agree) agreed that adherence of Rwanda in regional block extend trade territory and has increase the Rwanda trade and two respondents did not recognize its impact on Rwanda trade.
This shows that the adherence of Rwanda to the regional blocs was significantly extend our trade and then has contribute on the economic growth of the country.
4.2.10.4 Rwanda partnership with peace, security and stability
Partnership is crucial for maintaining and promotion of peace and sustainable development. This can be only achieved through collective efforts. As we are all aware, our world has never been free from crises arising from multiple causes. During this research, we wanted to check the perception of our respondents on their view for being member of Rwanda in different organs on the issue of security and stability. Table below summarize their view.
Table4.18 Rwanda adherence on common market is very crucial on promoting peace, security and stability
Source: Primary data, 2017
Among 81 respondents, 79 respond to the question and two did not. From those 77 or 97.5% (37 strongly agree and 40 agree) agreed that Rwanda adherence on regional/global organs had promoted peace, security and stability while other two responds or 2.5 % disagreed that it did. Drawing on the data Respondents had recognized the impact of being part in regional and international organs to the peace, security and stability of a country.
4.2.10.5 Impact of common market organs to the Rwanda economic growth
Regional integration is a complicated progress. Economic growth rates that are not large enough to counteract the negative effects of global economic meltdowns leave many developing countries greatly exposed and this can result to great suffering for a majority people. For economies that are heavily reliant on a few commodity exports of homogeneous nature, the need to come up with long term macroeconomic policies aimed at diversification of their exports through development frameworks that pay close attention to increase investment and new technologies cannot be overemphasized. From this concept, the researcher wanted to see the views of respondents to the impact of those regional/global organs to the Rwandan economic growth.
Table 4.19 Is common market contribute to Rwanda economic development? Frequency Percent Valid Percent Cumulative Percent
Valid Yes 80 98.8 100.0 100.0
Missing System 1 1.2
Total 81 100.0
Source: Primary data, 2017
Frequency Percent Valid Percent Cumulative Percent
Valid 2 2.5 2.5 2.5
Strongly agree 37 45.7 45.7 48.1
Agree 40 49.4 49.4 97.5
Disagree 2 2.5 2.5 100.0
[image:19.612.76.536.608.700.2]From the table above, among 81 questioned, 80 respond and only one did not. All respondents 80 or 100% affirmed that being a member in different organs had contribute to the Rwanda economic growth.
4.2.10.6 Investment of foreign partners in achieving Rwanda visions
[image:20.612.67.542.183.279.2]Rwanda’s long-term development goals are defined in vision 2020 a strategy that seeks to transform the country from a low-income agriculture based economy to a knowledge based, service oriented and economy with middle-low-income country status by 2020. In other to achieve this, the private sector has to play a bigger role in ensuring economic growth. Investment relies heavily on foreign and domestic parts.
Table 4.20 Vision 2020 can be achieved through increasing in investment with foreign partners
Frequency Percent Valid Percent Cumulative Percent
Valid 1 1.2 1.2 1.2
Strongly agree 46 56.8 56.8 58.0
Agree 33 40.7 40.7 98.8
Disagree 1 1.2 1.2 100.0
Total 81 100.0 100.0
Source: Primary data, 2017
Among 81 respondents, 80 respond to the question and one did not. From those, 79 or 98.75% (46 strongly agree and 33 agree) agreed that Rwanda could achieve the vision by increasing investments from foreign partners other one respond or 1.25 % disagreed that it did. This shows that even Rwanda development players’ institutions recognize the role of foreign partners in the development of a country like Rwanda.
4.2.10.7 Free movement to common market
Developing countries today compete to motivate free movement to common market to their local economic area. Rwanda government has created an environment conductive to investment, to attract both local and foreign investment finance. The investment and tourism sector have been the main investment area that Rwanda has shown to be invested in. The respondents asked to give us their opinions to their views on their promotion to the wealth creation in Rwanda.
Table 4.21 Free movement of goods, services, capital and residences supported by the strategy of integration under common market
Frequency Percent Valid Percent Cumulative Percent Valid Strongly agree 43 53.1 53.1 53.1
Agree 35 43.2 43.2 96.3 Disagree 3 3.7 3.7 100.0 Total 81 100.0 100.0
Source: Primary data, 2017
The table above shows that the majority of respondents have affirmed that FDI and tourism contribute to the wealth creation. Among 81 respondents, 78 or 96.3% (53.1% strongly agreed and 43.2% agreed) agreed that it contribute while other three or 3.7 % disagreed their impacts on wealth creation.
[image:20.612.71.538.460.574.2]Table 4.22 The transfer of knowledge, skills and talent improve domestic productions and its innovation in the regional
Frequency Percent Valid Percent
Valid Strongly agree 49 60.5 60.5 Agree 32 39.5 39.5 Total 81 100.0 100.0
Source: Primary data, 2017
[image:21.612.68.547.256.440.2]The results from table indicates that 60.5% of respondents strongly agreed that the transfer of knowledge, skills and talent improve domestic productions and its innovation, 39.5 agreed.
Table 4.23 Factors common market has to increase for the economic development
Economic Sector Selected frequency
Goods 63
services 74
capital 80
migratory 78
residence 52
Health 41
Education 59
Source: Primary data, 2017
The Rwandan party leadership has to look at the several sector of economic to attract partnership involve in. Our respondents choose to shows the area that mainly need partnership to be developed. In the table above, respondents choose mainly industry (80 votes), capital (78 votes), residence (74 votes), goods (63 votes), education (59 votes), Services (52 votes0 and health (41 votes) to be enforced in development of our country.
GDP Per Capita Balance of
Trade
Foreign Direct Investment
GDP Per Capita Pearson Correlation 1 .199 .870**
Sig. (1-tailed) .230 .000
N 16 16 16
Balance of Trade Pearson Correlation .199 1 .139
Sig. (1-tailed) .230 .304
N 16 16 16
Foreign Direct
Investment
Pearson Correlation .870** .139 1
Sig. (1-tailed) .000 .304
N 16 16 16
Source: Survey data, 2017
Per Capita and Balance of Trade r=0.199. We therefore conclude that for each of the 16 year considered there is evidence that GDP per capita are related to FDI inflows with (r= 0.87). The number -0.139 reveals that, there is no multicollinearity between Balance of Trade and foreign Direct Investment.
Table 4.24 Model Summary
Model R R Square Adjusted R Square Std. Error of the Estimate
1 .874a .763 .727 100.07120
Source: Secondary data, 2017
After identifying the positive relationship from correlation analysis, comes the analysis of the strength of the relationship. With (R2=0.727) implies that the variations in the GDP per capita are explained by the variations in the FDI inflows and BOT by 73% and the remaining 27% variations in GDP per capita are explained by other factors than the FDI and BOT, thus, a positive relationship. The adjusted R Square indicates that we have a good model.
Model Unstandardized Coefficients Standardized
Coefficients
t Sig.
B Std. Error Beta
1 (Constant) 303.283 36.275 8.361 .000
Balance of Trade .046 .078 .080 .585 .569
Foreign Direct
Investment
1.034 .164 .859 6.305 .000
Source: Survey data, 2017
The regression equation to describe the data is as follows: Y=303.283+0.046BOT+1.034FDI
The results from table 4.23 show that as Balance of Trade increases 1 unit GDP per Capita will increase 0.046 US and as Foreign Direct Investment increases 1 unit GDP per Capita will increase 1.034US. The number 303.283 indicates the value of Y when Balance of Trade and Foreign Direct Investment are assumed to be zero.
V. SUMMARY, CONCLUSIONS AND RECOMMENDATIONS 5.1 Summary of the Findings
The general objective of the study was to assess the contribution of Foreign Policy strategies on economic development in Rwanda. One of the key findings was that different institutions were concerned with economic development of Rwanda. The contribution proved by the extent of agreement with the statements in the questionnaire. The findings indicated that majority of respondents agreed that partnership with countries in terms of trade and investment raise the access of Rwandan exports to foreign markets.
5.1.1 Contribution of partnership strategy on Rwandan economic development
The first objective of the study was to demonstrate the contribution of partnership strategy on Rwandan economic development. The Results showed that Partnership with different countries in terms of trade and investment raise the access of Rwandan exports to foreign markets by removing barriers to trade and providing necessary infrastructure and finance which motivate Rwandans to increase their production and importing abroad vis versa that increase the individuals Gross Domestic Product per capita, life expectancy, Literacy and levels of employment, Infrastructure, Personal dignity and Freedom of
association. The results from 4.23 showed that, the increase of balance of trade to one unit would increase GDP per Capita 0.046 US. It is clear that balance of trade has an insignificant relationship with GDP per Capita because P-value=0.569>0.05).
5.1.2. Contribution of regional and global relations strategy on Rwandan economic development
The second objective of the study was to assess the contribution of regional and global relations strategy on Rwandan economic development. The Results indicate that Being member of Regional Integration, Intra-Africa cooperation and multilateral organization which Rwanda is actively contributing and making her as an important player in multilateral system which encourage the International community (UN, AU, EU, EAC, ECCAS, ICGLR, AIMS, TWAS…) to trust Rwanda as peaceful, secure and stable for hosting International occasions and is affecting positively her economic development. 100% of respondents affirmed that being a member in different organs had contributed to the Rwanda economic growth
5.1.3 Contribution of wealth creation strategy on Rwanda economic development