*Author for correspondence
755
A NEW EAR RECOGNITION METHOD BASED ON FUSION
HARRIS AND SIFT
1XU CHAO
,
2,*TIAN YING
1,2
College of Software, University of Science and Technology Liaoning, Anshan 114051, China
E-mail: [email protected]
ABSTRACT
Ear recognition is an emerging biometric technology. This paper proposes a new ear recognition method based on SIFT(Scale-invariant feature transform) and Harris corner detection. Firstly, Harris corner points and SIFT keypoints are detected respectively. Then taking Harris corner into the SIFT algorithm to calculate their descriptor as the image feature vectors. Finally the feature vectors are classified by the Euclidean distance, in order to improve recognition rate, two-way match is utilized. Experiments on USTB database show that the recognition rate reaches more 95%. The results prove the effectiveness of the proposed method in term of recognition accuracy in comparison with previous methods.
Keywords: Ear Recognition, SIFT, Harris
1. INTRODUCTION
As a branch of the biometric identification, ear recognition has received much more attention in recent years. Human ears have rich and stable structure that is preserved from childhood into old age. Ear recognition has the advantages of easy acquiring data, easy to accept, low-cost equipment, and it does not suffer from changes in facial
expression, aging, psychological factors or
cosmetics[1]. Meanwhile, human ears have smaller the image size and then have a small amount of data processing, have more consistent color distribution. Ear recognition is becoming a hot research.
In recent research, according to the extracted
features, ear recognition method can be
summarized in two categories[2], the method based on the algebraic features[3-5] and the method based on structural features[6-7]. 1) Based on the algebraic features: Victor B et al. proposed base on Principal Component Analysis (PCA) for the human ear recognition[8]. Thereafter Dasari et al. proposed Kernel principal component analysis (KPCA) method to extract algebraic features of the human ear, and using the Support Vector Machine for the identification, achieved a recognition rate higher than the PCA method[9]. The Kocaman B et
al. used respectively, Principal Component
Analysis (PCA) and discriminative common vector analysis (DCVA), Fisher Linear Discriminative
Analysis(LDA) and Locality Preserving
Projections(LPP) method were used for ear recognition[10]. 2) Based on the structural features: These methods by finding the key points of the contour and the internal structure of the human ear, to build the structural features. For example Choras
M proposed geometry-based feature points
extraction method [11]. Hurley et al. proposed to extract the structural characteristics of the force field transformation theory of the human ear [12]. The principle is that the pixel in the image of the human ear as a Gaussian attractor, which the human ear image is converted to a force field. Bustard et al. proposed the ear recognition method based on SIFT features[13].
2. THE EAR RECOGNITION BASED ON SIFT DESCRIPTOR
SIFT is a local feature descriptors proposed by David Lowe in 1999, and has more in-depth development and perfection in 2004[14-15]. Even
If there are translation, rotation, affine
756
depth rotation -30°~+30° of the human ear image,
[image:2.612.323.528.66.241.2]recognition rate is only 40% and 34%. The reason is: 1) The shape and structure of ear Image is very simple. It has small changes in gradient and a relatively small amount of information per unit area. SIFT can only find a small number of SIFT keypoint. Figure 1 is from the human ear image database, resolution is 300 × 400 pixels, but using SIFT transformation only can find 12 stable SIFT keypoints after the experiment, the average number of two ear images can match using SIFT points only two and is very unstable, it can result in the recognition fails easily. 2) SIFT feature points is a stable point after the Gaussian convolution, but after a depth rotation, SIFT keypoints of the ear image will be overwritten and the value of the neighborhood will change, so the SIFT feature vector will vary greatly.
Figure 1: The Result Of Use SIFT Algorithm To Extract The SIFT Feature Points
3. THE EAR RECOGNITION METHOD BASED ON FUSION HARRIS AND SIFT
In order to overcome the problem of low recognition rate for depth rotate the image for ear recognition based on SIFT. Corner detection method based on image structure is fused into the SIFT algorithm. After theoretical research and experimental, the Harris corner detection method was finalized to be used[17]. The reasons are 1)Harris algorithm is simple and easy to implement , easy to operate, fast calculation. 2)Feature points are evenly spread throughout the given area, can reflect the structure of the image, have strong stability for image rotation, noise, grayscale change and viewpoint transformation[18].
[image:2.612.338.548.306.532.2]Detection to the ear image using Harris corner operator is shown in Figure 2.
Figure 2: Harris operator to the ear image corner detection
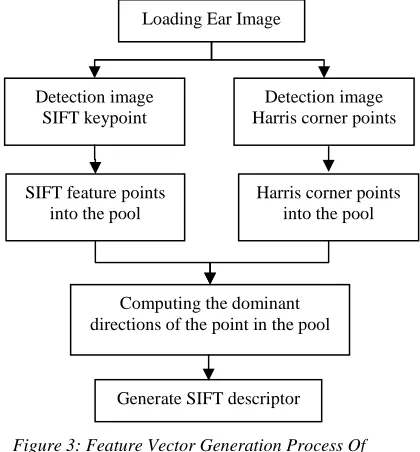
Combining Harris algorithm and SIFT for image feature vector generation process is shown in Figure 3:
Figure 3: Feature Vector Generation Process Of Harris-SIFT
The steps of fusion Harris and SIFT algorithm is:
1) Detection image SIFT keypoints
Under a variety of reasonable assumptions the only possible scale-space kernel is the Gaussian function. Therefore, the scale space of an image is
defined as a function, L(x,y,σ), that is produced from the convolution of a variable-scale Gaussian,
) , ,
(x y σ
G , with an input image, I(x, y):
)
,
(
)
,
(
)
,
,
(
x
y
G
x
y
I
x
y
L
σ
=
σ
∗
where * is the convolution operation, G(x,y,σ)
is a variable-scale Gaussian, Detection image
SIFT keypoint
Loading Ear Image
SIFT feature points into the pool
Detection image Harris corner points
Harris corner points into the pool
Computing the dominant directions of the point in the pool
[image:2.612.145.251.327.474.2]757
2 ) (
2
/
2
2
1
)
,
,
(
2 2σ
πσ
σ
x ye
y
x
G
=
− +To efficiently detect stable keypoint locations in scale space, it is required to using scale-space extrema in the difference-of-Gaussian function
convolved with the image, D(x,y,σ):
) , , ( ) , , ( ) , ( )) , , ( ) , , ( ( ) , , ( σ σ σ σ σ y x L k y x L y x I y x G k y x G y x D − = ∗ − =
2)Detection image Harris corner points
First of all compute the directional derivative of the image, then calculate the local autocorrelation matrix for each point:
2
2
( , ) * ( , ) ( , )* ( , )
( , ) ( , )* ( , ) * lx x y W ly x y lx x y W u x y
lx x y ly x y W ly x y W
=
3)Computing the dominant directions:
By assigning a consistent orientation to each keypoint based on local image properties, the keypoint descriptor can be represented relative to this orientation and therefore achieve invariance to image rotation. The scale of the keypoint is used to select the Gaussian smoothed image, L, with the closest scale, so that all computations are performed in a scale-invariant manner. For each image sample, L(x, y), at this scale, the gradient
magnitude, m(x, y), and orientation, θ(x, y), is
precomputed using pixel differences:
2 2 )) 1 , ( ) 1 , ( ( )) , 1 ( ) , 1 ( ( ) , ( − − + + − − +
= Lx y LX Y LXY l XY y x m
)))
,
1
(
)
,
1
(
(
/
)
1
,
(
)
1
,
(
((
2
tan
)
,
(
y
x
L
y
x
L
y
x
L
y
x
L
y
x
−
−
+
−
−
+
=
α
θ
4) The local image descriptor
In order to achieve rotation invariance, the coordinates of the descriptor and the gradient orientations are rotated relative to the keypoint
orientation. The keypoint to take the 8 × 8 window. computing the eight directions of the gradient direction histogram in each 4 × 4 small pieces on the demarcation of the accumulated value for each gradient direction, to form a descriptor array. In actual calculation process, in order to improve the robustness of matching feature points to be described on the use of 4×4 descriptor array, you can get the 128 data in one keypoint, eventually form a 128-dimensional SIFT feature vector.
5) Matching
After the descriptor of the image keypoints are obtained, it begins to matching. An ear image is matched by individually comparing each feature from the ear image to this previous database and finding candidate matching features based on Euclidean distance of their feature vectors. In order to reduce the mismatch of the keypoints, we controll comparative experiment using two-way
matching[19]. SUM(col1∩col2), where the col1 is
the set of points matching procedure from training image to target image, and the col2 is the set of points matching procedure from target image to training image.
4. EXPERIMENTS RESULTS AND DISCUSSION
The experiments with the proposed method are
accomplished on the ear database of USTB Ⅱ
(University of Science and Technology Beijing). The database consists of 308 ear images of 77 individuals, the four images per person, with a resolution of 300×400 pixels. The first one is ear positive image, second and third one is respectively for the ear, +30 degrees and -30 degrees of depth rotated image, the fourth one is ear positive image of change the lighting conditions.
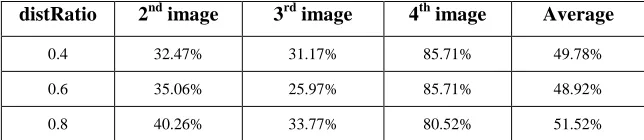
[image:3.612.148.470.650.720.2]First of all, experiment using SIFT-based ear recognition on the image library, where the first image as the training image, other images as the target image. The experiment results are shown in Table 1:
Table 1: The Results Of The Experiment Of SIFT For The Ear Image Database
distRatio 2nd image 3rd image 4th image Average
0.4 32.47% 31.17% 85.71% 49.78%
0.6 35.06% 25.97% 85.71% 48.92%
758 The experimental results show that it can obtain the highest average recognition rate when distRatio=0.8. The results of Two-way matching
[image:4.612.191.430.410.591.2]are shown in Figure 4, the vertical axis denotes recognition rate.
Figure 4: Results Of Two-Way Matching
From the experimental results it can be shown that based on SIFT method has the low recognition rate about human ear image. The main reason is that too few keypoints are detected, so causing some mismatch. It reflects the following questions:
1) The main reason for low recognition rate of 2nd and 3rd image is that the SIFT algorithm for
image scale, rotation, brightness, and the affine transformation is stable, but if the image is rotated depth, the keypoint may be blocked and the value of the neighborhood will change, in the end, the feature vector vary greatly. Figure 5 shows that SIFT feature vector is generated for the same keypoint in different images. These changes affect recogniton stability.
Figure5: The Same Feature Points On The Different Image Generate Sift Characteristic Vector
2)The 4th image recognition rate is relatively high, the SIFT algorithm is stable under changing light conditions.
3) When the threshold changes that the recognition rate of different images can produce different changes. Matching is more accurate when the threshold is lowered. After depth rotation the image feature vector will change, so the recognition rate of 2nd and 3rd image will decline. The fourth
759
Table 2: The Result Of The Experiment Of Harris-SIFT For The Image Database
distRatio 2
ndimage
3
rdimage
4
thimage
Average
0.6 84.42% 87.01% 96.10% 89.18% 0.8 92.21% 94.81% 98.70% 95.24% 0.9 80.52% 84.42% 94.81% 86.58% According to the experimental data we can find
that ear recognition based on fusion Harris and SIFT method has been improved significantly than the SIFT algorithm, the main reason is that the Harris corner is very stable under the conditions of light and depth changes, along with increase of
feature points number, the match will be more stable. Figure 6 is comparision the SIFT algorithm with fusion Harris and SIFT algorithm in matching results, the left picture is about SIFT, the right one shows the proposed fusion Harris and SIFT.
Figure6: SIFT And Harris-SIFT Matching Results Contrast
Ear recognition based on fusion Harris and SIFT still has some problems: The 3rd image recognition rate significantly higher than the 2nd image, the main reason is that the Harris corner after a +30 degree rotation of images will be blocked, while the
3rd image in the -30 degree rotation Harris corner was obscured, as figure 7. we can see many of the key points in the first image but they was blocked in the second image. This structure-based feature recognition method can not be overcomed.
[image:5.612.172.473.255.359.2]Figure7: Sample About The 2nd Image Recognition Is Error And The 3rd Image Recognition Is Correct
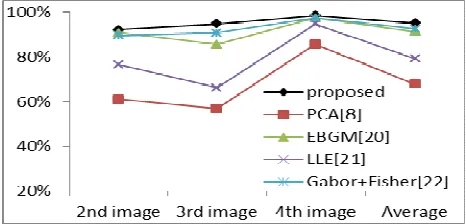
Figure 8 is comparison our method in this paper with other methods using the same human ear experiment database. The vertical axis denotes
recognition rate. It is obvious that proposed method has higher recognition rate than other algrithm.
[image:5.612.193.426.593.705.2]760
5. CONCLUSION
This paper presents an efficient and robust ear recognition method, which uses Harris corner and SIFT descriptor for feature extraction. SIFT descriptor contains a wealth of local image information, with rotation, zoom scale invariance, affine transformation and so on, and to noise has a certain stability, but has low recognition rate of the image after depth rotation. In this paper, the reasons that Harris and SIFT can be combined is analyzed, to some extent, this method can overcome the shortcoming of SIFT, by using two-way matching can obtain higher recognition rate. Experiment result shows robust performance of the method, the recognition performs with an accuracy of more than 95% by using two-way matching. This proves that the method can be developed for actual application.
Acknowledgements: Thanks for the image library of Ear Recognition Laboratory at USTB.
REFRENCES:
[1] M. BURGE, W. BURGER, “Ear Biometrics for
Machine Vision”, Proceedings of 21st
Workshop of the Austrian Association for Pattern Recognition, 1997,pp. 275-282,
[2] WANG XY, Study on Human Ear Recognition by Algebraic Methods. ShenYang University of
Techinology. 2011.
[3] WANG Xiaoyun, GUO Jinyu, “Human ear recognition based on statistic features of local information”, Computer Engineering and
Applications, vol. ,no.9, 2012, pp.141-144.
[4] WANG Yu, XUE Hong. “Application of
strengthened authentication vectors to
multimodal recognition of ear and face”,
Computer Engineering and Applications,
vol.48 ,no.12, 2012,pp.29-33.
[5] LI Yibo, CAO Jingliang, ZHANG Haijun. LI Yibo, CAO Jingliang, ZHANG Haijun, “Improved method of ear recognition based on
tensor PCA”, Computer Engineering and
Applications, vol.47,no,25, 2011, pp.171-174.
[6] Feng Jun, Liang Xiaoxia, Mu Zhichun. “Study On Ear Recognition By Using Histogram Of Oriented Gradient Features And Subregion Fuzzy Fusion”, Computer Applications and
Software, vol.48,no.4, 2012, pp.79-82.
[7] Lu Xiu-li, SHENTU Hong-feng, ZHAO Li-hua,et al., “Ear Recognition Based on 2DLDA
and FSVM”, Science Technology and
Engineering, vol.20,no.12, 2012pp.2852-2855.
[8] Victor B., Bowyer K., Sarkar S. “An evaluation of face and ear biometrics” Proceedings of
16th International Conference on Pattern Recognition, 2002, pp.429-432.
[9] Shailaja D, Gupta P. “A simple Geometric Approach for Ear Recognition”, Proceedings of
9th International Conference on Information Technology, 2006pp.164-167.
[10] Kocaman B, Kirci M. Gunes E.O ,et al., “On ear biometrics”, In Proceedings of the IEEE
2009 International Conference on EUROCON
'09, 2009,pp.327-332.
[11] Choras M, Choras R S, “Geometrical algorithms of ear contour shape representation and feature extraction”, Proceedings of Six
Conference on International System Design and Applications, 2006,pp.451-456.
[12] D J Hurley, M S Nixon, J.N.Carter, “Force Field Feature Extraction for Ear Biometrics”,
Computer Vision and Image Understanding,
vol.98,no.3, 2005,pp. 491-512.
[13] Bustard J D, Nixon M S, “Robust 2D Ear Registration and Recognition Based on SIFT Point Matching”, Proceedings of 2th IEEE
International Conference on Biometrics: Theory. Applications and Systems, 2008,
pp.1-6.
[14] LOWE D G, “Object recognition from local scale-invariant features”, In Proceedings of the
International Conference on Computer Vision,
1999,pp.1150-1157.
[15] LOWE D G, “Distinctive image features from
scale-invafiant key points”, International
Journal of Computer Vision, vol.60,no.2,pp.
91-110, 2004.
[16] ZENG Luan, WANG Yuan-qin, TAN Jiu-bin,
“Improved algorithm for SIFT feature
extraction and matching”,Editorial Office of
Optics and Precision Engineering, vol.19, no.6,
2011, pp.1391-1397.
[17] HARRIS C, STEPHENS M. “A combined corner and edge detector”. Proceedings of the
Fourth Alvey Vision
Conference,1988,pp.47-151.
[18]YAO Y, Image Registration and Application Based on Feature-point Detection. National
761 [19] SUN Nong-liang, LI Huan-huan, YANG
Ning,et al., “Identification of Correspongding Points Based on SIFT Twice Matching
Method”,Computer Engineering, no.4,
2012,pp.155-157.
[20]Wiskott L, Fellous J M, Kruger N, et al. ,“Face recognition by elastic bunch graph matching”,
IEEE Transactions on Pattern Analysis and Machine Intelligence,
vol.19,no.7,1997,pp.775-779.
[21] XIE Zhao-xia, MU Zhi-chun, XIE Jian-jun, “Multi-pose ear recognition based on locally linear embedding” ,Transactions on Intelligent
Systems, vol.3,no.4, 2008, pp.321-327.
[22] Yimo Guo, Guoying Zhao, Jie Chen, “A New Gabor Phase Difference Pattern for Face and Ear Recognition”, Computer Analysis of