WRL
Research Report 97/4a
Potential benefits
of delta encoding
and data compression
for HTTP
(Corrected version)
Jeffrey C. Mogul
Fred Douglis
Anja Feldmann
research relevant to the design and application of high performance scientific computers. We test our ideas by designing, building, and using real systems. The systems we build are research prototypes; they are not intended to become products.
There are two other research laboratories located in Palo Alto, the Network Systems Lab (NSL) and the Systems Research Center (SRC). Another Digital research group is located in Cambridge, Massachusetts (CRL).
Our research is directed towards mainstream high-performance computer systems. Our prototypes are intended to foreshadow the future computing environments used by many Digital customers. The long-term goal of WRL is to aid and accelerate the development of high-performance uni- and multi-processors. The research projects within WRL will address various aspects of high-performance computing.
We believe that significant advances in computer systems do not come from any single technological advance. Technologies, both hardware and software, do not all advance at the same pace. System design is the art of composing systems which use each level of technology in an appropriate balance. A major advance in overall system performance will require reexamination of all aspects of the system.
We do work in the design, fabrication and packaging of hardware; language processing and scaling issues in system software design; and the exploration of new applications areas that are opening up with the advent of higher performance systems. Researchers at WRL cooperate closely and move freely among the various levels of system design. This allows us to explore a wide range of tradeoffs to meet system goals.
We publish the results of our work in a variety of journals, conferences, research reports, and technical notes. This document is a research report. Research reports are normally accounts of completed research and may include material from earlier technical notes. We use technical notes for rapid distribution of technical material; usually this represents research in progress.
Research reports and technical notes may be ordered from us. You may mail your order to:
Technical Report Distribution
DEC Western Research Laboratory, WRL-2 250 University Avenue
Palo Alto, California 94301 USA
Reports and technical notes may also be ordered by electronic mail. Use one of the fol-lowing addresses:
Digital E-net: JOVE::WRL-TECHREPORTS
Internet: [email protected]
UUCP: decpa!wrl-techreports
To obtain more details on ordering by electronic mail, send a message to one of these addresses with the word ‘‘help’’ in the Subject line; you will receive detailed instruc-tions.
Reports and technical notes may also be accessed via the World Wide Web:
and data compression for HTTP
Jeffrey C. Mogul
Digital Equipment Corporation Western Research Laboratory
[email protected]
Fred Douglis
Anja Feldmann
Balachander Krishnamurthy
AT&T Labs -- Research
180 Park Avenue, Florham Park, New Jersey 07932-0971
{douglis,anja,bala}@research.att.com
December, 1997
d i g i t a l
Western Research Laboratory 250 University Avenue Palo Alto, California 94301 USAAbstract
Caching in the World Wide Web currently follows a naive model, which assumes that resources are referenced many times between changes. The model also provides no way to update a cache entry if a resource does change, except by transferring the resource’s entire new value. Several previous papers have proposed updating cache entries by transferring only the differences, or ‘‘delta,’’ between the cached entry and the current value.
In this paper, we make use of dynamic traces of the full contents of HTTP messages to quantify the potential benefits of delta-encoded responses. We show that delta encoding can provide remarkable improvements in response size and response delay for an important subset of HTTP content types. We also show the added benefit of data compression, and that the combination of delta encoding and data compression yields the best results.
We propose specific extensions to the HTTP protocol for delta encoding and data com-pression. These extensions are compatible with existing implementations and specifications, yet allow efficient use of a variety of encoding techniques.
2. Related work 2
3. Motivation and methodology 3
3.1. Obtaining proxy traces 3
3.2. Obtaining packet-level traces 5
3.3. Reassembly of the packet trace into an HTTP trace 5
4. Trace analysis software 6
4.1. Proxy trace analysis software 6
4.2. Packet-level trace analysis software 7
5. Results of trace analysis 8
5.1. Overall response statistics for the proxy trace 8
5.2. Overall response statistics for the packet-level trace 8
5.3. Characteristics of responses 9
5.4. Calculation of savings 10
5.5. Net savings due to deltas and compression 12
5.6. Distribution of savings 16
5.7. Time intervals of delta-eligible responses 20
5.8. Influence of content-type on coding effectiveness 22
5.9. Effect of clustering query URLs 24
6. Including the cost of end-host processing 26
6.1. What about modem-based compression? 30
7. Extending HTTP to support deltas 31
7.1. Background: an overview of HTTP cache validation 32
7.2. Requesting the transmission of deltas 33
7.3. Choice of delta algorithm 34
7.4. Transmission of deltas 35
7.5. Management of base instances 36
7.6. Deltas and intermediate caches 38
7.7. Quantifying the protocol overhead 38
7.8. Ensuring data integrity 39
7.9. Implementation experience 39
8. Future work 40
8.1. Delta algorithms for images 40
8.2. Effect of cache size on effectiveness of deltas 40
8.3. Deltas between non-contiguous responses 41
8.4. Avoiding the cost of creating deltas 41
8.5. Decision procedures for using deltas or compression 41
9. Summary and conclusions 42
Acknowledgments 42
Figure 5-2: Cumulative distributions of response sizes (packet trace) 9 Figure 5-3: Cumulative distributions of reference counts (proxy trace) 10 Figure 5-4: Distribution of latencies for various phases of retrieval (proxy trace) 11 Figure 5-5: Distribution of cumulative latencies to various phases (packet-level 12
trace)
Figure 5-6: Distribution of response-body bytes saved for delta-eligible responses 16 (proxy trace)
Figure 5-7: Distribution of response-body bytes saved for delta-eligible responses 16 (packet trace)
Figure 5-8: Weighted distribution of response-body bytes saved for delta-eligible 17 responses (proxy trace)
Figure 5-9: Time intervals for delta-eligible responses (proxy trace) 20 Figure 5-10: Time intervals for delta-eligible responses (proxy trace), weighted 21
relative to all delta-eligible responses)
Table 5-2: Improvements assuming deltas are applied at a proxy (proxy trace, 13 relative to all status-200 responses)
Table 5-3: Improvements assuming deltas are applied at a proxy (packet-level 14 trace, relative to all delta-eligible responses)
Table 5-4: Improvements assuming deltas are applied at a proxy (packet-level 14 trace, relative to all status-200 responses)
Table 5-5: Improvements assuming deltas are applied at individual clients 15 (proxy trace, relative to delta-eligible responses)
Table 5-6: Improvements assuming deltas are applied at individual clients 15 (proxy trace, relative to all status-200 responses)
Table 5-7: Mean and median values for savings from vdelta encoding, for all 18 delta-eligible responses
Table 5-8: Mean and median values for savings from vdelta encoding, for delta- 19 eligible responses improved by vdelta
Table 5-9: Mean and median values for savings from gzip compression, for all 19 status-200 responses
Table 5-10: Mean and median values for savings from gzip compression, for 20 status-200 responses improved by gzip
Table 5-11: Breakdown of status-200 responses by content-type (packet-level 22 trace)
Table 5-12: Breakdown of delta-eligible responses by content-type (packet-level 23 trace)
Table 5-13: Summary of unchanged response bodies by content-type (packet- 23 level trace)
Table 5-14: Summary of savings by content-type for delta-encoding with vdelta, 24 (all delta-eligible responses in packet-level trace)
Table 5-15: Summary of gzip compression savings by content-type (all status-200 25 responses in packet-level trace)
Table 5-16: Improvements relative to all status-200 responses to queries (no 26 clustering, proxy trace)
Table 5-17: Improvements when clustering queries (all status-200 responses to 26 queries, proxy trace)
Table 6-1: Compression and delta encoding rates for 50 Mhz 80486 (BSD/OS 27 2.1)
Table 6-2: Compression and delta encoding rates for 90 MHz Pentium (Linux 28 2.0.0)
Table 6-3: Compression and delta encoding rates for 400 MHz AlphaStation 500 29 (Digital UNIX 3.2G)
Table 6-4: URLs used in modem experiments 30
Table 6-5: Effect of modem-based compression on transfer time 31 Table 6-6: Compression and decompression times for files in tables 6-4 and 6-5 32
using 50 Mhz 80486 (BSD/OS 2.1)
The World Wide Web is a distributed system, and so often benefits from caching to reduce retrieval delays. Retrieval of a Web resource (such as document, image, icon, or applet) over the Internet or other wide-area network usually takes enough time that the delay is over the human threshold of perception. Often, that delay is measured in seconds. Caching can often eliminate or significantly reduce retrieval delays.
Many Web resources change over time, so a practical caching approach must include a coherency mechanism, to avoid presenting stale information to the user. Originally, the Hyper-text Transfer Protocol (HTTP) provided little support for caching, but under operational pres-sures, it quickly evolved to support a simple mechanism for maintaining cache coherency.
In HTTP/1.0 [3], the server may supply a ‘‘last-modified’’ timestamp with a response. If a client stores this response in a cache entry, and then later wishes to re-use the response, it may transmit a request message with an ‘‘if-modified-since’’ field containing that timestamp; this is known as a conditional retrieval. Upon receiving a conditional request, the server may either reply with a full response, or, if the resource has not changed, it may send an abbreviated reply, indicating that the client’s cache entry is still valid. HTTP/1.0 also includes a means for the server to indicate, via an ‘‘expires’’ timestamp, that a response will be valid until that time; if so, a client may use a cached copy of the response until that time, without first validating it using a conditional retrieval.
The proposed HTTP/1.1 specification [6] adds many new features to improve cache coherency and performance. However, it preserves the all-or-none model for responses to conditional retrievals: either the server indicates that the resource value has not changed at all, or it must transmit the entire current value.
Common sense suggests (and traces confirm), however, that even when a Web resource does change, the new instance is often substantially similar to the old one. If the difference (or delta) between the two instances could be sent to the client instead of the entire new instance, a client holding a cached copy of the old instance could apply the delta to construct the new version. In a world of finite bandwidth, the reduction in response size and delay could be significant.
One can think of deltas as a way to squeeze as much benefit as possible from client and proxy caches. Rather than treating an entire response as the ‘‘cache line,’’ with deltas we can treat arbitrary pieces of a cached response as the replaceable unit, and avoid transferring pieces that have not changed.
In this paper, we make use of dynamic traces of the full contents of HTTP messages to quan-tify the potential benefits of delta-encoded responses. Although previous papers [2, 9, 19] have proposed the use of delta encoding, ours is the first to use realistic traces to quantify the benefits. Our use of long traces from two different sites increases our confidence in the results.
We propose specific extensions to the HTTP protocol for delta encoding and data compres-sion. These extensions are compatible with existing implementations and specifications, yet al-low efficient use of a variety of encoding techniques.
2. Related work
The idea of delta-encoding to reduce communication or storage costs is not new. For ex-ample, the MPEG-1 video compression standard transmits occasional still-image frames, but most of the frames sent are encoded (to oversimplify) as changes from an adjacent frame. The SCCS and RCS [17] systems for software version control represent intermediate versions as del-tas; SCCS starts with an original version and encodes subsequent ones with forward deltas, whereas RCS encodes previous versions as reverse deltas from their successors. Jacobson’s technique for compressing IP and TCP headers over slow links [11] uses a clever, highly special-ized form of delta encoding.
In spite of this history, it appears to have taken several years before anyone thought of apply-ing delta encodapply-ing to HTTP, perhaps because the development of HTTP cachapply-ing has been some-what haphazard. The first published suggestion for delta encoding appears to have been by Wil-liams et al. in a paper about HTTP cache removal policies [19], but these authors did not elaborate on their design until later [18].
The possibility of compressing HTTP messages seems to have a longer history, going back at least to the early drafts of the HTTP/1.0 specification. However, until recently, it appears that nobody had attempted to quantify the potential benefits of loss-free compression, although the GloMop project [7] did explore the use of lossy compression. A study done at the World Wide Web Consortium reports on the benefits of compression in HTTP, but for only one example document [15]. Also, our traces suggest that few existing client implementations offer to accept compressed encodings of arbitrary responses (apparently, Lynx is the one exception). (Before the Web was an issue, Douglis [4] wrote generally about compression in distributed systems.)
The WebExpress project [9] appears to be the first published description of an implementation of delta encoding for HTTP (which they call ‘‘differencing’’). WebExpress is aimed specifically at wireless environments, and includes a number of orthogonal optimizations. Also, the WebExpress design does not propose changing the HTTP protocol itself, but rather uses a pair of interposed proxies to convert the HTTP message stream into an optimized form. The results reported for WebExpress differencing are impressive, but are limited to a few selected benchmarks.
We are also analyzing the same traces to study the rate of change of Web resources [5].
3. Motivation and methodology
Although two previous papers [2, 9] have shown that compression and delta encoding could improve HTTP performance for selected sets of resources, these did not analyze traces from ‘‘live’’ users to see if the benefits would apply in practice. Also, these two projects both as-sumed that existing HTTP clients and servers could not be modified, and so relied on interposing proxy systems at either end of the slowest link. This approach adds extra store-and-forward latency, and may not always be feasible, so we wanted to examine the benefits of end-to-end delta encoding and compression, as an extension to the HTTP protocol.
In this paper, we use a trace-based analysis to quantify the potential benefits from both proxy-based and end-to-end applications of compression and delta encoding. Both of these applica-tions are supported by our proposed changes to HTTP. We also analyze the utility of these techniques for various different HTTP content-types (such as HTML, plain text, and image for-mats), and for several ways of grouping responses to HTTP queries. We look at several different algorithms for both delta encoding and data compression, and we examine the relative perfor-mance of high-level compression and modem-based compression algorithms.
We used two different traces in our study, made at Internet connection points for two large corporations. One of the traces was obtained by instrumenting a busy proxy; the other was made by capturing raw network packets and reconstructing the data stream. Both traces captured only references to Internet servers outside these corporations, and did not include any ‘‘inbound’’ requests. Because the two traces represent different protocol levels, time scales, user com-munities, and criteria for pre-filtering the trace, they give us several views of ‘‘real life’’ refer-ence streams, although certainly not of all possible environments.
Since the raw traces include a lot of sensitive information, for reasons of privacy and security the authors of this paper were not able to share the traces with each other. That, and the use of different trace-collection methods, led us to do somewhat different analyses on the two trace sets.
3.1. Obtaining proxy traces
3.1.1. Tracing environment
We were able to collect traces at a proxy site that serves a large fraction of the clients on the internal network of Digital Equipment Corporation. Digital’s network is isolated from the Inter-net by firewalls, and so all InterInter-net access is mediated by proxy relays. This site, located in Palo Alto, California, and operated by Digital’s Network Systems Laboratory, relayed more than a million HTTP requests each weekday. The proxy load was spread, more or less equally, across two AlphaStation 250 4/266 systems running Digital UNIX V3.2C.
To collect these traces, we modified version 3.0 of the CERN httpd code, which may be used as either a proxy or a server. We made minimal modifications, to reduce the risk of introducing bugs or significant performance effects. The modified proxy code traces a selected subset of the requests it receives:
•Only requests going to HTTP servers (i.e., not FTP or Gopher)
•Only those requests whose URL does not end in one of these extensions: ‘‘.aif’’, ‘‘.aifc’’, ‘‘.aiff’’, ‘‘.au’’, ‘‘.avi’’, ‘‘.dl’’, ‘‘.exe’’, ‘‘.flc’’, ‘‘.fli’’, ‘‘.gif’’, ‘‘.gl’’, ‘‘.gz’’, ‘‘.ief’’, ‘‘.jpeg’’, ‘‘.jpg’’, ‘‘.mov’’, ‘‘.movie’’, ‘‘.mpe’’, ‘‘.mpeg’’, ‘‘.mpg’’, ‘‘.qt’’, ‘‘.snd’’, ‘‘.tiff’’, ‘‘.wav’’, ‘‘.xwd’’, and ‘‘.Z’’. These URLs were omitted in order to reduce the size of the trace logs.
This pre-filtering considered only the URL in the request, not the HTTP Content-type in the response; therefore, many responses with unwanted content-types leaked through.
For each request that is traced, the proxy records in a disk file: •Client and server IP addresses.
•Timestamps for various events in processing the request.
•The complete HTTP header and body of both the request and the response.
To allow one-pass generation of the trace logs, byte counts for the variable-sized fields (the HTTP headers and bodies) are written after the corresponding data. This means that the software which parses the logs must parse them in reverse order, but this is not especially difficult. Since the CERN proxy handles each request in a separate UNIX process, and these processes may terminate at unpredictable times, the log format includes special ‘‘magic-number’’ markers to allow the parsing software to ignore incomplete log entries.
This particular proxy installation was configured not to cache HTTP responses, for a variety of logistical reasons. This means that a number of the responses in the trace contained a full body (i.e., HTTP status code = 200) when, if the proxy had been operating as a cache, they might have instead been ‘‘Not Modified’’ responses with no body (i.e., HTTP status code = 304). The precise number of such responses would depend on the size of the proxy cache and its replace-ment policy. We still received many ‘‘Not Modified’’ responses, because most of the client hosts employ caches.
3.1.2. Trace duration
al-most 9 GBytes of trace file data. (Many requests were omitted by the pre-filtering step, or be-cause they were terminated by the requesting client.) While tracing was in progress, ap-proximately 8078 distinct client hosts used the proxy site, which (including the untraced re-quests) forwarded almost 21 GBytes of response bodies, in addition to HTTP message headers (whose length is not shown in the standard proxy log format).
3.2. Obtaining packet-level traces
When a large user community is not constrained to use a proxy to reach the Internet, the op-tion of instrumenting a proxy is not available. Instead, one can passively monitor the network segment connecting this community to the Internet, and reconstruct the data stream from the packets captured.
We collected a packet-level trace at the connection between the Internet and the network of AT&T Labs -- Research, in New Jersey. This trace represents a much smaller client population than the proxy trace. All packets between internal users and TCP port 80 (the default HTTP server port, used for more than 99.4% of the HTTP references seen at this site) on external ser-vers were captured using tcpdump [14]. Packets between external users and the AT&T Labs --Research Web server were not monitored. A negligible number of packets were lost due to buffer overruns. The raw packet traces were later processed offline, to generate an HTTP-level trace, as described in section 3.3.
Between Friday, November 8 and Monday, November 25, 1996, (17 days) we collected a total of 51,100,000 packets, corresponding to roughly 19 Gbytes of raw data. Unlike the proxy-based trace, this one was not pre-filtered to eliminate requests based on their content-type or URL ex-tension.
3.3. Reassembly of the packet trace into an HTTP trace
The individual packets captured in the packet-level trace are not directly usable for our study; they must first be reassembled into individual TCP streams, after which the HTTP request response messages may be extracted.
Due to the huge amount of raw trace data (105 Gbytes), it was not feasible to process the entire trace as a whole. Instead, the raw trace was split into chunks (contiguous sub-sequences) of 3,100,000 packets (about 6 Gbytes), and each chunk was processed separately. Since an HTTP message might span the boundary between two chunks, each chunk overlaps with the previous chunk by 100,000 packets. This means that any given TCP stream should be present in its entirely in at least one chunk. Some streams might be fully or partially present in two chunks; we were able to eliminate duplicates by associating a timestamp with each stream. In subsequent processing, any HTTP message with a duplicate timestamp was ignored (with priority given to a full message over a partially reassembled message).
connections within each packet path. Each TCP connection begins with an exchange of SYN packets and ends with an exchange of FIN packets, which when processed in the correct se-quence, determine the extent of each connection.
Once the trace is divided into TCP connections, the packets within a connection must be con-verted into HTTP messages. TCP packets may be lost, reordered, corrupted, or duplicated, but by its design as a reliable stream protocol, TCP provides enough sequencing information in the packet headers for our software to reconstruct the actual data stream, except in the rare cases where our network monitor missed seeing a packet. (In these cases, we excluded the entire HTTP exchange from future analyses.)
Using these reassembled HTTP messages, the trace-processing software generates a set of files representing the body of each successful request and a log containing information about URLs, timestamps, and request and response headers. This log is fed into a Perl script that summarizes statistics and produces a trace format used as the input for later stages (see section 4.2). The trace format has one record per response, including the URL and the name of the file that stores the associated response body, as well as other fields (such as sizes and timestamps) necessary for our study.
In our traces we saw 1,322,463 requests, of which 26,591 (1.9%) had gaps, due to packet losses and the segmentation of the raw trace into chunks. Another 43,938 (3.3%) of the requests were detected as duplicates created by the overlaps between chunks. Both these sets were ex-cluded from further analysis. To further restrict our analysis only to those references where the client received the complete HTTP response body, we included only those TCP streams for which we collected SYN and FIN packets from both client and server, or for which the size of the reassembled response body equaled the size specified in the Content-length field of the HTTP response. This left us with 1,075,209 usable responses (81% of the total).
4. Trace analysis software
Because the two traces were obtained using different techniques, we had to write two different systems to analyze them.
4.1. Proxy trace analysis software
We wrote software to parse the trace files and extract relevant HTTP header fields. The analysis software then groups the references by unique resource (URL), and to instances of a resource. We use the term instance to describe a snapshot in the lifetime of a resource. In our analyses, we group responses for a given URL into a single instance if the responses have iden-tical last-modified timestamps and response body lengths. There may be one or more instances per resource, and one or more references per instance.
same resource. (If two references involve the same instance, then presumably a caching proxy would have sent an If-Modified-Since request. The server then would have sent a ‘‘Not Modified’’ response, with status = 304 and no response body, rather than two identical respon-ses.)
For each such pair of full-body responses for different instances of a resource, the analysis program computes a delta encoding for the second response, based on the first response. This is done using several different delta-encoding algorithms; the program then reports the size of the resulting response bodies for each of these algorithms.
The delta computation is done by extracting the relevant response bodies from the trace log files into temporary files, then invoking one of the delta-encoding algorithms on these files, and measuring the size of the output.
The delta-encoding algorithms that we applied include:
•diff -e: a fairly compact format generated by the UNIX ‘‘diff’’ command, for use as
input to the ‘‘ed’’ text editor (rather than for direct use by humans).1
•compressed diff -e: the output of diff -e, but compressed using the gzip program. •vdelta: this program inherently compresses its output [10].
We used diff to show how well a fairly naive, but easily available algorithm would perform. We also used vdelta, a more elaborate algorithm, because it was identified by Hunt et al. as the best overall delta algorithm, based on both output size and running time [10].
The UNIX diff program does not work on binary-format input files, so we restricted its ap-plication to responses whose Content-type field indicated a non-binary format; these included ‘‘text/html’’, ‘‘application/postscript’’, ‘‘text/plain’’, ‘‘application/x-javascript’’, and several other formats. Vdelta was used on all formats.
We ran our analysis software on an AlphaStation 600 5/333 with 640 MBytes of RAM. However, the program only used approximately 100 MBytes of virtual memory to analyze this set of traces. A typical analysis of the entire trace set took approximately 9 hours, but the analysis program has not been tuned or optimized, and the system spent a significant amount of time blocked on disk I/O.
4.2. Packet-level trace analysis software
We processed the individual response body files derived from the packet trace (see section 3.2) using a Perl script to compute the size of the deltas between pairs of sequentially adjacent full-body responses for the same URL, and the size of a compressed version of each full-body response. This analysis, like the proxy-trace analysis, used the diff -e, compressed diff -e, and
vdelta algorithms to compute deltas.
1Because HTML files include lines of arbitrary length, and because the standard ed editor cannot handle long
While the proxy-based trace, by construction, omitted many of the binary-format responses in the reference stream, the packet-based trace included all content types. We classified these into ‘‘textual’’ and ‘‘non-textual’’ responses, using the URL extension, the Content-type HTTP response-header, or (as a last resort) by scanning the file using a variant of the UNIX file com-mand.
5. Results of trace analysis
This section describes the results of our analysis of the proxy and packet-level traces.
5.1. Overall response statistics for the proxy trace
The 504736 complete records in the proxy trace represent the activity of 7411 distinct client hosts, accessing 22034 distinct servers, referencing 238663 distinct resources (URLs). Of these URLs, 100780 contained ‘‘?’’ and are classified as query URLs; these had 12004 unique prefixes (up to the first ‘‘?’’ character). The requests totalled 149 MBytes (mean = 311 bytes/message). The request headers totalled 146 MBytes (mean = 306 bytes), and the response headers totalled 81 MBytes (mean = 161 bytes). 377962 of the responses carried a full body, for a total of 2450 MB (mean = 6798 bytes); most of the other types of responses do not carry much (or any) infor-mation in their bodies. 17211 (3.4%) of the responses carried a status code of 304 (Not Modified).
Note that the mean response body size for all of the references handled by the proxy site (7773 bytes) is somewhat larger than the mean size of the response bodies captured in the traces. This is probably because the data types, especially images, that were filtered out of the trace based on URL extension tend to be somewhat larger than average.
5.2. Overall response statistics for the packet-level trace
The 1075209 usable records in the packet-level trace represent the activity of 465 clients, ac-cessing 20956 servers, referencing 499608 distinct URLs. Of these URLs, 77112 instances (39628 distinct URLs) contained ‘‘?’’ and are classified as query URLs; these had 8054 unique prefixes (up to the first ‘‘?’’ character). 52670 of the instances (28872 distinct URLs) contained ‘‘cgi’’, and so are probably references to CGI scripts.
The mean request and response header sizes were 281 bytes and 173 bytes, respectively. 818142 of the responses carried a full body, for a total of 6104 MB of response bodies (mean = 7881 bytes for full-body responses). 145139 (13.5%) of the responses carried a status code of 304 (Not Modified). We omitted from our subsequent analyses 1144 full-body responses for which we did not have trustworthy timing data, leaving a total of 816998 fully-analyzed respon-ses.
5.3. Characteristics of responses
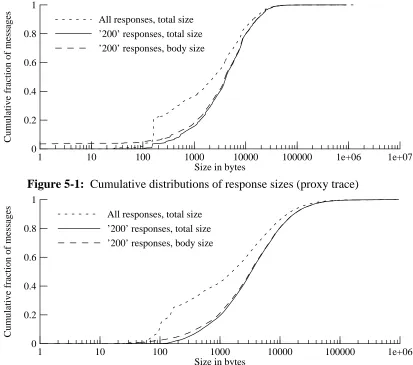
Figure 5-1 shows cumulative distributions for total response sizes, and for the response-body size for full-body responses, for the proxy trace. Figure 5-2 shows the corresponding distribu-tions for the packet-level trace. The median full-response body size was 3976 bytes for the proxy trace, and 3210 bytes for the packet-level traces, which implies that the packet-level trace showed larger variance in response size. Note that over 99% of the bytes carried in response bodies, in this trace, were carried in the status-200 responses; this is normal, since HTTP respon-ses with other status codes either carry no body, or a very small one.
1 1e+07
Size in bytes
10 100 1000 10000 100000 1e+06
0 1
0.2 0.4 0.6 0.8
Cumulative fraction of messages
[image:19.612.131.544.194.559.2]All responses, total size ’200’ responses, total size ’200’ responses, body size
Figure 5-1: Cumulative distributions of response sizes (proxy trace)
1 1e+06
Size in bytes
10 100 1000 10000 100000
0 1
0.2 0.4 0.6 0.8
Cumulative fraction of messages
All responses, total size ’200’ responses, total size ’200’ responses, body size
Figure 5-2: Cumulative distributions of response sizes (packet trace)
1 10000 Number of references
10 100 1000
0 600000
100000 200000 300000 400000 500000
Cumulative count
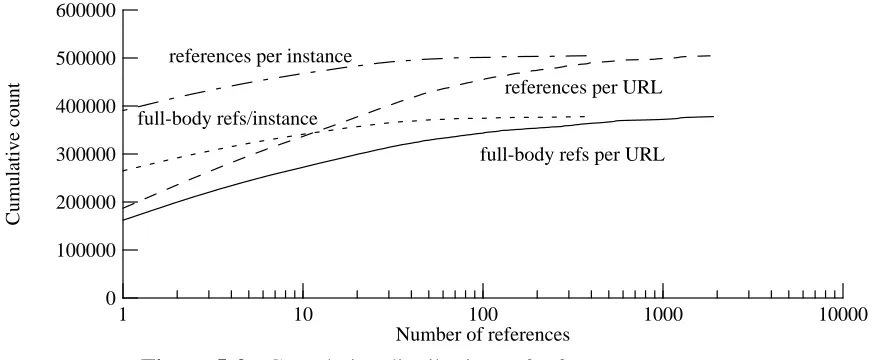
full-body refs per URL full-body refs/instance
[image:20.612.79.520.66.246.2]references per URL references per instance
Figure 5-3: Cumulative distributions of reference counts
(proxy trace)
5.4. Calculation of savings
We define a response as delta-eligible if the trace included at least one previous status-200 response for a different instance of the same resource. (We did not include any response that conveyed an instance identical to the previous response for the same URL, which probably would not have been received by a caching proxy.) In the proxy trace, 113356 of the 377962 status-200 responses (30.0%) were delta-eligible. In the packet-level trace, 83905 of the 816998 status-200 responses (10.3%) were delta-eligible. In the proxy trace, only 30% of the status-200 responses were excluded from consideration for being identical, compared to 32% for the packet-level trace.
We attribute much of the difference in the number of delta-eligible responses to the slower rate of change of image responses, which were mostly pre-filtered out of the proxy trace. In the packet-level trace, 66% of the status-200 responses were GIF or JPEG images, but only 3.0% of those responses were delta-eligible; in contrast, 19% of the status-200 HTML responses were delta-eligible. Some additional part of the discrepancy may be the result of the smaller client population in the packet-level traces, which might lead to fewer opportunities for sharing.
Our first analysis is based on the assumption that the deltas would be requested by the proxy, and applied at the proxy to responses in its cache; if this were only done at the individual clients, far fewer of the responses would be delta-eligible. In section 5.5.1, we analyze the per-client reference streams separately, as if the deltas were applied at the clients.
For each of the delta-eligible responses, we computed a delta using the vdelta program, based on the previous status-200 instance in the trace, and two compressed versions of the response, using gzip and vdelta. For those responses whose HTTP Content-type field indicated an ASCII text format (‘‘text/html’’, ‘‘text/plain’’, ‘‘application/postscript’’, and a few others), we also computed a delta using the UNIX diff -e command, and a compressed version of this delta, using
gzip. 66413 (59%) of the delta-eligible responses in the proxy trace were text-format responses,
For each response, and for each of the four computations, we measured the number of response-body bytes saved (if any). We also estimated the amount of retrieval time that would have been saved for that response, had the delta or compression technique been used. (We did not include the computational costs of encoding or decoding; see section 6 for those costs.)
Our estimate of the improvement in retrieval time is simplistic, but probably conservative. We estimated the transfer time for the response from the timestamps in our traces, and then mul-tiplied that estimate by the fraction of bytes saved to obtain a prediction for the improved response transfer time. However, in the proxy traces it is not possible to separate the time to transmit the request from the time to receive the first part of the response, so our estimate of the original transfer time is high. We compensated for that by computing two estimates for the transfer time, one which is high (because it includes the request time) and one which is low (because it does not include either the request time, or the time for receiving the first bytes of the response). We multiplied the fraction of bytes saved by the latter (low) estimate, and then divided the result by the former (high) estimate, to arrive at our estimate of the fraction of time saved.
For the packet-level traces, we were able to partially validate this model. We measured the time it actually took to receive the packets including the first N bytes of an M-byte transfer, where N is the number of bytes that would have been seen if delta encoding or compression had been used. The results agree with our simpler model to within about 10%, but are still conser-vative (because we did not model the reduction in the size of the last data packet).
10 100000
Latency in milliseconds
100 1000 10000
0 35000
5000 10000 15000 20000 25000 30000
Number of status-200 references
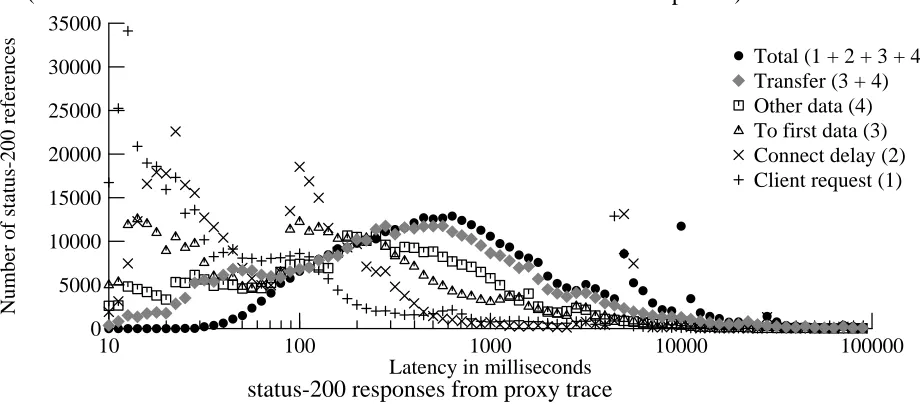
Client request (1) Connect delay (2) To first data (3) Other data (4) Transfer (3 + 4) Total (1 + 2 + 3 + 4)
[image:21.612.109.569.365.568.2]status-200 responses from proxy trace
Figure 5-4: Distribution of latencies for various phases of retrieval (proxy trace)
10 100000 Latency (milliseconds) from client’s initial SYN packet
100 1000 10000
0 180000
30000 60000 90000 120000 150000
Number of status-200 responses
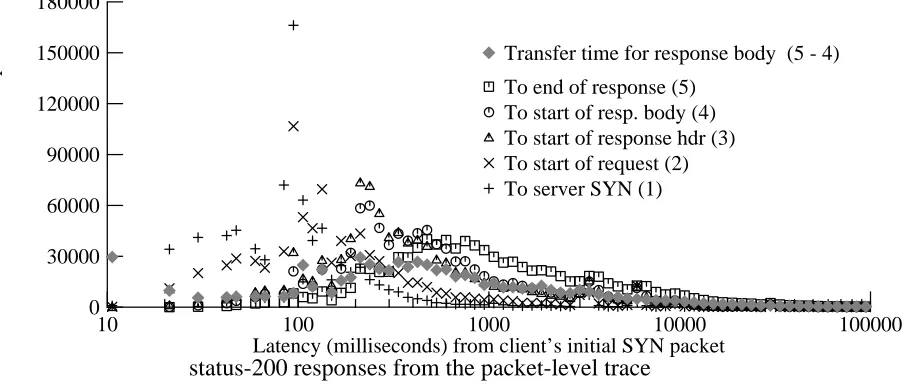
To server SYN (1) To start of request (2) To start of response hdr (3) To start of resp. body (4) To end of response (5)
Transfer time for response body (5 - 4)
[image:22.612.78.530.70.262.2]status-200 responses from the packet-level trace
Figure 5-5: Distribution of cumulative latencies to various phases (packet-level trace)
Figure 5-5 shows a similar view of the packet-level trace. The individual steps are somewhat different (the packet-level trace exposes finer detail), and the latencies are all measured from the start of the connection (the client’s SYN packet). The steps are (1) arrival of the server’s SYN, (2) first packet of the HTTP request, (3) first packet of the response header, (4) first packet of the response body, and (5) end of the response. The figure also shows the transfer time for the response body, which is similar to (but smaller than) the transfer-time estimate used in figure 5-4.
5.5. Net savings due to deltas and compression
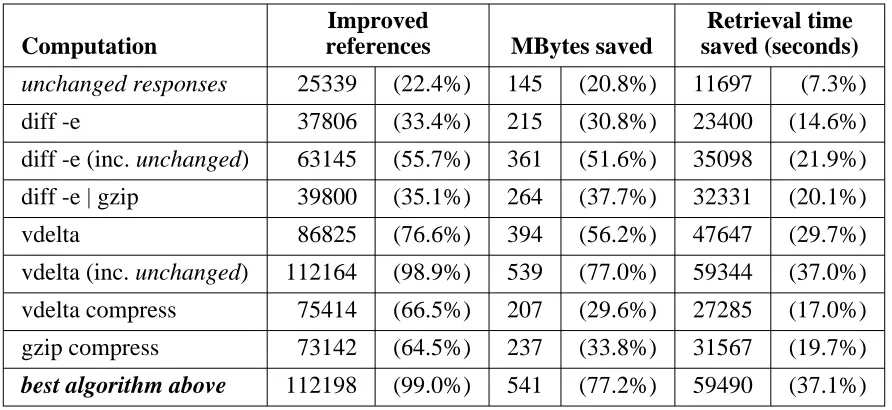
Tables 5-1 and 5-2 show (for the proxy trace) how many of the responses were improved, and by how much. Table 5-1 shows the results relative to just the delta-eligible responses; Table 5-2 shows the same results, but expressed as a fraction of all full-body responses. Because these account for more than 99% of the response-body bytes in the traces, this is also nearly equivalent to the overall improvement for all traced responses.
In tables 5-1 and 5-2, the rows labeled ‘‘unchanged’’ shows how many delta-eligible respon-ses would have resulted in a zero-length delta. (An ‘‘unchanged’’ response is delta-eligible be-cause its last-modified time has changed, although its body has not.) The rows labelled ‘‘diff -e’’, ‘‘diff -e | gzip’’, and ‘‘vdelta’’ show the delta-encoding results only for those responses where there is at least some difference between a delta-eligible response and the previous in-stance. Two other lines show the results if the unchanged responses are included. The rows labelled ‘‘vdelta compress’’ and ‘‘gzip compress’’ show the results for compressing the respon-ses, without using any delta encoding. The final row shows the overall improvement (not includ-ing unchanged responses), assuminclud-ing that the server uses whichever of these algorithms min-imizes each response.
Computation
Improved
references MBytes saved
Retrieval time saved (seconds)
unchanged responses 25339 (22.4%) 145 (20.8%) 11697 (7.3%)
diff -e 37806 (33.4%) 215 (30.8%) 23400 (14.6%)
diff -e (inc. unchanged) 63145 (55.7%) 361 (51.6%) 35098 (21.9%)
diff -e | gzip 39800 (35.1%) 264 (37.7%) 32331 (20.1%)
vdelta 86825 (76.6%) 394 (56.2%) 47647 (29.7%)
vdelta (inc. unchanged) 112164 (98.9%) 539 (77.0%) 59344 (37.0%)
vdelta compress 75414 (66.5%) 207 (29.6%) 27285 (17.0%)
gzip compress 73142 (64.5%) 237 (33.8%) 31567 (19.7%)
best algorithm above 112198 (99.0%) 541 (77.2%) 59490 (37.1%)
[image:23.612.102.548.70.275.2]N = 113356, 701 MBytes total, 160551 seconds total
Table 5-1: Improvements assuming deltas are applied at a proxy
(proxy trace, relative to all delta-eligible responses)
Computation
Improved
references MBytes saved
Retrieval time saved (seconds)
unchanged responses 25339 (6.7%) 145 (6.0%) 11697 (2.1%)
diff -e 37806 (10.0%) 215 (8.8%) 23400 (4.2%)
diff -e (inc. unchanged) 63145 (16.7%) 361 (14.8%) 35098 (6.3%)
diff -e | gzip 39800 (10.5%) 264 (10.8%) 32331 (5.8%)
vdelta 86825 (23.0%) 394 (16.1%) 47647 (8.5%)
vdelta (inc. unchanged) 112164 (29.7%) 539 (22.0%) 59344 (10.6%)
vdelta compress 302739 (80.1%) 832 (34.0%) 104092 (18.7%)
gzip compress 289914 (76.7%) 965 (39.4%) 124045 (22.3%)
best algorithm above 340845 (90.2%) 1270 (51.9%) 152086 (27.3%)
N = 377962, 2462 MBytes total, 557373 seconds total
Table 5-2: Improvements assuming deltas are applied at a proxy
(proxy trace, relative to all status-200 responses)
that is, in those cases where the recipient already has a cached copy of a prior instance. And while it appears that the potential savings in transmission time is smaller than the savings in response bytes, the response-time calculation is quite conservative (as noted earlier).
[image:23.612.87.552.335.541.2]clearly works best, but just using diff -e would save 52% of the response-body bytes for delta-eligible responses. That is, more than half of the bytes in ‘‘new’’ responses are easily shown to be the same as in their predecessors.
Computation
Improved
references MBytes saved
Retrieval time saved (seconds)
unchanged responses 6332 (7.5%) 8 (1.2%) 1459 (0.8%)
diff -e 49681 (59.2%) 242 (38.2%) 56485 (30.2%)
diff -e (inc. unchanged) 59744 (71.2%) 292 (46.2%) 57943 (30.9%)
diff -e | gzip 50467 (60.1%) 280 (44.2%) 70487 (37.6%)
vdelta 73483 (87.6%) 467 (73.8%) 100073 (53.4%)
vdelta (inc. unchanged) 83546 (99.6%) 517 (81.7%) 101532 (54.2%)
vdelta compress 76257 (90.9%) 250 (39.5%) 52424 (28.0%)
gzip compress 72819 (86.8%) 277 (43.8%) 59402 (31.7%)
[image:24.612.55.516.376.566.2]N = 83905, 633 MBytes total, 187303 seconds total
Table 5-3: Improvements assuming deltas are applied at a proxy
(packet-level trace, relative to all delta-eligible responses)
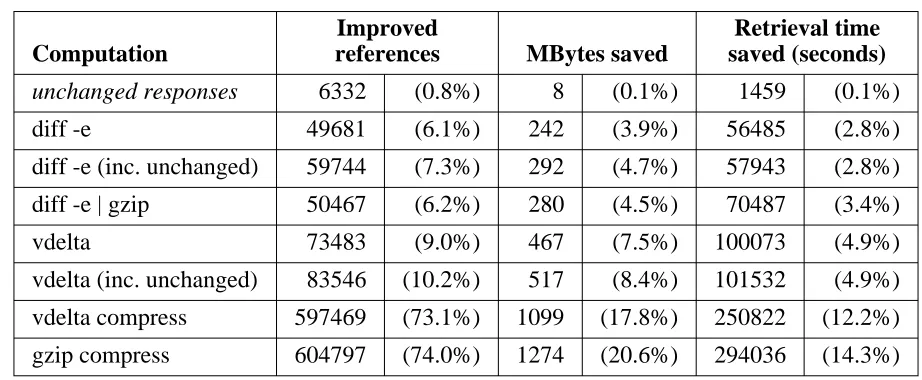
Computation
Improved
references MBytes saved
Retrieval time saved (seconds)
unchanged responses 6332 (0.8%) 8 (0.1%) 1459 (0.1%)
diff -e 49681 (6.1%) 242 (3.9%) 56485 (2.8%)
diff -e (inc. unchanged) 59744 (7.3%) 292 (4.7%) 57943 (2.8%)
diff -e | gzip 50467 (6.2%) 280 (4.5%) 70487 (3.4%)
vdelta 73483 (9.0%) 467 (7.5%) 100073 (4.9%)
vdelta (inc. unchanged) 83546 (10.2%) 517 (8.4%) 101532 (4.9%)
vdelta compress 597469 (73.1%) 1099 (17.8%) 250822 (12.2%)
gzip compress 604797 (74.0%) 1274 (20.6%) 294036 (14.3%)
N = 816998, 6193 MBytes, 2053027 seconds
Table 5-4: Improvements assuming deltas are applied at a proxy
(packet-level trace, relative to all status-200 responses)
Because the packet-level trace analysis uses a somewhat more accurate (and so less conser-vative) model for the savings in transfer time, similar reductions in the number of bytes trans-ferred lead to different reductions in transfer time.
Taken together, the results in tables 5-1, 5-2, 5-3, and 5-4 imply that if delta encoding is pos-sible, then it is usually the best way to transmit a changed response. If delta encoding is not possible, such as the first retrieval of a resource in a reference stream, then data compression is usually valuable.
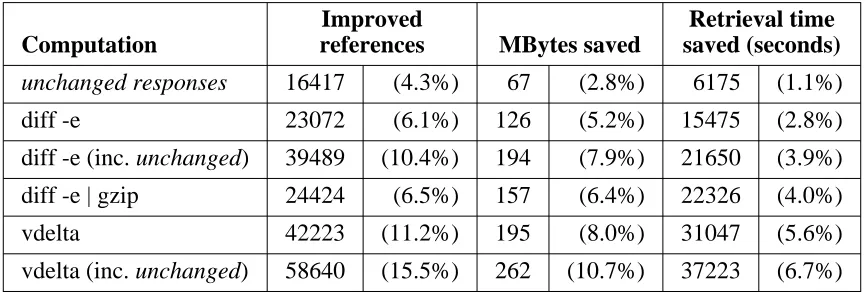
5.5.1. Analysis assuming client-applied deltas
Computation
Improved
references MBytes saved
Retrieval time saved (seconds)
unchanged responses 16417 (27.6%) 67 (22.8%) 6175 (5.9%)
diff -e 23072 (38.7%) 126 (42.9%) 15475 (14.7%)
diff -e (inc. unchanged) 39489 (66.3%) 194 (65.7%) 21650 (20.6%)
diff -e | gzip 24424 (41.0%) 157 (53.3%) 22326 (21.3%)
vdelta 42223 (70.9%) 195 (66.0%) 31047 (29.6%)
vdelta (inc. unchanged) 58640 (98.5%) 262 (88.8%) 37223 (35.4%)
[image:25.612.103.544.215.363.2]N = 59550, 296 Mbytes, 105020 seconds
Table 5-5: Improvements assuming deltas are applied at individual clients
(proxy trace, relative to delta-eligible responses)
Computation
Improved
references MBytes saved
Retrieval time saved (seconds)
unchanged responses 16417 (4.3%) 67 (2.8%) 6175 (1.1%)
diff -e 23072 (6.1%) 126 (5.2%) 15475 (2.8%)
diff -e (inc. unchanged) 39489 (10.4%) 194 (7.9%) 21650 (3.9%)
diff -e | gzip 24424 (6.5%) 157 (6.4%) 22326 (4.0%)
vdelta 42223 (11.2%) 195 (8.0%) 31047 (5.6%)
vdelta (inc. unchanged) 58640 (15.5%) 262 (10.7%) 37223 (6.7%)
N = 377962, 2450 MBytes, 557373 seconds
Table 5-6: Improvements assuming deltas are applied at individual clients
(proxy trace, relative to all status-200 responses)
[image:25.612.108.541.438.584.2]of 30%), and so the overall improvement from delta encoding is also much smaller. In other words, the utility of delta encoding depends somewhat on the large, shared cache that a proxy would provide. Alternatively, a reference stream longer than our two-day trace might show a larger fraction of per-client delta-eligible responses.
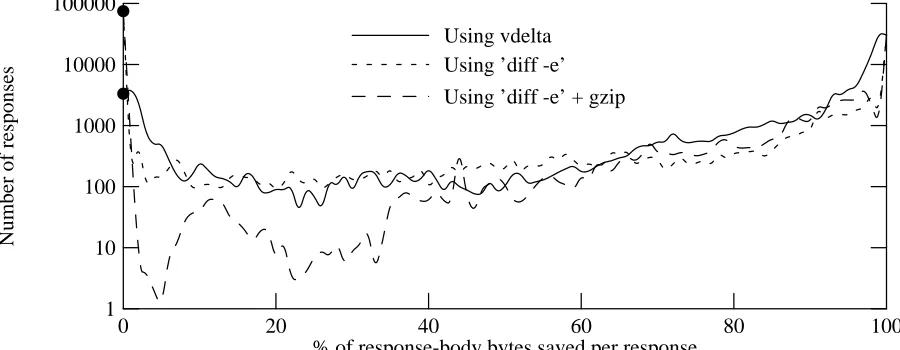
5.6. Distribution of savings
Tables 5-5 and 5-6 report mean values for improvements in the number of bytes saved, and the amount of time saved. One would not expect delta encoding to provide the same improvement for every delta-eligible response. In some cases, especially for small responses or major chan-ges, delta encoding can save only a small fraction of the bytes. In other cases, such as a small change in a large response, delta encoding can save most of the response bytes. Figure 5-6 shows the distribution of the fraction of response bytes saved, for all delta-eligible responses in the proxy trace. (Note that the vertical axis is a log scale.)
0 20 40 60 80 100
% of response-body bytes saved per response 1
100000
Number of responses 10
100 1000
10000 Using ’diff -e’
[image:26.612.70.520.276.451.2]Using ’diff -e’ + gzip Using vdelta
Figure 5-6: Distribution of response-body bytes saved for delta-eligible responses (proxy trace)
0 20 40 60 80 100
% of response-body bytes saved per response 1
100000
Number of responses 10
100 1000
10000 Using ’diff -e’
[image:26.612.59.524.281.630.2]Using ’diff -e’ + gzip Using vdelta
Figure 5-7: Distribution of response-body bytes saved for delta-eligible responses (packet trace)
most of the bytes of a response. In fact, for delta-eligible responses in the proxy trace, the median number of bytes saved per response by delta encoding using vdelta is 2177 bytes (com-pared to a mean of 4994 bytes). For half of the delta-eligible responses, vdelta saved at least 96% of the response-body bytes (this includes cases where the size of the delta is zero, because the response value was unchanged). This is encouraging, since it implies that the small overhead of the extra HTTP protocol headers required to support delta encoding will not eat up most of the benefit.
Figure 5-7 shows the corresponding distribution for the packet trace. Since this trace covers all content-types, including images, the distribution differs somewhat from that in figure 5-6, but in general, both traces produce similar distributions.
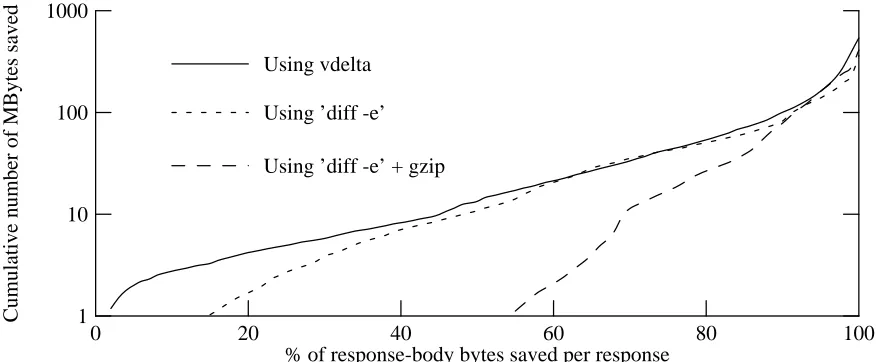
0 20 40 60 80 100
% of response-body bytes saved per response 1
1000
Cumulative number of MBytes saved
10
100 Using ’diff -e’
Using ’diff -e’ + gzip Using vdelta
Figure 5-8: Weighted distribution of response-body bytes saved for delta-eligible responses
(proxy trace)
Figure 5-8 shows the same data as in figure 5-6, except that instead of showing the number of responses improved, the vertical (logarithmic) axis shows the cumulative number of bytes saved. Essentially all of the savings comes from responses where the delta-encoded representation is less than half the size of the original representation. For example, using the vdelta algorithm, 13 Mbytes in total are saved from responses where delta encoding saves 50% of the original response body or less, but 527 Mbytes in total are saved from responses where delta encoding saves more than 50% of the original body size. This suggests that, from the point of view of network loading, it probably is not worth sending a delta-encoded response unless it is much smaller than the original.
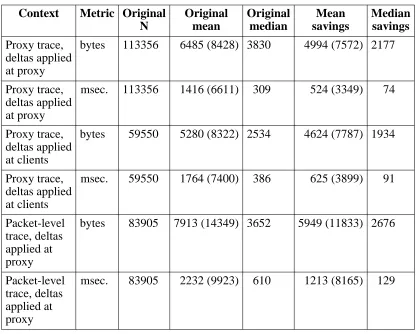
Another way to look at the distribution of the results is to look at the means, standard devia-tions, and medians of various values. Table 5-7 shows these values for all delta-eligible respon-ses in the traces, both for the original set of responrespon-ses, and after the application of vdelta (wherever it decreases the response body size, and including ‘‘unchanged’’ responses where delta-encoding eliminates all of the response body bytes).
Context Metric Original N
Original mean
Original median
Mean savings
Median savings
Proxy trace, deltas applied at proxy
bytes 113356 6485 (8428) 3830 4994 (7572) 2177
Proxy trace, deltas applied at proxy
msec. 113356 1416 (6611) 309 524 (3349) 74
Proxy trace, deltas applied at clients
bytes 59550 5280 (8322) 2534 4624 (7787) 1934
Proxy trace, deltas applied at clients
msec. 59550 1764 (7400) 386 625 (3899) 91
Packet-level trace, deltas applied at proxy
bytes 83905 7913 (14349) 3652 5949 (11833) 2676
Packet-level trace, deltas applied at proxy
msec. 83905 2232 (9923) 610 1213 (8165) 129
[image:28.612.80.497.67.401.2]Standard deviations are shown in parentheses
Table 5-7: Mean and median values for savings from vdelta encoding,
for all delta-eligible responses
For the original set of delta-eligible responses, the proxy trace shows a large standard devia-tion in the retrieval time, several times the mean value. The discussion of figure 5-4 suggests some explanations.
The results for the packet-level trace are similar, although because that trace includes images, the standard deviation of the response size is larger. This may explain why the packet-level trace also shows a larger standard deviation for retrieval time, as well.
Table 5-8 shows the same measurements as table 5-7, except that the sample sets are reduced to include only those delta-eligible responses actually made shorter by vdelta. The results in tables 5-7 and 5-8 are quite similar, because fewer than 1% of the delta-eligible responses are excluded from table 5-8.
Table 5-9 shows the means, standards deviation, and medians for all status-200 responses, both for the original responses, and after application of gzip compression (wherever it decreases the response body size).
Context Metric Original N Original mean Original median Mean savings Median savings Proxy trace, deltas applied at proxy
bytes 112164 6546 (8449) 3872 5047 (7594) 2259
Proxy trace, deltas applied at proxy
msec. 112164 1401 (6540) 308 529 (3367) 78
Proxy trace, deltas applied at clients
bytes 58640 5280 (8322) 2617 4695 (7825) 2006
Proxy trace, deltas applied at clients
msec. 58640 1739 (7316) 385 635 (3928) 97
Packet-level trace, deltas applied at proxy
bytes 80008 8190 (14514) 3812 6238 (12043) 2903
Packet-level trace, deltas applied at proxy
msec. 80008 2300 (10120) 640 1272 (8357) 161
[image:29.612.116.532.67.402.2]Standard deviations are shown in parentheses
Table 5-8: Mean and median values for savings from vdelta encoding,
for delta-eligible responses improved by vdelta
Context Metric Original N Original mean Original median Mean savings Median savings
Proxy trace bytes 377962 6797 (10212) 3973 2964 (5912) 944
Proxy trace msec. 377962 1475 (7273) 369 386 (5795) 28
Packet-level trace
bytes 817000 7948 (20468) 3258 1571 (7336) 170
Packet-level trace
msec. 817000 2513 (11731) 680 358 (4416) 9
Standard deviations are shown in parentheses
Table 5-9: Mean and median values for savings from gzip compression,
for all status-200 responses
[image:29.612.120.527.460.596.2]Context Metric Original N
Original mean
Original median
Mean savings
Median savings
Proxy trace bytes 308115 7573 (10900) 4719 3636 (6359) 1706
Proxy trace msec. 308115 1683 (7853) 475 474 (6415) 68
Packet-level trace
bytes 594734 9997 (23335) 4590 2158 (8524) 346
Packet-level trace
msec. 594734 2995 (13230) 840 492 (5169) 30
[image:30.612.86.492.71.207.2]Standard deviations are shown in parentheses
Table 5-10: Mean and median values for savings from gzip compression,
for status-200 responses improved by gzip
savings from compression are relatively small, while when delta-encoding is applicable, it often saves most of the bytes in a response (see figure 5-6).
5.7. Time intervals of delta-eligible responses
The use of deltas for a resource implies that both the client and server must store information that might otherwise not be needed. The client must store, in its cache, one or more older instan-ces of the resource, even if these would otherwise be replaced by the cache-management policy. The server must store either one or more pre-computed deltas, or one or more obsolete instances of the resources, from which deltas are computed.
How long must such extra storage be used before it pays off? That is, how long, after a response is sent, is the next delta-eligible response sent for the same resource?
1 1e+06
Time between status-200 responses for a URL
10 100 1000 10000 100000
0 6000
1000 2000 3000 4000 5000
Count
Any delta-eligible response Delta is non-empty
No change in body
1 hour
1 day
[image:30.612.82.522.462.632.2]45 hours
Figure 5-9: Time intervals for delta-eligible responses (proxy trace)
distribution for all delta-eligible responses; the dotted curve shows the distribution for those delta-eligible responses where the delta is non-empty (i.e., where the response body actually changes). The dashed curve shows the distribution for responses where the body itself did not change at all.
1 1e+06
Time between status-200 responses for a URL
10 100 1000 10000 100000
0 25
5 10 15 20
MBytes saved by vdelta
Any delta-eligible response Delta is non-empty
No change in body
4 min.
1 hour
1 day
[image:31.612.124.559.141.309.2]45 hours
Figure 5-10: Time intervals for delta-eligible responses (proxy trace),
weighted by number of bytes saved by delta encoding using vdelta
Figure 5-10 shows the same distributions, except that the vertical axis shows the number of bytes saved by using vdelta to produce delta encodings.
The distributions all show strong peaks at 3600 seconds (1 hour). This suggests that a lot of the delta-eligible responses are generated by ‘‘push’’ applications, which involve periodic up-dates of information such as stock quotes, news headlines, etc. Another peak appears at about 12 hours, which might also be caused by push applications.
Because the proxy trace lasted only 45 hours, the distributions in figure 5-9 obviously cannot include any intervals longer than that. Generally, one would expect that the distribution might include an artificially low number of intervals whose duration is more than half the length of the entire trace. Therefore, we would need to examine the time intervals from a much longer trace to determine if, as implied by the figure, most of the benefit from delta-encoding comes from rela-tively short intervals.
However, 90% of the density in the distribution is concentrated at intervals below about 14 hours (50,400 seconds). Even if one ignores the strong peaks at 1 hour and 12 hours, the bulk of the intervals shown in figure 5-9 are only a few hours long. The distributions in figure 5-10, weighted by the number of bytes saved, are even more skewed to relatively short durations. This suggests that if clients and servers can cache obsolete responses for just a few hours, they should obtain most of the available benefit from delta-encoding.
5.8. Influence of content-type on coding effectiveness
The output size of delta-encoding and data-compression algorithms depends on the nature of the input [10, 13], and so, in the case of HTTP, on the content-type of a response. The effec-tiveness of delta encoding also depends on the amount by which the two versions differ, which might also vary with content-type. We subdivided the packet-level traces by content-type and analyzed each subset independently, to see how important these dependencies are in practice.
Content-type References MBytes Mean
size
Median size
Mean time
Median time
All status-200 817000 (100%) 6193 7948 3258 2513 680
image/gif 434277 (53%) 2221 5362 2161 1896 590
text/html 184634 (23%) 1271 7216 3951 2821 720
image/jpeg 106022 (13%) 1513 14963 6834 4099 1260
application/ octet-stream
75780 (9%) 803 11113 4785 2533 660
text/plain 6988 (1%) 67 10057 3055 2799 601
image/other 2328 (0%) 9 4113 1408 1165 280
application/ x-msnwebqt
401 (0%) 0 344 302 235 120
application/
other
3789 (0%) 146 40482 748 8357 384
video/* 225 (0%) 88 409032 359012 58148 26075
text/other 45 (0%) 0 3701 2754 1509 471
other or unknown
2509 (0%) 75 31404 4224 6073 950
[image:32.612.56.521.171.486.2]Sizes are in bytes, except as noted; times are in msec.
Table 5-11: Breakdown of status-200 responses by content-type (packet-level trace)
Table 5-11 shows the distribution of status-200 responses by content-type. A significant majority of the responses (both by count and by bytes transferred) are images, either GIF or JPEG.
Table 5-12 shows the distribution of delta-eligible responses by content-type. Although about 19% of the status-200 HTML responses are delta-eligible, only 3% of the status-200 GIF respon-ses are.
Content-type References % of same-type status-200 responses
MBytes % of
same-type status-200 Mbytes
Mean size (bytes)
All delta-eligible 83905 10.3% 633.1 10.2% 7913
text/html 35066 19.0% 282.3 22.2% 8440
application/octet-stream 31536 41.6% 237.5 29.6% 7898
image/gif 14162 3.3% 80.9 3.6% 5992
image/jpeg 2058 1.9% 24.9 1.6% 12711
text/plain 479 6.9% 1.5 2.2% 3335
application/x-msnwebqt 256 63.8% 0.1 100.0% 386
application/other 143 3.8% 2.3 1.6% 16842
image/other 83 3.6% 0.1 4.4% 855
[image:33.612.115.534.69.320.2]other or unknown 122 4.9% 3.5 4.7% 30165
Table 5-12: Breakdown of delta-eligible responses by content-type (packet-level trace)
Content-type Delta-eligible responses
MBytes Total time
Responses unchanged
Bytes unchanged
Time wasted
All delta-eligible 83905 633 187303 12.0% 7.9% 0.9%
text/html 35066 282 96128 4.2% 3.2% 1.2%
application/octet-stream 31536 238 61743 0.1% 0.0% 0.0%
image/gif 14162 81 22415 52.1% 36.4% 1.6%
image/jpeg 2058 25 4844 50.9% 41.5% 1.8%
text/plain 479 2 422 19.8% 17.9% 6.9%
application/x-msnwebqt 401 0 94 0% 0% 0%
application/other 143 2 473 25.2% 20.3% 3.3%
image/other 83 0 115 3.6% 11.5% 0.1%
other or unknown 170 4 1045 32.9% 30.4% 6.1%
Table 5-13: Summary of unchanged response bodies by content-type (packet-level trace)
‘‘text/plain’’ responses, but the ‘‘text/plain’’ responses that remain unchanged are smaller than the ‘‘text/plain’’ responses that do change. The last column shows a conservative estimate for the amount of time wasted in the transmission of unchanged responses.
[image:33.612.95.559.352.571.2]Content-type Delta-eligible Responses
MBytes Total time
Responses improved
Bytes saved
Time saved
All content-types 83905 633 187303 95.1% 75.0% 54.2%
text/html 35066 282 96128 100.0% 93.6% 61.6%
application/octet-stream 31536 238 61743 100.0% 83.6% 63.0%
image/gif 14162 81 22415 71.3% 7.8% 8.6%
image/jpeg 2058 25 4844 99.8% 8.9% 8.9%
text/plain 479 2 422 99.6% 84.1% 32.2%
application/x-msnwebqt 256 0 65 100.0% 80.2% 0.5%
application/other 143 2 473 89.5% 15.8% 11.0%
image/other 83 0 115 100.0% 84.0% 13.0%
[image:34.612.57.520.70.293.2]other or unknown 122 4 1099 99.2% 50.9% 73.1%
Table 5-14: Summary of savings by content-type for delta-encoding with vdelta,
(all delta-eligible responses in packet-level trace)
the ‘‘image/gif’’ and ‘‘image/jpeg’’ responses, albeit not reducing the byte-counts by very much (both these image formats are already compressed). We suspect that the savings may come from eliding redundant header information in these formats.
The apparent scarcity of delta-eligible images greatly reduces the utility of delta encoding when it is viewed in the context of the entire reference stream. However, we believe that in many bandwidth-constrained contexts, many users avoid the use of images, which suggests that delta encoding would be especially applicable in these contexts.
Table 5-15 shows the effectiveness of compression, using the gzip program, broken down by content-type. Although a majority of the responses overall were improved by compression, for some content-types compression was much less effective. It is not surprising that ‘‘image/gif’’ and ‘‘image/jpeg’’ responses could not be compressed much, since these formats are already compressed when generated. The ‘‘application/x-msnwebqt’’ responses (used in a stock-quote application) compressed nicely, but doing so would not save much transfer time at all, because the responses are already quite short.
5.9. Effect of clustering query URLs
Content-type Responses MBytes Total time
Responses improved
Bytes saved
Time saved
All status-200 816998 6193 2053027 72.8% 19.8% 14.3%
image/gif 434277 2221 823214 55.7% 4.6% 3.0%
text/html 184634 1271 520817 99.7% 68.8% 41.5%
image/jpeg 106022 1513 434607 99.1% 2.8% 2.5%
application/octet-stream 75780 803 191968 66.0% 10.3% 12.2%
text/plain 6988 67 19561 95.2% 55.6% 30.1%
image/other 2328 9 2713 98.6% 47.1% 27.4%
application/other 3789 146 31665 59.9% 28.8% 13.1%
application/x-msnwebqt 401 0 94 99.5% 56.3% 0.4%
video/* 225 88 13083 93.3% 12.6% 11.0%
text/other 45 0 68 100.0% 71.7% 38.1%
[image:35.612.97.547.69.333.2]other or unknown 2509 75 15236 77.0% 35.0% 33.3%
Table 5-15: Summary of gzip compression savings by content-type
(all status-200 responses in packet-level trace)
Housel and Lindquist [9], in their paper on WebExpress, point out that in many cases, the individual responses to different queries with the same ‘‘URL prefix’’ (that is, the prefix of the URL before the ‘‘?’’ character) are often similar enough to make delta encoding effective. Since users frequently make numerous different queries using the same URL prefix, it might be much more effective to compute deltas between different queries for a given URL prefix, rather than simply between different queries using an identical URL. Banga et al. [2] make a similar obser-vation. We will refer to this technique as ‘‘clustering’’ of different query URLs with a common prefix. (Such clustering is done implicitly for POST requests, since POST requests carry mes-sage bodies, and so the response to a POST may depend on input other than the URL.)
The WebExpress paper did not report on the frequency of such clustering in realistic traces. We found, for the proxy trace, that the 100780 distinct query URLs could be clustered using just 12004 prefix URLs. Further, of the 86191 status-200 responses for query URLs, only 28186 (33%) were delta-eligible if the entire URL was used, but 76298 (89%) were delta-eligible if only the prefix had to match.
Computation
Improved References
MBytes saved
Retrieval time saved
unchanged 9285 (10.8%) 12 (3.2%) 1575 (1.1%) diff -e 4925 (5.7%) 27 (6.8%) 3437 (2.4%)
diff -e | gzip 5112 (5.9%) 34 (8.8%) 5226 (3.7%)
vdelta 18876 (21.9%) 61 (15.3%) 12217 (8.7%)
[image:36.612.132.445.74.180.2]N = 86191, 419 MBytes, 141076 seconds
Table 5-16: Improvements relative to all status-200 responses to queries
(no clustering, proxy trace)
Computation
Improved References
MBytes saved
Retrieval time saved
unchanged 14044 (16.3%) 6 (1.6%) 1145 (0.8%)
diff -e 38890 (45.1%) 97 (24.4%) 9800 (6.9%)
diff -e | gzip 40438 (46.9%) 226 (56.6%) 18015 (12.8%)
vdelta 60711 (70.4%) 262 (65.6%) 24817 (17.6%)
diff -e (inc. unchanged) 52934 (61.4%) 103 (25.9%) 10946 (7.8%)
vdelta (inc. unchanged) 74755 (86.7%) 268 (67.2%) 25962 (18.4%)
N = 86191, 419 MBytes, 141076 seconds
Table 5-17: Improvements when clustering queries
(all status-200 responses to queries, proxy trace)
6. Including the cost of end-host processing
The time savings calculation described in section 5.4 omits any latency for creating and apply-ing deltas, or for compressapply-ing and decompressapply-ing responses. Since these operations are not without cost, in this section we quantify the cost of these operations for several typical hardware platforms. We chose three systems: a 50 MHz 80486 (running BSD/OS, SPECint92 = 30), which would now be considered very slow; a 90 MHz Pentium (running Linux, SPECint95 = 2.88); and a 400 MHz AlphaStation 500 (running Digital UNIX V3.2G), SPECint95 = 12.3). The 90 MHz Pentium might be typical for a home user, and the 400 MHz AlphaStation is typical of a high-end workstation, but by no means the fastest one available.
Text Non-text
Computation Mean Std. dev. Mean Std. dev.
diff -e 72 57 ∅ ∅
ed 90 64 ∅ ∅
both steps above 40 30 ∅ ∅
diff -e | gzip 34 29 ∅ ∅
gunzip | ed 15 14 ∅ ∅
both steps above 10 9 ∅ ∅
vdelta 63 46 89 61
vupdate 100 97 177 176
both steps above 38 29 56 40
gzip 73 43 57 32
gunzip 145 124 139 110
both steps above 47 31 40 24
vdelta (compress) 102 57 86 46
vupdate (decomp) 181 155 250 264
both steps above 64 41 61 39
[image:37.612.154.501.69.410.2]Values are in Kbytes/sec., based on elapsed times ∅: not applicable
Table 6-1: Compression and delta encoding rates for 50 Mhz 80486 (BSD/OS 2.1)
program; deltas and compressed output created by vdelta are fed to the vupdate program.) For deltas, the throughput is calculated based on the average size of the two input files.
We also show the standard deviations of these values. The deviations are large because there is a large fixed overhead for each operation that does not depend on the size of the input, and so throughputs for the larger files are much larger than the means. Much of this fixed overhead is the cost of starting a new process for each computation (which ranges from 15 to 34 msec. on the systems tested). However, since several of the delta and compression algorithms already exist as library functions, an implementation could easily avoid this overhead2. The last three lines in tables 6-2 and 6-3 show measurements of a library version of the vdelta and vupdate algorithms on two of the tested platforms. The results of these tests suggest that simply eliminating the use of a separate process reduces overheads by an order of magnitude. Although the Alpha’s perfor-mance for the non-library versions of vdelta and vupdate are poor, relative to the much slower
2The existing versions of the ‘‘diff -e’’ command generates output that is not entirely compatible with the ed