ANALYSIS OF LARGE-SCALE CROWD EVACUATION
MODELLING
1MARTIN LOPUŠNIAK
1TU Košice, Department of Building Physics, Slovakia
E-mail: [email protected]
ABSTRACT
Evacuation models are used for building designs, but also for analyses of uncommon events, which happened. Results of these analyses show us a big amount of data, which provide us a view to evacuation process. Despite the knowledge that the evacuation is a complex problem, which depends on many factors, there is a question whether there are general evaluation parameters for seemingly different evacuations, which could be applicable for all cases. The paper describes the analysis of 58 different evacuation scenarios performed by the buildingEXODUS evacuation model. The focus is oriented for finding relationships between chosen evaluation parameters. The results showed that there are also mutual evaluation parameters, by which evacuations in any building can be described. The results showed there are differences between evacuations, and so it is needed to differentiate a vertical evacuation and horizontal evacuation.
Keywords: Evacuation, Modeling, Building, Analysis, Scenario
1. INTRODUCTION
Current requirements of developers on building design and architecture emphasize especially multifunctionality of buildings. This results in buildings containing business outlets, housing, lodging, entertainment and other establishments, all under one roof. Such buildings have to serve various operations, staffs and activities. Building design thus becomes very demanding and the application of prescriptive codes is inefficient; in numerous cases, it is quite impossible to design such buildings in compliance with technical standards. A way to tackle the problem is to use the principles of engineering approach to design. One of these approaches is the utilization of mathematical models and simulations.
Taking into account the variety of buildings and their size, ensuring safe evacuation from them is a challenging task. Simplified evacuation models do not allow prediction, description, or graphical presentation of the evacuation process [1]. The only option is to utilize evacuation models. The development of evacuation models started in 1950s. Several authors [2], [3], [4], [5], [6] have described the principles of evacuation models, their classification, advantages and disadvantages. At present, there exist more than 50 models of different type and nature.
Fire engineering requirements differ for every country. Evacuation models allow us to analyze evacuation of people in emergencies. The analysis leads to optimization of evacuation routes in the building. The emergency escape routes have to be designed in the manner that allows smooth evacuation, preventing the formation of congested areas, so that the required safety egress time (RSET) is as short as possible. Evacuation models are able to perform this task.
Researchers most frequently pay attention to parameters of activities and movement characteristics during evacuation. They analyze horizontal movement of persons and movement up/down staircases, exiting doors, encounters of persons, their movement on escalators, possibility of the usage of elevators, etc. Their research is based on experiments with a certain number of people. The results are consequently used in development or update of evacuation models [7], [8] or for their validation [9].
From the building design point of view, it is important to design a sufficient number of exits and staircases of appropriate capacity. In large buildings, numerous evacuation scenarios can be considered. The question remains, whether it is possible to assess evacuation efficiency based on the evacuation model outputs and whether there exist any common indicators for evacuation from various types of buildings.
The paper presents findings achieved from modelling evacuation of four highly populated buildings (510 – 2200 persons). Its aim is to find and describe common key features of various evacuation scenarios, or to prove that evacuation is so specific that it is impossible to find common features or formulate a generalizing conclusion.
2. RESEARCH METHODS
2.1 Buildings
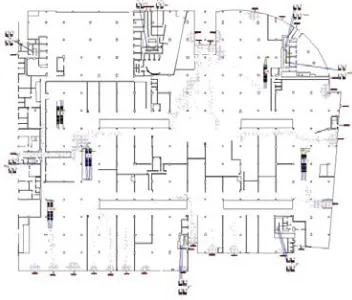
[image:2.612.318.521.181.336.2]Four buildings of various shapes and nature were considered. All of the buildings actually exist. Three of them are in operation (B1, B2, B4) and one is being constructed (B3).
Figure 1: Floor plan of B1 – ground floor
B1 (Fig. 1) is an administrative/shopping complex. It is comprised of a high-rise administrative building (11 floors, labelled as AB) and a shopping center covering large area (three floors, especially restaurants, retail outlets, cafes, labelled as SC). Evacuation of the building involves horizontal movement and descending the staircase. The total population considered is 16,143 occupants.
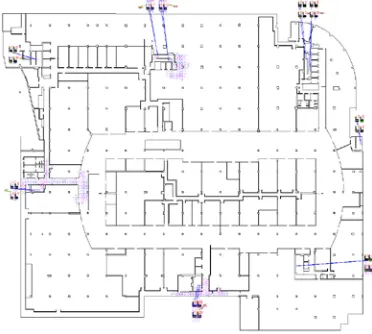
Figure 2: Floor plan of B2 – ground floor
[image:2.612.93.299.375.432.2]B2 (Fig. 2) is a shopping center. It contains especially restaurants, cafes and retail outlets. The specific feature of this building is that besides horizontal movement and descending the stairs, the evacuation requires also ascending the stairs. The total population considered amounts to 11,304 occupants.
Figure 3: Floor plan of B3 – ground floor
B3 is a football stadium (Fig. 3). For the analysis purposes, it is regarded as a 3-storey building. The upper spectator area represents the third floor. The first floor is the lower spectator area. The second floor is an empty area to which occupants of the third and first floor are evacuated. The total population considered is 22,007 occupants.
Figure 4: Typical floor plan and section of B4
[image:2.612.316.519.461.650.2] [image:2.612.105.281.563.713.2]movement and descending down the stairs. The total population considered is 510 occupants.
2.2 Evacuation Model
The tool used for analysis is the buildingExodus (BE) evacuation model [12] and its tools. It is a simulation model based on probabilistic behaviour. It features a comprehensive analysis of evacuation of individuals from environment with or without fire. The usage of four basic submodels enables specification of task according to various requirements. General description of the model is presented in literature [13], [14], [15]. The model has already been used in several significant studies and analyses [16].
2.3 Input Data
Simulations were performed using various scenarios. The scenarios were generally determined by national standards [17] for evacuation solutions. Also scenarios that were not related to national standards were performed, representing purely hypothetical situations. Some scenarios were consecutively modified, using the findings acquired from the simulations themselves. Detailed description of scenarios is presented further below. There were 58 evacuation scenarios in total.
The input data specified below were used for simulation of all scenarios. The scenarios did not consider the influence of fire hazards. This was due to lack of input data as well as the complexity of the task. BE enables modelling evacuation considering the aspects of fire hazard [14], [18] however, there are only few studies considering a combination of fire hazard effects and evacuation. In spite of that, 8 scenarios in B4 considered the effects of combustion products on the process of evacuation. The scenarios of fire development were purely hypothetical. The aim of the modification was to monitor the decreasing travel speed caused by reduced visibility on the escape route. The simulation did not consider the effects of toxins or increased temperatures on the evacuees. Only the visual effect of smoke was considered, not any irritating substances smoke might contain. The influence of smoke on the visibility was based on the work of Jin [19].
Response time in B1, B2, B3 and B4 considered was tr = 0s. The reasons are twofold.
Firstly, the evacuation route design standard in Slovakia does not consider response time. Secondly, it was assumed that evacuation starts immediately after initial notification of a fire event without any delay.
Escalators are considered as static stairs in all of our simulations. In some of the scenarios, they can be used by evacuees, whilst in others they cannot be used at all. This reflects the fact that in actual incidents, the usage of escalators sometimes cannot be prevented, even when they are shut down after the announcement of evacuation. The reason for their restricted use is that a static escalator does not have the standard dimensions of a regular staircase. As a result, the movement along a static escalator is not safe; it may result in a fall and slow down the evacuation.
Two types of escape routes are used in fire design – unprotected escape route (UER) and protected escape route (PER). UER means that the occupants are moving in an area that is not protected from the effects of fire. On the other hand, in case of PER, the occupants are moving within a fire compartment.
Two different sets of travel speeds were considered in simulations. The first set conforms to the national standard, as follows: horizontal speed of 0.5 m/s; stair descend 0.41 m/s; stair ascend 0.33 m/s. The second set corresponds with the default travel speeds implemented in BE: horizontal movement between 1.2 – 1.5 m/s; stair ascend between 0.67 – 0.72 m/s; stair descend between 0.75 – 0.84 m/s.
All simulations were performed with the default setting of evacuees’ behaviour in the evacuation model [20]. Settings different form the default ones were considered only when necessary. Changes were implemented according to manual recommendations.
The number of occupants was determined according to project documentation, which corresponds to design standard valid in Slovakia. Slovakia has a standard determining the number of occupants for the purpose of building evacuation solutions.
2.3 Evacuation scenarios
2.3.1 Building 1
24 evacuation scenarios were created for B1. Each scenario used calculations labelled with the following calculation codes:
P – Population: varying occupancy; P1 – all evacuees (total of 16,143 people); P2 – occupants of AB part only (total of 1,830 people); P3 – occupants of SC only (total of 14,313 people); P4 – only 5th floor occupants (total of 244 people).
M – Movement: M1 – default values from buildingExodus; M2 – national standard.
E – Environment: E1 – basic scenario, occupants use the nearest possible door or exit available; E2 – all escape routes and all exits are available, escalators cannot be used for egress; E3 – all escape routes and all exits are available, escalators cannot be used for egress; persons on the 3rd floor of SC can use the staircase of AB; E4 – 1st floor occupants have available only main exits, escalator from 3rd to 2nd floor cannot be used, occupants of 3rd floor of SC cannot use the AB staircase; E5 consecutive evacuation from floors 4 – 11 with time span of 120s per floor; E6 – similar to E5, with gradual evacuation with time span of 60s; E7 – evacuation of SC only, escape from the 1st floor possible through main exit only, with side exits closed; E8 – evacuation of SC only, escape from the 1st floor possible through main exit only, with side exits closed, 3rd floor SC occupants can use the staircase of AB; 2nd and 3rd floor occupants predominantly use PER; E9 – evacuation of SC only, escape from the 1st floor possible through main exit only, with side exits closed, 3rd floor SC occupants can use the staircase of AB; 2nd floor occupants use the nearest available door or escalator; E10 – modification of occupants’ direction based on findings form E9.
2.3.2 Building 2
Five evacuation scenarios were created for B2. Each scenario used calculations labelled with the following codes:
B2S1 is the basic scenario with all floors fully occupied (11,304 people) and simultaneous evacuation; default values for movement from buildingExodus are used; occupants use the nearest possible door or exit available. B2S2 scenario is similar to B2S1, however, movement and door flow values correspond to the national standard. B2S3 is a modification of B2S2 scenario, in which the occupants cannot use escalators for evacuation. B2S4 scenario involves only evacuation from the basement floor as the most populated and most critical part of the building. B2S5 is a modification of B2S1, in which the width of door on the 1st floor leading to an empty area was changed from 900
mm to 1,500 mm for staircase S1, whose flight width is 1,650 mm.
2.3.3 Building 3
7 evacuation scenarios were created for B3. Each scenario used calculations labelled with the following calculation codes:
B3S1 is the basic scenario with full occupation (22,007 people); simultaneous evacuation; occupants predominantly use the nearest possible building exit available; Movement and door flow values correspond to the national standard. B3S2 scenario is identical to B3S1; Movement and door flow default values from Exodus are used. B3S3 is an evacuation scenario in which only lower spectator area is occupied (10,956 people); simultaneous evacuation; occupants predominantly use the nearest possible building exit available; occupants use also the possibility of evacuation to the football field; Movement and door flow values correspond to the national standard. B3S4 is an alternative to B3S1 in which two modules of spectator area are occupied by 870 people. B3S5 is a modification of B3S4; evacuation to the football field is also possible. B3S6 is a modification of B3S4; one more escape lane was made available for the lower terrace staircase (increase from 3 to 4); B3S7 is a modification of B3S6 by creating two lanes on one staircase (by inserting banisters).
2.3.4 Building 4
24 scenarios were created for B4. Each scenario used calculations labelled with the following calculation codes:
R – Response: R1 – response time: 0 s; R2 – response time: 30 - 60 s; R3 – response time: 30 - 90 s; R4 – response time: 30 – 120 s; R5 – response time: 30 – 150 s; R6 – response time: 30 – 180 s;
P – Population: varying occupancy; P1 – 340 people evenly distributed to all floors; P2 – 510 people evenly distributed to all floors; P3 – 170 people evenly distributed to all floors; P4 - 340 people evenly distributed to all floors, 34 of which were occupants with mobility impairments ranging from 25 to 50%, located on 3rd and 4th floor.
M – Movement: M1 – default setting of evacuees’ movement characteristics; M2 – evacuees’ movement characteristics conforming to standard,
G – Geometry: G1 – both exits to an empty area are available for evacuation; G2 – only one exit to an empty area is available for evacuation.
reduced visibility in the escape routes. In case of E7 alternative, a calculation algorithm was used, which enables determination of the percentage of people who use other than priority exit due to reduced visibility. In this modification, 40% of all occupants changes direction when the visibility is lower than 2 m. All modifications used a smoke load that reduced visibility to 1.15 m. This value is purely theoretical and does not represent any actual event.
E1 – environment without any smoke load; E2 – staircase from 1st to 12th floor with smoke load; E3 – hallway on the 8th floor with smoke load; E4 – hallway on the 12th floor with smoke load; E5 – staircase from 1st to 6th floor with smoke load; E6 – staircase from 1st to 3rd floor with smoke load; E7 – staircase from 1st to 6th floor with smoke load + 40% escapees diverted to the opposite staircase; E8 – staircase from 9th to 12th floor with smoke load; E9 – staircase from 6th to 12th floor with smoke load.
3. RESULTS
The results are presented in two groups. The first one contains mutual comparisons of all scenarios. The second presents the most important findings about the evacuation of people from individual buildings. The main evaluation parameters included the required safety egress time (RSET), cumulative wait time (CWT), personal elapsed time (PET) and distance travelled (DIS). Average values are labelled with letter ‘a’, like in ‘PETa’. Mutual relationships between the parameters are also analyzed.
The results have shown that it is possible to find common aspects of all evacuation scenarios considered, but also that horizontal and vertical evacuation has to be distinguished. In vertical evacuation (VE) the evacuees predominantly use the stairs, while in horizontal evacuation (HE), horizontal movement prevails over the use of stairs. The classification is based on results presented in Figure 14, which quotes the following ratios PETa/RSET; CWTa/PETa.
The PETa/RSET ratio of in case of VE is at least 50% except for cases when fire hazard was considered (B4). However, even in such case the PETa/RSET ratio did not decrease below 40%. On the contrary, in case of HE, the PETa/RSET ratio is never higher than 50% and only in 8 out of 20 cases exceeded 40%. If the ratio is lower than 50%, it is apparent that the distribution will differ from a normal distribution. From the analysis point of view, this indicates that there must be an area in the building with higher than average congestion.
[image:5.612.312.523.246.416.2]The evacuation is best described by ratio CWTa/PETa ratio (Fig. 6). If we compare CWTa/PETa for HE and VE, it is obvious that in case of HE, the ratio is always higher than 40%. The highest value reached 80% and average value is 57%. In case of VE, the average ratio value is 20% and the highest value is 55%. Galea [11] claims that this ratio expresses evacuation inefficiency and its value should not be higher than 50%. If the CWTa/PETa ratio exceeds 50%, it indicates that evacuees spent a lot of time in congestion. This results in higher PET value and inefficient evacuation.
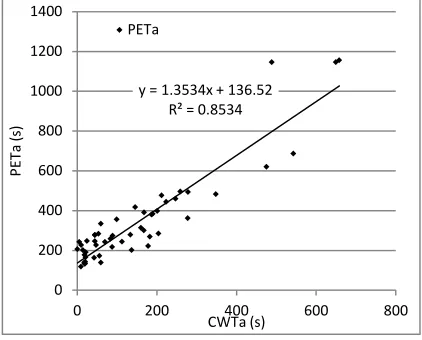
Figure 5: Relation between CWTa and PETa
Linear dependence can be observed between CWT and PET (Fig. 5) with correlation of 0.85. If we consider only VE, the dependence is more significant, with correlation of 0.95 (Fig. 6). In case of HE, the correlation is 0.77. This indicates that the progress of VE can be optimized by shortening CWT.
Figure 6: Relation between CWTa and PETa for VE
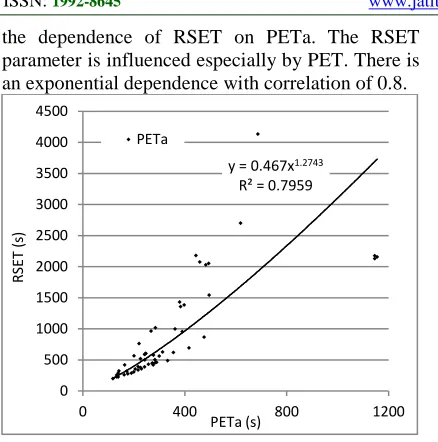
The decrease of PET results in shorter RSET, as can be seen in Figure 7, which presents
y = 1.3534x + 136.52 R² = 0.8534
0 200 400 600 800 1000 1200 1400
0 200 400 600 800
PE
Ta
(s
)
CWTa (s) PETa
y = 1.6242x + 147.41 R² = 0.9516
0 200 400 600 800 1000 1200 1400
0 200 400 600 800
PET
a
(s
)
the dependence of RSET on PETa. The RSET parameter is influenced especially by PET. There is an exponential dependence with correlation of 0.8.
Figure 7: Relation between PETa and RSET
[image:6.612.89.308.81.302.2]However, in case of VE, the correlation is 0.86 (Fig. 8) and in case of HE, the correlation is 0.84 (Fig. 9). This proves the different nature of VE and HE.
Figure 8: Relation between PETa and RSET for VE
[image:6.612.89.299.356.540.2]In case of VE, we noticed also linear dependence of PETa on DISa (Fig. 10) with correlation of 0.9577, which indicates that with increased average egress time, PET increases as well. This is a logical conclusion, since the time needed for travelling a certain distance increases with the length of the trajectory. Nevertheless, in case of evacuation influenced by various other factors, especially flow capacities, finding a significant dependence is interesting.
Figure 9: Relation between PETa and RSET for HE
This dependence does not apply to HE. By contrast, it was observed that PETa decreased with longer trajectories. This proves that HE solutions require different approach, and factors influencing the evacuation are different from those related to VE.
Figure 10: Relation between DISa and PETa for VE
Other interesting relations that confirm the importance of selected evaluation parameters include the dependence of RSET on the PETa/RSET ratio (Fig. 11).
This ratio formed the basis for distinguishing VE and HE. This dependency is not statistically significant; however, it indicates that with lower PETa/RSET ratio the evacuation time increases. The lower the ratio, the more certain it is that there must be an area within the escape route that slows traffic of some evacuees and thus prolongs the egress time. This phenomenon is specific for HE, as can be seen from Figure 14. Especially results of horizontal evacuation in B1 are inconvenient form this point of view and it can
y = 0.467x1.2743 R² = 0.7959
0 500 1000 1500 2000 2500 3000 3500 4000 4500
0 400 800 1200
RS
ET
(s
)
PETa (s) PETa
y = 242.87e0.002x R² = 0.8564
0 500 1000 1500 2000 2500 3000
0 500 1000 1500
RS
ET
(s
)
PETa (s) RSET
y = 207.83e0.0045x R² = 0.84
0 500 1000 1500 2000 2500 3000 3500 4000 4500 5000
0 200 400 600 800
RS
ET
(s)
PETa (s) RSET
y = 7.8936x - 613.81 R² = 0.9505
0 200 400 600 800 1000 1200 1400
0 50 100 150 200 250
PET
a
(m
/s
)
DISa (m)
[image:6.612.313.520.357.527.2]be stated that the building design does not allow efficient evacuation.
Figure 11: Relation between ratio PETa/RSET and RSET
[image:7.612.88.298.414.584.2]The above mentioned CWTa/PETa ratio influences also the traffic speed of the evacuees. Figure 12 presents the results of simulations which used national standards as input values. Maximum possible flow speed was 0.5 m/s. Correlation is 0.83. With increasing CWTa/PETa ratio value, the flow speed of evacuees decreases linearly. Once again, it can be stated that evacuation in which the CWTa/PETa ratio is lower than 50 % is inefficient.
Figure 12: Relation between ratio CWTa/PETa and movement speed
4. DISCUSSION
The presented results suggest that there are some common aspects of evacuations from different buildings. The selected evaluation parameters offered by evacuation model BE allow performing detailed analysis of the evacuation and drawing conclusions. The research shows that seemingly different buildings and evacuation conditions have some common characteristics.
The CWTa/PETa ratio expresses the efficiency of evacuation. This value must be higher than 50% for evacuation to be efficient. As mentioned above, in vertical evacuation, PET depends significantly on CWT. Therefore, decrease in PET results in shorter RSET. Nevertheless, this cannot be expressly said about horizontal evacuation. The achieved results do not allow us to specify the decisive factor determining the evacuation efficiency. In case of HE, this might be a combination of various factors. If the CWTa/PETa ratio exceeds 50%, it is necessary to propose solutions that will decrease it below 50% and shorten PET.
Most simulation scenarios considered realistic situations. However, many more evacuation scenarios of various probability degrees could be proposed for each building. Various input details could also be used, conforming to national standards of different countries. For instance, according to Slovak prescriptive code, the maximum value of horizontal speed is 0.5 m/s. Numerous evacuation models, including BE, use higher values. It is generally held that the more congested areas occur on the route, the lower the flow speed is. However, if we use low speed values, this results in decreased CWTa, since evacuees approach bottlenecks more slowly, i.e. they spend less time in congestion.
In terms of general comparison of evacuations we can state that the main feature of horizontal evacuation is concentration of evacuees at the stairs descending to lower floors. It frequently occurred that some staircases were free, while others were highly congested (Fig. 13). This caused a decrease of the PETa/RSET ratio below 30%.
Figure 13: Situation during evacuation in B2 at time t = 720 s, 4 of 7 stairs are free and 3 are in high congestion.
y = 239248x-1.558 R² = 0.5848
0 500 1000 1500 2000 2500 3000 3500 4000 4500
0 20 40 60 80
RS
ET
(s
)
PETa/RSET
PETa/RSET
y = -0.0044x + 0.4552 R² = 0.8284 0
0.05 0.1 0.15 0.2 0.25 0.3 0.35 0.4 0.45 0.5
0.0 20.0 40.0 60.0 80.0 100.0
Sp
eed
(m
/s
)
[image:7.612.324.510.523.690.2]Especially in case of horizontal evacuation, it cannot be predicted that evacuees will use other than preferred exit. This option strictly depends on the evacuation organization. If people are not aware that something is happening at a certain place of their route, they will not change direction. A certain form of social interaction is present, as they share knowledge and information. This is manifested by the fact that even if evacuees are informed a certain route is safe, they rather wait than move towards the unknown. Heliövaara [21] claims that people tend to linger at the exit regardless of having the possibility of using a different route. He also states that egoistic behaviour may, though does not have to shorten the egress time, depending on the environment geometry. BuildingExodus provides the possibility of such modification; however, its impacts need to be further examined.
It is explicit that vertical evacuation depends on the staircase capacity, length of the escape route and the flow speed on the staircase. From this point of view, it is easier to optimize VE than HE.
5. CONCLUSION
Only comprehensive evacuation models that provide detailed data analysis can be used for evacuation analysis concerning a large-scale crowd. These models offer a wide range of data that serve for selection of evaluation parameters describing the evacuation process. Correct interpretation enables us to optimize the evacuation process and thus increase its efficiency.
Our research involved monitoring and comparing different evaluation parameters describing several simulations of large-scale crowd evacuations from various buildings, using buildingExodus evacuation model. It can be claimed that even seemingly disparate evacuations have some common evaluation parameters which well describe the evacuation process.
Evacuation is best described by the CWTa/PETa ratio, which expresses its efficiency. If the ratio exceeds 50%, the evacuation is inefficient. It has been proved that PET is significantly dependent on CWT. If PET decreases, RSET shortens as well.
The PETa/RSET ratio is also a valuable evaluation parameter, whose value exceeding 50% indicates that there are areas with arising congestion within the building.
In spite of the existence of common evaluation parameters, it is necessary to distinguish
horizontal evacuation (with dominating horizontal movement and a partial use of stairs) and vertical evacuation (with dominating stair descend/ascend). In case of vertical evacuation, some additional dependencies were observed which were not present in horizontal evacuation. Horizontal evacuation is influenced by several factors, which cannot be uniquely determined. When optimizing horizontal evacuation, attention should be paid to the number and location of staircases, since after certain time, some of them become overloaded, while others are underloaded.
REFRENCES:
[1] A.U.K. Wagoum, M. Chraibi, J. Mehlich, A. Seyfried, and A. Schadschneider, “Efficient and validated simulation of crowds for an evacuation assistant”, Computer Animation and Virtual Worlds, Vol. 23, No. 1, pp. 3-15. [2] S. Gwynne, E.R. Galea, M. Owen, P.J.
Lawrence, and L. Filippidis, “A review of the methodologies used in the computer simulation of evacuation from the built environment”, Building and Environment, Vol. 34, No. 6, pp. 741-749.
[3] G.K. Still, “Review of pedestrian and evacuation simulations”, International Journal of Critical Infrastructures, Vol. 3, No. 3-4, pp. 376-388.
[4] H.T.L. Pham, J.L. Pittman, and M.C. Court, “A review of simulation modelling methodologies for large-scale evacuations”, Summer Computer Simulation Conference 2008 (SCSC 2008), Edinburgh, June 16-19, 2008, pp. 219-226.
[5] E.D. Kuligowski, R.D. Peacock, B.L. Hoskins, A review of building evacuation models, [online], Available from: http://fire.nist.gov/bfrlpubs/
[6] M. Kobes, I. Helsloot, B. de Vries, and J.G. Post, “Building Safety and Human Behaviour in Fire: A Literature Review”, Fire Safety Journal, Vol. 45, No. 1, pp. 1-11.
[7] Z. Wang, "Public Evacuation Process Modelling and Simulation Based on Cellular Automata," Journal of Theoretical and Applied Information Technology, Vol. 48, No. 3, pp. 1498-1505.
[9] V. Papinigis, E. Geda, and K. Lukošius, "Design of People Evacuation from Rooms and Buildings." Journal of Civil Engineering and Management, Vol. 16, No. 1, pp. 131-139.
[10] E.D. Kuligowski, R. D. Peacock, and J. D. Averill, "Modelling the Evacuation of the World Trade Center Towers on September 11, 2001," Fire Technology, Vol. 49, No. 1, pp. 65-81.
[11] E.R. Galea, G. Sharp, P. J. Lawrence, and R. Holden, "Approximating the Evacuation of the World Trade Center North Tower using Computer Simulation," Journal of Fire Protection Engineering, Vol. 18, No. 2, pp. 85-115.
[12] buildingEXODUS V5.0., FSEG, December 12, 2011.
[13] E.R. Galea, “A General Approach to Validating Evacuation Models with an Application to EXODUS”, Journal of Fire Sciences, Vol. 16, No. 6, pp. 414-436.
[14] S. Gwynne, E.R. Galea, P.J. Lawrence, and L. Filippidis, “Modelling occupant interaction with fire conditions using the buildingEXODUS evacuation model”, Fire Safety Journal, Vol. 36, No. 4, pp. 327-357. [15] M. Owen, E.R. Galea, and P.J. Lawrence,
“EXODUS Evacuation Model Applied to Building Evacuation Scenarios”, Journal of Fire Protection Engineering, Vol. 8, No. 2, pp. 65-86.
[16] Y.L. Hu, and X.W. Liu, "A Design of Artificial High-Rise Building Evacuation Systems Under Fires”, IEEE International Conference on Service Operations and Logistics, and Informatics (SOLI 2012), Suzhou (China), July 8-10, 2012, pp. 241-245.
[17] STN 920201-3, Evacuation in Buildings [in Slovak], SUTN, 2013.
[18] E. Ronchi, S. M. V. Gwynne, D. A. Purser, and P. Colonna, "Representation of the Impact of Smoke on Agent Walking Speeds in Evacuation Models." Fire Technology, Vol. 49, No. 2, pp. 411-431.
[19] T. Jin, “Visibility and Human Behavior in Fire Smoke” The SFPE Handbook of Fire Protection Engineering. In P.J. Di Nenno et al. (eds), 4th ed. NFPA, Quincy, pp. 2/54-2/66.
[20] E.R. Galea et al. User Guide and Technical Manual, GUEL, 2011.
Figure 14: Relation between CWTa and PETa for VE 0 10 20 30 40 50 60 70 80 90 P1M 2E 1 P1M 2E 2 P1M 2E 3 P1M 2E 4 P3M 2E 7 P2M 2E 1 P4M 2E 1 P2M 2E 5 P2M 2E 6 P3M 2E 8 P3M 2E 9 P3M 2E 10
B2S1 B2S2 B2S3 B2S4 B2S5 S1 S2 S3 S4 S5 S6 S7