SIMULTANEOUS SUPERDARN AND CLUSTER OBSERVATIONS OF THE GROWTH AND EXPANSION PHASES OF SUBSTORMS
N.C. Draper1, M. Lester1, J.A. Wild1, S.E. Milan1, G. Provan1, A. Grocott1, S.W.H. Cowley1, A.N. Fazakerly2, A. Lahiff2, J.A. Davies3, J.-M. Bosqued4, J.P. Dewhurst2, R. Nakamura5, C.J. Owen2
1. University of Leicester, UK; 2. Mullard Space Science Laboratory, UK; 3. Rutherford Appleton Laboratory, UK; 4. CESR Toulouse, France; 5. IWF Graz, Austria
Abstract
A coordinated study of a substorm that occurred on 5 October 2002 is presented using instruments located at 15 RE downtail, at a near-Earth location of 6.6 RE downtail and on Earth. Near-Earth substorm signatures are detected from one minute after onset, where onset is defined by the detection of electrojet and substorm current wedge signatures in the CANOPUS magnetometer data. Subsequently, 12 minutes after onset the Cluster spacecraft detect first the dawnward edge, then 40 minutes after the duskward edge, of the substorm current wedge (SCW), indicating that this has moved dawnward during the expansion phase. The corresponding footprint of the SCW is inferred from magnetometer data available from CANOPUS and Greenland magnetometer data. The SuperDARN data detect an intensification in ionospheric flows 22 minutes after substorm onset. It is concluded that a cross-tail current sheet is detected at the orbit of the Cluster spacecraft at ~15 RE downtail, the signature of which is lost 3 minutes prior to substorm onset, perhaps due to thinning of the current sheet.
Introduction
The large-scale dynamics of the plasma sheet during a substorm can be studied using data from instruments on spacecraft such as the four Cluster spacecraft. The corresponding dynamics closer to Earth can be detected with instruments on satellites at geostationary orbit, and the response in the ionosphere sensed using ground-based radars and magnetometers. By studying a substorm using a wide range of instruments located at key areas of interest in the magnetosphere and ionosphere, information about the current systems and plasma flows before, during and after substorm onset can be inferred. This helps constrain the possibilities for the order in which processes occur, thus allowing conjectures to be made upon the nature of the substorm onset mechanism. The two main onset mechanisms are the near-Earth neutral line (NENL) model (Baker et. al., 1996 and references therein) and the cross-field current instability (CCI) model (Lui et. al., 1996 and references therein). Here we present an initial study of conditions in the tail and ionosphere during the growth phase and at expansion phase onset of a substorm on 5 October 2002.
Instruments
The two magnetometer chains used in this study are the CANOPUS (Rostoker at al., 1995) and Greenland (Friis-Christensen et al., 1988) chains; the former is located in west-central Canada and the latter along the eastern and western coasts of Greenland. The magnetometer (MAG; Smith et al., 1998) and Solar Wind Electron, Proton and Alpha Monitor (SWEPAM; McComas et al., 1998) instruments on the Advanced Composition Explorer (ACE; Stone et al., 1998) spacecraft are used to determine the solar wind
parameters for the interval leading up to substorm onset. The near-Earth (6.6 RE downtail) conditions around substorm onset time are detected using a Geostationary Operational Environmental Satellite (GOES 8) and the Los Alamos National Laboratory (LANL) spacecraft. Further downtail at ~15 RE downtail the Cluster spacecraft are collecting data for the conditions in the magnetotail, with the Cluster Ion Experiment (CIS; Rème et al., 1997), Plasma Electron and Current experiment (PEACE; Johnstone et al., 1997), Research with Adaptive Particle Imaging Detector (RAPID; Wilken et al., 1997) and Fluxgate Magnetometer (FGM; Balogh et al., 1997) instruments. The ionospheric flows are looked at using line-of-sight velocity data from six of the northern hemisphere Super Dual Auroral Radar Network (SuperDARN) radars (Greenwald et al., 1995).
During the interval of interest the Cluster spacecraft are located at 15 RE downtail, and their footprints along the magnetic field line (mapped using the Tsyganenko 1996 model (Tsyganenko and Stern, 1996)) are located in the field-of-view of the SuperDARN radars for a significant number of hours both before and after the substorm onset. Their footprint maps between the locations of the CANOPUS and Greenland magnetometer arrays.
Observations
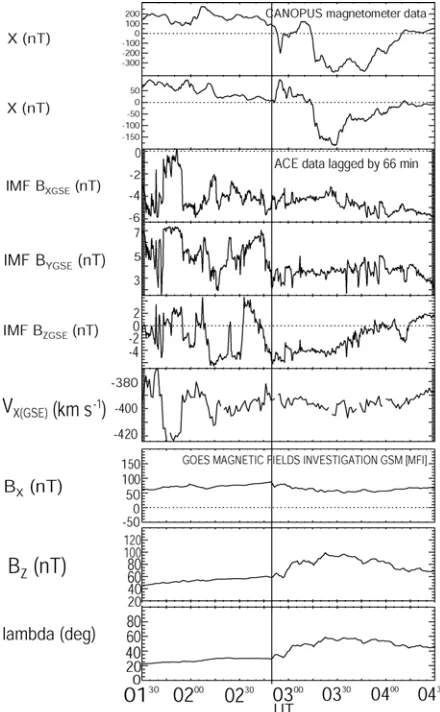
westward electrojet of a substorm at this time. The Bx component at PIN increased at the same time and is either the signature of the field-aligned current part of the SCW or an enhanced eastward electrojet. These two stations are the southernmost of the CANOPUS magnetometer array. In addition the MFI instrument on the GOES 8 spacecraft (located at ~2200 MLT) detected a small dipolarisation at 0251 UT (panels 7, 8 and 9 of Figure 1) as a result of a small increase in the Bz component (panel 8). This is followed by a larger increase at 0256 UT. The LANL spacecraft are located at 6.6 RE downtail; data not shown. The low energy electron data show evidence for a dispersionless plasma injection at the same time, with further dispersed injections detected at the other LANL spacecraft later on. The time of 0250 UT is taken as that of substorm onset for the study.
Data from the MAG instrument on the ACE spacecraft are also shown in Figure 1 (panels 3, 4 and 5). This indicates that the interplanetary magnetic field (IMF) is southward for approximately 45 minutes prior to substorm onset at 0250 UT, apart from a 7 minute interval shortly before onset. The SWEPAM instrument (panel 6) indicates that the solar wind velocity is around 395 km/s earthwards throughout the interval.
The FGM instruments on the four Cluster spacecraft detect the magnetic field in the magnetotail. These data are shown in Figure 2. At the time of substorm onset the Bx and Bz components of the magnetic field at Cluster orbit both decrease. This is unusual as dipolarisation of the magnetotail would usually result in a decrease in the x component but an increase in the z component. It is interesting to note that the Bz component also turns negative, reaching a minimum of ~-6 nT four minutes after onset. The x component of curl B can be used as a proxy for the current in the x direction, jx, since curlB=µ0j; similarly for y. Before the substorm onset, the Cluster spacecraft detect a current in the jy direction; the cross-tail current sheet current.
This signature is lost 3 minutes before substorm onset, at 0247 UT. At 0302 UT, 12 minutes after onset, the jx component estimated from curl B is positive, indicating that the main current detected by the spacecraft is now Earthward; the spacecraft must be located on the dawnward edge of the SCW. Around the time of re-entry to the plasma sheet at 0330 UT, jx is negative, so the spacecraft are detecting tailward field-aligned current; the location of the SCW has moved.
[image:2.612.319.539.71.427.2]Data from the Greenland magnetometer network (not shown), located to the east of the CANOPUS network,
Figure 1: Data for 5 October 2002, from 0130 UT until 0430 UT. Panels 1 and 2: CANOPUS magnetometer data from ISL and PIN stations; panels 3, 4, 5: ACE MAG data for Bx, By and Bz components of IMF (GSM coordinates); panel 6: ACE SWEPAM data for Vx (GSM); panels 7, 8, 9: GOES 8 magnetometer data for Bx, Bz and lambda (GSM).
shows that onset at these stations is detected 3 minutes after onset at 0253 UT at the lowest latitude station, NAQ. This station detects a decrease in the Bx component of the magnetic field; thus the westward electrojet is located above the NAQ station. The Bz component of the magnetic field at this station is steady before onset; at onset it increases and then after the onset it is steady again. This means that the centre of the electrojet finished equatorward of this southernmost Greenland station.
Figure 2: Data for 5 October 2002, from 0230 UT until 0400 UT. Panels 1, 2 and 3: Bx, By and Bz components of magnetic field from the FGM instrument on each of the four Cluster spacecraft; panel 4: curl Bx, curl By, div x calculated from the Cluster FGM data.
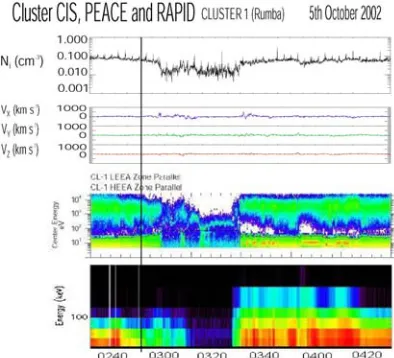
instrument on three of the Cluster spacecraft decreases, while strong Earthward flows are detected at all spacecraft. These flows are strongest at Cluster 4, weaker at Cluster 1 and weakest at Cluster 3. At later times (~0310 UT) the flows change direction and are tailward. The spacecraft appear to be in the plasma sheet boundary layer for a long time, and hence there is a lot of structure within the data. The spacecraft exit into the lobe before re-entering the plasma sheet at 0330 UT; the density increases. Earthward, then tailward, flows are detected. The four PEACE instruments also showed differing structure between each of the spacecraft, with a prolonged stay of around 15 minutes in the plasma sheet boundary layer. The spacecraft exit to the lobe for ~15 minutes, during which time the low-energy electron count rate is low. The spacecraft re-enter the plasma sheet at 0330 UT. The RAPID instrument on the Cluster spacecraft also shows that the spacecraft are in the plasma sheet boundary layer for a long time; it is interesting to note that the count rate of the higher energy particles decreases at ~0252 UT, just 2 minutes after the onset time. At 0258 UT the count rate at this energy level drops out almost completely. At 0330 UT the count rate recovers as the spacecraft re-enter the plasma sheet.
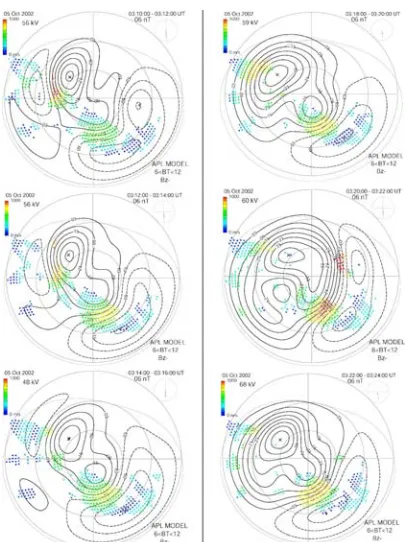
SuperDARN map potential plots are large-scale global convection plots derived from line of sight velocities observed by the SuperDARN radars, shown in Figure 4 (Left panel: 0310 to 0314 UT. Right panel: 0318 to 0322 UT). These show intensifications in ionospheric flow to ~700 m/s in the midnight sector at 0312 UT, 22 minutes after onset, at which time the Cluster spacecraft are located in the plasma sheet boundary layer/lobe region. 30 minutes after onset there are further intensifications in the midnight sector to ~1,000 m/s, during which time the Cluster spacecraft
Figure 3: Data for 5 October 2002, from 0230 UT until 0400 UT. Panels 1 and 2: CIS - low energy ion density and vx, vy and vz components of velocity; panel 3: PEACE - low energy electron density; panel 4: RAPID - high energy electron density.
are located in the lobe.
Conclusions
This event is clearly a substorm, albeit one with rather unusual features in the data. The Cluster spacecraft appear to be detecting the SCW from 12 minutes after onset. Initially, as the spacecraft are leaving the plasma sheet, they are located on the dawnward edge of the SCW; however, as the spacecraft re-enter the plasma sheet the spacecraft are located on the duskward edge of the SCW, indicating that the SCW has moved dawnward. The unusual decrease and turning negative of the Bz component of the magnetic field detected at the Cluster spacecraft at onset remains to be fully explained. However, one interpretation might be the motion of a travelling compression region (Slavin et. al., 2003) past the Cluster spacecraft.
Most importantly, it is clear that the cross-tail current sheet is detected by the Cluster spacecraft prior to onset, and that the signature for this is lost some three minutes before the substorm onset begins on Earth, as detected by the ground based magnetometers. This is consistent with thinning of the current sheet (at ~15 RE) prior to onset, and would be consistent with the later expansion of the plasma sheet over the spacecraft. A fuller interpretation of the data will follow in a full-length paper.
Acknowledgements
[image:3.612.86.266.76.215.2]Figure 4: SuperDARN map potential plots for 5 October 2002, shown at two minute intervals. Left panel: 0310 to 0314 UT. Right panel: 0318 to 0322 UT. Local noon is at the top, local midnight at the bottom, and dawn and dusk to the right and left respectively.
Space Agency, provided the data used in this study. Thanks to Dr. Jurgen Watermann for providing Greenland magnetometer chain data; to the ACE MAG instrument team and CDAWeb for providing the ACE MAG data; to NOAA and CDAWeb for providing the GOES magnetometer data; to M.G. Henderson for providing LANL data; and to the Cluster Principal Investigators for the FGM (A. Balogh), CIS (H. Rème), PEACE (A. Fazakerly) and RAPID (P. Daly) instruments. Thanks also to Hina Khan for help with data analysis.
References
Baker, D.N., T.I. Pulkkinen, V. Angelopoulos, W. Baumjohann and R.L. McPherron, Neutral line model of substorms: Past results and present view J. Geophys. Res., Vol. 101, No. A6, Pages 12,975-13,010, June 1, 1996
Balogh, A., M.W. Dunlop, S.W.H. Cowley, D.J. Southwood, J.G. Thomlinson, K.-H. Glassmeier, G. Musmann, H. Lühr, S. Buchert, M.H. Acuña, D.H. Fairfield, J.A. Slavin, W/ Riedler, K. Shwingenschuh, M.G. Kivelson The Cluster magnetic fields investigation Space Science Review, 79, 65-91, 1997
Friis-Christensen, E., M.A. McHenry, C.R. Clauer, and S. Vennerstrøm, Ionospheric travelling convection vortices observed near the polar cleft: a triggered response to sudden changes in the solar wind, Geophys. Res. Lett., 15, 253, 1998
Greenwald, R.A., K.B. Baker, J.R. Dudeny, M. Pinnock, T.B. Jones, E.C. Thomas, J.-P. Villain, J.-C. Cerisier, C. Senior, C. Hanuise,
R.D. Hunsucker, G. Sofko, J. Koehler, E. Nielsen, R. Pellinen, A.D.M. Walker, N. Sato, H. Yamagishi Darn/SuperDARN: a global view of the dynamics of high-latitude convection Space Science Review, 71, 761-796, 1995
Johnstone, A.D., C. Alsop, S. Burge, P.J. Carter, A.J. Coates, A.J. Coker, A.N. Fazakerley, M. Grande, R.A. Gowen, C. Gurgiolo, B.K. Hancock, B. Narheim, A. Preece, P.H. Sheather, J.D. Winningham, R.D. Woodliffe Peace: A Plasma Electron and Current Experiment
Space Sci. Rev. 79, 351-398, 1997
Lui, A.T.Y.: Current disruption in the Earth's magnetosphere: Observations and models J. Geophys. Res., Vol. 101, No. A6, Pages 13,067-13,088, June 1, 1996
McComas, D.J., S.J. Bame, P. Barker, W.C. Feldman, J.L. Phillips, P. Riley and J.W. Griffee Solar wind electron proton alpha monitor (SWEPAM) for the Advanced Composition Explorer Space Sci. Rev., 86, 563, 1998
Rème, H., J.M. Bosqued, J.A. Sauvaud, A. Cros, J. Dandouras, C. Aoustin, J. Bouyssou, Th. Camus, J. Cuvilo, C. Martz, J.L. Médale, H. Perrier, D. Romefort, J. Rouzaud, D. d'Uston, E. Möbius, K. Crocker, M. Granoff, L.M. Kistler, M. Popecki, D. Hovestadt, B. Klecker, G. Paschmann, M. Scholer, C.W. Carlson, D.W. Curtis, R.P. Lin, J.P. McFadden, V. Formisano, E. Amata, M.B. Bavassano- Cattaneo, P. Baldetti, G. Belluci, R. Bruno, G. Chionchio, A. di Lellis, E.G. Shelley, A.G. Ghielmetti, W. Lennartsson, A. Korth, U. Rosenbauer, R. Lundin, S. Olsen, G.K. Parks, M. McCarthy and H. Balsiger The Cluster Ion Spectrometry (CIS) Experiment Space Sci. Rev. 79, 303-350, 1997
Rostoker, G., J. Samson, F. Creutzberg, T. Hughes, D. McDiarmid, A. McNamara, A.V. Jones, D. Wallis, and L. Cogger, CANOPUS-A ground based instrument array for remote sensing the high latitude ionosphere during the ISTP/CGS program, Space Sci. Rev., 71, 734-760, 1995
Slavin, J.A., C.J. Owen, M.W. Dunlop, E. Borälv, M.B. Moldwin, D.G. Sibeck, E. Tanskanen, M.L. Goldstein, A. Fazakerley, A. Balogh, E. Lucek, I Richter, H. Rème, and J.-M. Bosqued, Cluster four spacecraft measurements of small travelling compression regions in the near-tail, Geophys. Res. Lett., 30(23), 2208, doi:10.1029/2003GL018438, 2003
Smith, C.W., M.H. Acuña, M.F. Burlaga, J. L'Heureux, N.F. Ness, J. Scheifele The ACE Magnetic Fields Experiment Space Science Review, 86, 613-632, 1998
Stone, E.C., A.M. Frandsen, R.A. Mewaldt, E.R. Christian, D. Margolies, J.F. Ormes, F. Snow The Advanced Composition Explorer Space Science Review, 86, 1-22, 1998
Tsyganenko, N.A. and D.P. Stern, Modeling the global magnetic field of the large-scale Birkeland current systems, J. Geophys. Res., 101, 27,187-27,198,1996