2018 3rd International Conference on Information Technology and Industrial Automation (ICITIA 2018)
ISBN: 978-1-60595-607-7
An Empirical Study of Logistics Service Quality
Evaluation Model in the Context of Network
Big Data
Bing Zheng and Chun Wang
ABSTRACT
This paper first puts forward the issue from the point of view of customers, and explores the initial factors of logistics service quality through the in-depth interview and the Delphi method. Secondly, the survey uses the “direct measure perception of service performance” service quality measurement method, and selects Internet store to complete the empirical research. Finally, the paper tests the reliability and validity of the logistics service quality evaluation model, and confirms five Logistics service quality dimensions, order quality, customization service quality, convenient quality, delivery quality, and order discrepancy handling quality.1
INTRODUCTION
The increase of their scale and complexity presents unprecedented opportunities on deeply mining and taking full advantage of the big value of network big data. Therefore, it is pressing to investigate the disciplinary issues and discover the common laws of network big data, and further study the fundamental theory and basic approach to qualitatively or quantitatively dealing with network big data. With the continuous development of data acquisition technology, people get a lot of data have the timing, while the emergence of individual behavior in social networks is based on statistical results of data timing distribution[1]. There are easy to build social relationships among individuals with a greater similarity in social networks. The increased transparency that is made possible by the Internet should make inefficient markets more efficient and thus send ripple effects throughout the economy[2].
1
As the number of Internet users and internet usage increase, the way consumers use and will use this interactive tool in or as part of their shopping decisions and practices continues to attract the attention of researchers and practitioners [3]. When studying online shopping behavior, we should bear in mind that the online shopping needs the cooperation of the logistics service companies. Some researchers have developed a model of what they termed logistics service quality, or LSQ, through surveying a broad range of purchasing managers [4]. But the model was developed on the basis of American organizations. As a service offering, logistics is often subject to cultural influences that exist in trade, so it can’t be used to measure Chinese companies’ logistics service quality [5].
It is the purpose of this paper to develop a logistics service quality evaluation model in context of online shopping. The study selectively absorbs these measurements implication of the item, and then placed in the Internet environment, combined with qualitative interviews to build the model and empirical test.
METHODS
In order to better define the context of China B2C online store consumers perceive the quality of logistics services constituted, not only from the existing literature in sufficient background knowledge to grasp, but consumers need to learn in the middle of fresh nutrients.
Model Construction
Qualitative exploration was generated by three focus group interviews involving 30 customers who had the experience of the online shopping. The researchers individually identified specific LSQ dimensions raised in the reviews, then met to discuss them and resolve any differences. Specifically, we previously discussed the literature and the qualitative research that revealed a LSQ scale of 5-dimension and 29-item.After the focus group interviews, this study used Delphi method to further improve measurement validity. As a result of the Delphi method, 3 items (OQ6, ODHQ2 and CQ5) were deleted from an initial pool of 29 items.
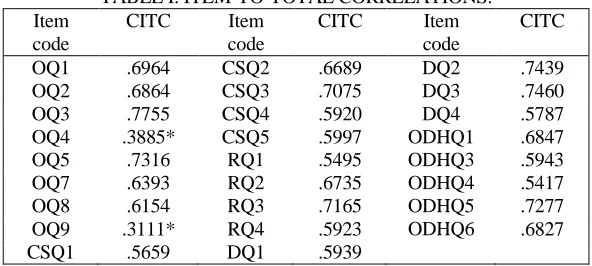
Pre-Survey
TABLE I. ITEM-TO-TOTAL CORRELATIONS. Item
code
CITC Item code
CITC Item code
CITC
OQ1 .6964 CSQ2 .6689 DQ2 .7439 OQ2 .6864 CSQ3 .7075 DQ3 .7460 OQ3 .7755 CSQ4 .5920 DQ4 .5787 OQ4 .3885* CSQ5 .5997 ODHQ1 .6847 OQ5 .7316 RQ1 .5495 ODHQ3 .5943 OQ7 .6393 RQ2 .6735 ODHQ4 .5417 OQ8 .6154 RQ3 .7165 ODHQ5 .7277 OQ9 .3111* RQ4 .5923 ODHQ6 .6827 CSQ1 .5659 DQ1 .5939
Samples and Data Collection
Formal survey questionnaire in an online research firm released a random sample of 2,000 copies of the library, recycling 789 valid questionnaires, the effective rate of 39.5%. Responders, men 59.8%, women 40.2%; mean age was 28.9 years, 40 years of age accounted for 90.6%; 39.9% married, unmarried accounted for 60.1%. By analysis of variance between these categorical variables, no significant differences in the perception of these and related problems of logistics service quality.
ANALYSES AND RESULTS
Use these 24 questions of logistics service quality measurement as a tool for B2C online store consumer perception. However, the resulting scale also needed reliability and validity tests to ensure its reliability and validity.
Factor Analyses
In addition, all the items’ Cronbach's α were above 0.6, which showed the scale reliability were acceptable.
Convergent Validity Analyses
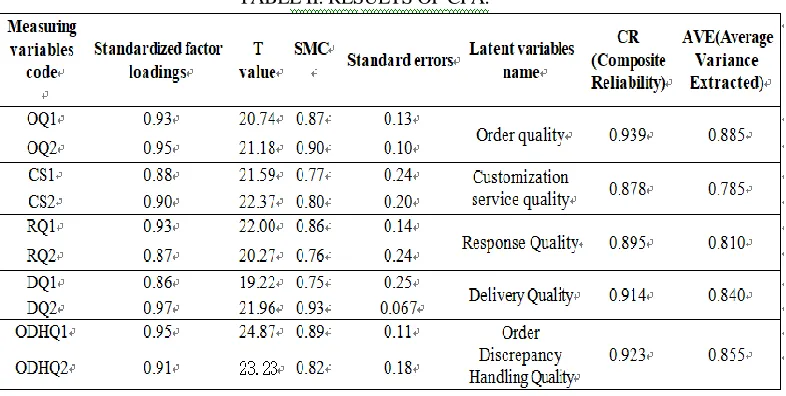
The first question will measure the dimensions of each item into a smaller number of sub-indicators (Indicators), where each will be ordered here are quality, customized service, response quality, delivery quality and error handling quality of the original 6, 5, 4, 4 and 5 question questionnaire, questions were combined into two items, with the average value as the corresponding values. Implementation of confirmatory factor analysis(CFA) using maximum likelihood estimation in statistical software LISREL9.30, the analysis results are shown in Table 2.
First, the questions of each normalization factor between a load factors of 0.86 to 0.97, far more than the standard acceptable to 0.5, and the statistical significance. Meanwhile, CR values, AVE values and SMC value all meet the recommended standards. This fully shows the measurement model has a strong convergent validity.
[image:4.612.115.508.472.670.2]In addition, the model P value of 0.0, the chi-square value of 34.74, 25 degrees of freedom. Although significant chi-square value, however, since the sample size is very sensitive to LISREL Therefore, most studies of other indicators showing the degree of fitting to the model. Ratio chi-square value of the model with degrees of freedom is 1.39 < 3. RMR model is 0.03, RMSEA value of 0.018 , far less than the 0.08 standard model fitting parameters GFI, AGFI, RFI, CFI, NFI, NNFI, IFI values were 0.98,0.96,0.98,1.00,0.99,1.00 are greater than the studies suggested 0.9 , indicating the degree of confirmatory factor analysis fit well with the data model . Visible, the study design scale has good convergent validity.
TABLE III. A DISCRIMINANT VALIDITY ANALYSES OF THE DIMENSIONS.
OQ CSQ RQ DQ ODHQ
OQ 0.941
CSQ 0.322 0.886
RQ 0.372 0.548 0.900
DQ 0.268 0.378 0.384 0.917
ODHQ 0.299 0.478 0.688 0.444 0.925
Discriminant Validity Analyses
This study uses a value greater than if the AVE square or AVE between the two dimensions of the square root of the value of the correlation coefficient greater than the correlation coefficient between the two dimensions, it means the difference between these two dimensions has the validity of the method. The data in Table 3 show the square root of each of the AVE are significantly larger than the dimensions of any correlation model, indicating that the difference between the dimensions have good validity.
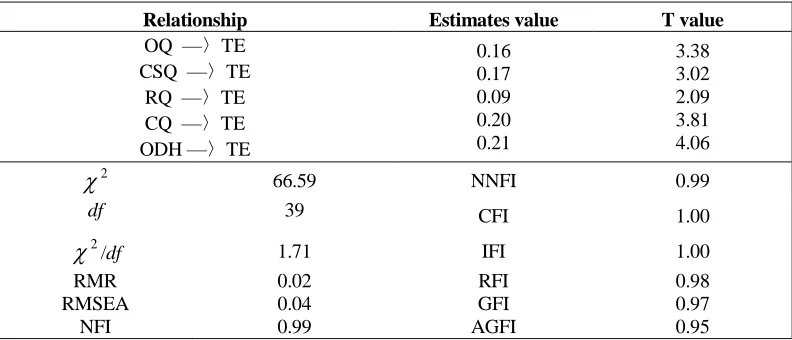
Nomological Validity Analyses
[image:5.612.100.496.468.638.2]This study used LISREL 9.30 for 5 dimensions of logistics service quality and the causal relationship overall evaluation were tested, the test results are shown in Table 4. Structural equation analysis showed that the data fit well to these relationships, we can see that the scale developed in this study has a good law is validity.
TABLE IV. RESULTS OF SEM TEST.
Relationship Estimates value T value
OQ —〉TE CSQ —〉TE
RQ —〉TE CQ —〉TE ODH —〉TE
0.16 0.17 0.09 0.20 0.21
3.38 3.02 2.09 3.81 4.06
2
66.59 NNFI 0.99
df 39 CFI 1.00
2
/df 1.71 IFI 1.00
RMR RMSEA
NFI
0.02 0.04 0.99
RFI GFI AGFI
CONCLUSIONS
In this study, we presented a 5-dimension and 24-item scale in context of China based on the online shopping. Order quality, including 6items, CR reached 0.939; customization service quality, including5items, CR was 0.878; response quality, including 4items, CR of 0.895; deliver quality, including 4items, CR was 0.914; Order discrepancy handling quality, including 5items, CR was 0.923. It shows the LSQ model this study builds in Internet environment not only has a high reliability, but also has high validity.
ACKNOWLEDGMENTS
The Project Supported by the Ministry of education of Humanities and Social Science project of China (No.14YJC630206), Zhejiang Provincial Natural Science Foundation of China (No.LQ14G020004), and Zhejiang Federation of Humanities and Social Sciences Circles Subject of China(No.2014N104).Sincere appreciation is extended to the reviewers of this paper for their helpful comments.
REFERENCES
1. Wenlei Fan. Ueerts Florin. Foundations of Data Quality Management. Synthesis Lectures on Data Management,2012, 4(5):1-217.
2. Mohammed Rafiq, Heather Fulford, Xiaoming Lu. Building Customer Loyalty in Online Retailing: The Role of Relationship Quality[J]. Journal of Marketing Management, 2013, 29(3– 4):494–517.
3. Brengman, M., Geunens, M., Weijters, B., Smith, S.M., Swinyard, W.R. Segmenting Internet Shoppers Based on the Web-Usage-Related Lifestyle: a Cross Cultural Validation. Journal of Business Research, 2010, 58, 79–88.
4. Mentzer, J.T., Flint, D.J., Hult, G.T.M. Logistics Service Quality as a Segment-Customized Process. Journal of Marketing, 2001, 65(4):82-104.
5. Mentzer, J.T., Matthew B. Myers, Mee-Shew Cheung Global Market Segmentation for Logistics Services. Industrial Marketing Management, 2004, 33: 15-20.