Tracking the distribution of bugs
across software release versions
A thesis submitted to the University of Dublin, Trinity College
in partial fulfillment of the requirements for the degree of
Doctor of Philosophy
Department of Statistics, Trinity College Dublin
November 2015
Declaration
I declare that this thesis has not been submitted as an exercise for a degree at this
or any other university and it is entirely my own work.
I agree to deposit this thesis in the University’s open access institutional repository
or allow the Library to do so on my behalf, subject to Irish Copyright Legislation and
Trinity College Library conditions of use and acknowledgement.
The copyright belongs jointly to the University of Dublin and Se´an ´O R´ıord´ain .
Se´an ´O R´ıord´ain
Abstract
Real software systems always contain bugs and the question on every release manager’s
mind coming up to a release centres around how many undiscovered bugs there still
remain. This work looks at one model, (Goel and Okumoto, 1979), which tries to
answer this question and extends previous work to try to borrow strength from previous
Acknowledgements
First of all, I would like to express my utmost gratitude to my supervisor Simon Wilson.
For more than four years, he has been very helpful and provided invaluable guidance
to me.
I am also very thankful to all the wonderful people in our department, in particular
Myra, Eamonn and John who have offered support and statistical guidance. Thanks
must also go to those who took part in various long discussions in the grad room
in-cluding Tiep, Louis, Susi, Arnab, Thinh, Cristina, Shuaiwei, Donnacha, Shane, Gernot,
Arthur, Angela, Brett, Jason, Rozenn and everyone else in TCD, also to all my friends
and family. Thanks also to Stephanie and Kate for their support. I would also like to
thank my two sisters who have been particularly supportive over the last few months.
I am indebted to my parents, R´ois´ın Fant ´O R´ıord´ain and Fionnbharr ´O R´ıord´ain
for their long-lasting encouragement and support, I dedicate this thesis to them.
This work was supported, in part, by Science Foundation Ireland grant 10/CE/I1855
to Lero - the Irish Software Engineering Research Centre (www.lero.ie).
Se´an ´O R´ıord´ain
Trinity College Dublin
Contents
Abstract v
Acknowledgements vii
List of Tables xiii
List of Figures xv
Glossary xxi
Chapter 1 Introduction 1
1.1 Statistical motivation . . . 1
1.2 Outline of the thesis and contributions . . . 1
1.3 Research Contributions . . . 3
Chapter 2 Background Information 5 2.1 Introduction . . . 5
2.2 Background Information on Software Development and Open Source . . 5
2.2.1 Software Development . . . 5
2.2.2 Open Source Software . . . 8
2.2.3 Mozilla Firefox Development . . . 9
2.3 Bugs! . . . 11
2.3.1 Bug Databases . . . 15
2.3.2 Bug Data . . . 18
2.3.3 Open Data . . . 18
2.4 The Firefox-2013 Dataset . . . 19
2.4.2 Version Covariates . . . 23
2.5 Inequality of effort . . . 25
Chapter 3 Statistical Theory 31 3.1 Introduction . . . 31
3.2 Decision Making . . . 31
3.3 Bayesian Inference . . . 32
3.4 Markov Chain Monte Carlo Methods . . . 34
3.5 Hamiltonian Monte Carlo . . . 37
3.6 Markov Chain Convergence . . . 37
3.7 Adaptive Monte Carlo . . . 39
3.8 Imputation of Missing Data . . . 40
3.9 The Recursive Property of Bayes’ Theorem . . . 41
3.9.1 Proof of Recursive Property of Bayes’ Theorem . . . 42
3.10 Non-Homogeneous Poisson Process . . . 42
3.11 Hierarchical Models . . . 43
3.12 Model Comparison . . . 45
3.13 Classification Background . . . 47
3.14 Software Reliability . . . 49
3.14.1 Models for Software Reliability . . . 50
3.14.2 Modelling Multiple Version Reliability . . . 52
3.15 Modelling Defect Identification . . . 53
Chapter 4 Goel-Okumoto 55 4.1 Introduction . . . 55
4.2 The Goel and Okumoto model . . . 55
4.3 Approximations . . . 57
4.4 RStan . . . 61
4.5 Multiple Versions . . . 66
4.5.1 Practical Issues . . . 71
4.6 Hand written sampler . . . 71
Chapter 5 Semi-Supervised Classification 75
5.1 Introduction . . . 75
5.2 Data . . . 75
5.3 Informal Model Outline . . . 78
5.3.1 Assumptions: . . . 78
5.4 Formal description of the model . . . 79
5.5 Algorithm . . . 79
5.6 Acceptance Ratios . . . 81
5.7 Validation with synthetic dataset . . . 84
5.8 Validation with Firefox-2013 dataset . . . 88
5.9 Discussion . . . 93
Chapter 6 Combined Model 97 6.1 Introduction . . . 97
6.2 Model details . . . 99
6.3 Hierarchical Model . . . 109
6.4 Current implementation - a description . . . 110
6.4.1 Hierarchical priors . . . 111
6.4.2 Proposals . . . 111
6.4.3 Step Functions . . . 111
6.4.4 Results . . . 112
6.5 Discussion . . . 112
Chapter 7 Case Study 115 7.1 Utility . . . 115
7.2 Results . . . 116
7.3 Discussion . . . 120
7.4 Further Work . . . 120
Chapter 8 Discussion 121 8.1 Discussion . . . 121
8.1.1 Data . . . 122
8.1.2 Covariates . . . 125
8.1.4 Model Speed . . . 131
8.2 Further Work . . . 131
Chapter 9 Conclusions 135
Appendix A RStan results table - Chapter 4 137
Appendix B RStan results table - Chapter 5 141
Appendix C Combined Model details - Chapter 6 143
List of Tables
2.1 The number of bugs logged to Bugzilla for each individual Rapid-Release
version of Firefox. . . 22
2.2 Covariate Information on Firefox Releases 5 to 25 . . . 25
List of Figures
2.1 The life cycle of a bug in the Bugzilla bug tracking system. Copyright
The Mozilla Foundation, licensed under the MPL. . . 15
2.2 Cumulative Number of Bugs Reported against Firefox version 10 . . . . 17
2.3 Cumulative number of Bugs logged to Bugzilla for each individual
Rapid-Release version of Firefox. The dashed vertical lines correspond to
re-lease dates in Table 2.1 . . . 20
2.4 A plot of the number of bugs reported per individual. Many people
reported only one bug, one person reported 420 bugs. . . 27
2.5 Number of Bugs logged to Bugzilla by Month with a loess smoother. . 27
2.6 Number of Reporters logging bugs to Bugzilla by Month with a loess
smoother. . . 28
2.7 Number of Bugs per Reporter logging bugs to Bugzilla by Month with
a loess smoother. . . 29
2.8 Gini Coefficient of Effort by reporters logging bugs to Bugzilla by Month
with a loess smoother. . . 30
4.1 A plot of the Mean Value Function of the Goel-Okumoto model for the
NTDS dataset based on MLE parameters for the first 26 data points as
published by Goel-Okumoto. . . 57
4.2 A contour plot of the log-likelihood as in Equation (4.7) of the
Goel-Okumoto model for the 26 point NTDS dataset, calculated on a
rectan-gular grid. . . 59
4.3 A contour plot of the log-likelihood of the Goel-Okumoto model for the
26 point NTDS dataset on a log-log scale, calculated on a rectangular
4.4 A contour plot of the posterior of the Goel-Okumoto model for the NTDS
dataset. . . 60
4.5 A contour plot of the posterior of the Goel-Okumoto model for the NTDS
dataset on a log-log scale. . . 60
4.6 A plot of the marginals of (a, b) of the Goel-Okumoto model for the
NTDS dataset. . . 61
4.7 The full Goel-Okumoto model in Stan model code . . . 63
4.8 Output from a run of the Stan model for the Goel-Okumoto model for
the NTDS dataset using only 26 points. . . 64
4.9 Output from a run of the Stan model for the Goel-Okumoto model for
the NTDS dataset using only 34 points. . . 64
4.10 A plot of the posterior of the Goel-Okumoto model from RStan for the
NTDS dataset for N = 26. . . 65
4.11 A plot of the posterior of the Goel-Okumoto model from RStan for the
NTDS dataset forN = 34. Note the very different scales on both the X
and Y axes as compared with Figure 4.10. . . 65
4.12 A box plot of the Goel-Okumoto a and b parameters for each of the
versions calculated using Stan using theindependent model . . . 67
4.13 A box plot of the Goel-Okumoto a and b parameters for each of the
versions calculated using Stan using thecumulative model . . . 67
4.14 A box plot of the Goel-Okumoto a and b parameters for each of the
versions calculated using Stan using the hierarchical model. Compare
with Figure 4.13. . . 69
4.15 Density plots of the Goel-Okumotomeana(mean of a) andsda(standard
deviation of a) parameters from the Stanhierarchical model. . . 70
4.16 Density plots of the Goel-Okumotomeanb(mean of b) andsdb(standard
deviation of b) parameters from the Stanhierarchical model . . . 70
5.1 A plot of the densities of the different versions of Firefox with related
release date for each version plotted in a vertical dashed line of the same
colour. . . 76
5.2 A facet plot of the densities of the different versions of Firefox. Note
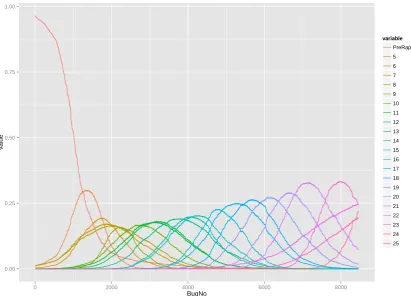
5.3 An area plot of the densities of the different versions of Firefox. At a
given date, the probability that a bug is from a particular release will
be strongly approximated by the proportion of colour associated with a
particular version in a vertical transect at that date. The release dates
of each version (5-22) are shown as dashed vertical lines in the colour
of the release. It is not expected that the reader can read this in detail,
merely that they see the overall pattern. . . 77
5.4 A schematic of the version model, showing the Gaussian kernel density
and the known release date. . . 79
5.5 A plot of the acceptance ratios by version for the Chapter 5 version
model. This is based on an MCMC run with two chains and 2,000
iterations, however the same pattern is visible in chains with 100,000
iterations. . . 82
5.6 A plot of the acceptance ratios by version for the Chapter 5 version
model. This is based on an MCMC run with two chains and 40,000
iterations, with a decaying proposal as k increases and β = 0.25. . . 83
5.7 A rug plot of distribution of the points in the synthetic dataset with
their corresponding original Cauchy distribution densities in black (A),
red (B) and blue (C). . . 84
5.8 A density plot of the three synthetic sets, weighted by the number of
points in each set. . . 85
5.9 An area density plot of the three synthetic sets, weighted by the number
of points in each set. . . 85
5.10 The results of the MCMC simulation for the three class synthetic dataset.
Note that the values of the alpha that we are expecting to see are
(−0.05,0.05,0.05), and clearly these are not close. . . 86
5.11 Trace plots of the parameters (αi=1:3, di=1:3 for an MCMC simulation
with 4 chains each of length 200,000 iterations. The top line of plots
shows the parameter values of (αi=1:3 for each of the three sets and the
5.12 Density plots of the parameters (αi=1:3, d = i= 1 : 3 for an MCMC
simulation with 4 chains each of length 200,000 iterations. The top
line of plots shows the parameter values of (αi=1:3 for each of the three
sets and the bottom line of plots shows the corresponding values for
d=i= 1 : 3. . . 87
5.13 Box plot of the values of Kappa for the nine increasing values of Q (proportion of missing data). . . 89
5.14 Box plot of the values of Kappa against NStop faceted against Q (pro-portion of missing data). . . 89
5.15 Trace plots of allαanddfor four chains forQ= 0.1 and 500,000 MCMC iterations. Note that from the top left the first 22 plots are the traces of α5:25 followed by the corresponding d5:25. . . 91
5.16 Density plots of all α and d for four chains for Q = 0.1 and 500,000 MCMC iterations and corresponding to the traces in Figure 5.15. Note that from the top left the first 22 plots are the densities ofα5:25followed by the correspondingd5:25. . . 92
5.17 Plot of the change in label for one chain for Q= 0.1 where the MCMC iteration is on plotted on the X axis. Described further in the text. . . 92
5.18 A typical plot of the empirical probability that a given unlabelled bug is from a particular version. . . 93
6.1 A DAG for the version model. . . 98
6.2 A DAG for the Goel-Okumoto model. . . 98
6.3 A DAG for the Combined model. . . 98
6.4 A trace plot of four chains for 100,000 iterations of the Combined model. Note in particular the excursion for d.18 and alpha.18 and the lack of corresponding excursion for a.18 and b.18. . . 103
6.6 Based on another run, a trace plot of four chains for 100,000 iterations
of the Combined model. . . 105
6.7 Based on another run, a density plot of four chains for 100,000 iterations of the Combined model. . . 106
6.8 A plot of one sample of bug labels returned by the combined model before being processed by the Goel-Okumoto model. This was taken early in an early MCMC iteration before warm-up had completed and is illustrative. In particular we can see that version index of 1 (PreRapid) applies to the early bugs only and version 25 has only been applied to the final bugs. . . 107
6.9 A plot of the normalized absolute difference between two iterations in the version section part of the combined model. . . 107
6.10 Hierarchical Priors for the combined hierarchical model . . . 111
7.1 A plot of the utility for four samples from two chains. . . 117
7.2 A plot of the relationship betweenC3 and T∗. . . 118
7.3 A plot of the relationship betweenC2 and T∗. . . 119
7.4 A plot of the relationship betweenC2 and C3 for a fixedT∗ = 42. . . . 119
8.1 A histogram of the age (defined in the text) of bugs . . . 123
8.2 A histogram of the age (defined in the text) of bugs, looking at -200 to +100 days, with daily breaks . . . 123
8.3 A histogram of the age (defined in the text) of bugs, looking at -200 to +100 days, with weekly breaks . . . 124
8.4 The three covariates plotted as a function of version covariate infor-mation: number of files changed, number of lines of code inserted and number of lines deleted. . . 125
8.5 The correlation matrix for the version covariate information: number of files changed (FChanged), number of lines of code inserted (LInserts) and number of lines deleted (LDeletions). . . 126
8.6 The posterior distribution of the log10(ak) (top) and log10(bk) (bottom)
plotted as a function of version covariate information: number of files
8.7 The output of linear regression for (ak) (top) and (bk) (bottom) regressed as a function of version covariate information: number of files changed
(FChanged), number of lines of code inserted (LInserts) and number of
lines deleted (LDeletions). . . 128
8.8 A thinned sample plot of the counts in each of the versions PreRapid,5, . . . ,25
against iteration count. . . 130
A.1 The details of the output of the Goel-Okumoto model in Stan . . . 138
B.1 The details of the output of the Version model. . . 142
C.1 Details of the output of one run of the Combined Model from Chapter 6 145
C.2 Box plot of the a parameters for the hierarchical model from Section 6.3. 147
C.3 Box plot of the b parameters for the hierarchical model from Section 6.3. 147
C.4 Box plot of the α parameters for the hierarchical model from Section 6.3. 148
C.5 Box plot of the d parameters for the hierarchical model from Section 6.3. 148
C.6 Box plot of the A and B Shape parameters for the hierarchical model
from Section 6.3. . . 149
C.7 Box plot of the A and B Rate parameters for the hierarchical model
from Section 6.3. . . 149
C.8 Trace plots of theaparameters for the hierarchical model from Section 6.3.150
C.9 Trace plots of thebparameters for the hierarchical model from Section 6.3.150
C.10 Trace plots of theαparameters for the hierarchical model from Section 6.3.151
C.11 Trace plots of thedparameters for the hierarchical model from Section 6.3.151
C.12 Trace plots of the Acceptance for the version model portion of the
hi-erarchical model from Section 6.3. Note that this plots the number of
rejects on the Y-axis +1. . . 152
C.13 Trace plots of the Acceptance for the Goel-Okumoto model portion of
the hierarchical model from Section 6.3. Note that this plots the number
of rejects on the Y-axis +1. . . 152
C.14 Sample plots of imputed and original points along with the
correspond-ing Goel-Okumoto Mean Value Functions sampled from the last iteration
Glossary
Confusion Matrix is a square contingency table which allows the clear visualization
of the performance of a classification prediction algorithm. Typically the class
predicted is labelled on the left of the matrix and the actual class is labelled
across the top of the matrix and the labels are typically given in the same order
from the top and from the left. If an algorithm is perfect for a given class
then the predicted count in a given row will be in the corresponding column.
Associated terminology include True Positive (TP), True Negative (TN), False
Positive (FP), False Negative (FN), accuracy, Kappa. According to Kuhn and
Johnson (2013, p.254), a confusion matrix is ‘. . . a simple cross-tabulation of the
observed and predicted classes for the data.’. 48
Ergodicity An ergodic Markov chain will be memory-less for a sufficiently long timescales
MacKay (2003). A discrete space Markov chain ‘is ergodic if all its states are
ergodic’ and ‘a state is ergodic if it is aperiodic, recurrent and non-null’(Murphy,
2012) and Murphy then goes on to state his theorem 17.2.2 ‘Every irreducible
(singly connected), ergodic Markov chain has a limiting distribution, which is
equal to π, its unique stationary distibution’. . 40
Gelman’s Rˆ (Gelman et al., 2013; Gelman and Rubin, 1992) is used as an indicator of the convergence of MCMC chains and works by calculating the variance within
and between chains. A value of ˆR which is close to 1.0 indicates likely
conver-gence. It is closely related to Gelman’s method for calculating the effective chain
length. neffective. Note that Gelman has changed the exact definition of how ˆR
is calculated over recent years, and this description is taken from Gelman et al.
(2013, Section 11.4, page 284). Given a set ofm Markov chains each of length n,
sequence varianceB and the within sequence variance,W:
B = n
m−1 m
X
j=1
(¯θ.j−θ¯..)2 where
¯
θ.j = 1
n
n
X
i=1
θij
¯
θ.. = 1
m
m
X
j=1
¯
θ.j
W = 1
m
m
X
j=1
s2j where
s2j = 1
n−1 n
X
i=1
(θij −θ¯.j)2
Then we can estimate the weighted marginal posterior variance of the estimand,
and then finally we calculate ˆR:
ˆ
var+(θ|Data) = n−1
n W +
1
nB
ˆ
R=
s
ˆ
var+(θ|Data)
W
. 62
Gini Coefficient The Gini Coefficient (Gini, 1912; Ceriani and Verme, 2012) is widely
used to describe income inequality, and in a society where everybody earns exactly
the same amount, then the Gini coefficient will be zero and where all income is
earned by a single person, then it will have a value of one. The particular version
we use1 is calculated as follows: Given a pre-sorted vector X of the values of
interest with length N, and Xi denotes the ith element of the sorted vector X,
then we calculate as: N1
2PNi=1ixi
PN
i=1xi
−(N + 1)
. 26
IEEE double a computer number format which is widely used to hold real valued
numerical quantities and is defined by an IEEE standard IEEE Task P754 (2008)
and is held in 8 bytes. The R language R Core Team (2015)‘numeric’ type is
defined to be an IEEE double 2 . 99
Kappa attempts to highlight the real gain in the performance of the classifier
com-pared to a classifier which was completely random, range is zero to one. If O
1R package ‘
ineq’ function ‘Gini()’, (Zeileis, 2014)
2
is the observed accuracy and E is the expected accuracy based on the marginal
totals of the confusion matrix, then Kappa = O1−−EE, (Kuhn and Johnson, 2013).
Kappa can take on values between −1 and +1 and zero means that there is no
match while −1 means perfect disagreement and +1 means perfect agreement
between the observed and the predicted classes. . 49, 88
MAR Missing At Random, frequently used in reference to the imputation of missing
data. This refers to the case where data is missing at random in a way which
is independent of the covariates that we are interested in, which contrasts with
MNAR and MCAR 3. xxiii, 40
MCAR Missing Completely At Random, frequently used in reference to the
imputa-tion of missing data and sometimes called ‘uniform non-response’. In this case
there is no pattern to the missingness at all. Contrast with MAR and MNAR 4.
xxiii, 40
MNAR Missing Not At Random, frequently used in reference to the imputation of
missing data. In this case the data that is missing is correlated with the covariates
of interest and often occurs in political surveys where people at the top and
bottom of the income scale do not respond. Contrast with MAR and MCAR 5.
xxiii, 40
UAT is when the customer tests software before formal acceptance that it is to
spec-ification. 8
3www.missingdata.org.ukcomprehensively describes the difference between these mechanisms in
the article ‘Missingness Mechanisms’
4www.missingdata.org.ukcomprehensively describes the difference between these mechanisms in
the article ‘Missingness Mechanisms’
5
Chapter 1
Introduction
This chapter outlines the rest of the thesis and summarises the main contributions.
This research is about the modelling of the number of bugs in software systems. The
terms ‘bug’, ‘fault’ and ‘error’ will be used interchangeably, though in some literature
they have very specific and distinct meanings.
The dataset used in this research is from Open Source Software (OSS) and was
extracted from open sources of data and have been made available to other researchers
as part of this research.
1.1
Statistical motivation
Software is becoming increasingly complex and managing software projects is getting
more and more difficult. Bugs in software are now considered a given and rather than
trying to eliminate them, the goal is around their management. We extend previous
work by looking at how information across multiple versions can be used for inference
on future versions which we do using a hierarchical Non-Homogeneous Poisson model
combined with a data imputation model for labelling bugs which have no version.
1.2
Outline of the thesis and contributions
This thesis is divided into following chapters:
Chapter 2: Background Information
source software in particular. Software bug databases are discussed and the dataset
used as the motivation for this work is described. In particular a new dataset,
Firefox-2013, is introduced.
Chapter 3: Statistical Theory
This chapter reviews statistical inference and the Bayesian approach. Secondly, we
briefly outline the theory of Monte Carlo methods and Markov chain Monte Carlo
(MCMC). Thirdly, we review classification, and the distinction between generative
and declarative models. Finally we discuss models of software reliability.
Chapter 4: Goel-Okumoto
This chapter reviews the Goel-Okumoto model and looks to extend this work to
soft-ware projects where there are multiple related versions of the same softsoft-ware released
one after the other.
Chapter 5: Semi-Supervised Classification
Chapter 5 introduces the version model in a standalone form and shows that it is
surprisingly useful. This model imputes missing version labels in the bug database.
Chapter 6: Combined model
Chapter 6 presents the combined model and the results. The combined model takes
the version model which imputes labels and uses the Goel-Okumoto model on top of
this.
Chapter 7: Case Study
Chapter 6 presents a case study based on the Firefox dataset and looks at the optimal
release period by maximizing the expected utility.
Chapter 8: Discussion
Chapter 8 discusses the results and discusses future work.
The last chapter briefly concludes the thesis.
1.3
Research Contributions
The following are the main contributions described in this thesis:
1. A new dataset, Firefox-2013, has been published for the community researching
software reliability.
2. Combining the information from successive versions can lead to better estimates
of parameters.
3. Using the information in the unlabelled bugs to augment the labelled bugs to
improve modelling.
Chapter 2
Background Information
2.1
Introduction
This chapter informally outlines some background information for this thesis and is
intended as a very short overview of software development, bugs and some of the issues
involved. Those already familiar with the domain can skip forward in this chapter to
Section 2.4 where there is a description of the dataset used later.
2.2
Background Information on Software
Develop-ment and Open Source
2.2.1
Software Development
Software development concerns the production of software whether in a commercial
or non-commercial setting, and the processes and procedures surrounding it. Software
engineering is famously defined by Boehm (1976) in his seminal paper at which time
software was already worth some $20 billion in the USA.
‘Software engineering is the means by which we attempt to produce all of
this software in a way that is both cost-effective and reliable enough to
deserve our trust.’
While some have taken to referring to ‘software engineering’, Lutz et al. (2014)
describe the first undergraduate degree in software engineering (as distinct from
Technology (RIT). As a discipline software development is still very young compared
to other professional engineering disciplines such as civil engineering which can
demon-strate large scale projects requiring the coordination of huge numbers of people - think
of the Roman aqueducts about 2,000 years ago, the Egyptian pyramids about 4,000
years ago or Newgrange in the valley of the Boyne about 5,000 years ago.
Professional software development was in quite some turmoil in the early 1970s
when Knuth (1974) wrote his paper summarizing the arguments for structured
pro-gramming, which at the time was quite controversial. In that paper Knuth claimed
that ‘premature optimization is the root of all evil’, and by that he meant that
pro-grammers regularly try to write the ‘best’ code (using their definition of best) instead
of trying to write code that is reliable and maintainable. Software engineering as a
discipline still has considerable difficulties coordinating more than a handful of people
at a time. Bugs can easily be introduced when there are communications problems in
a team or between teams on a project. Many countries now have mandatory
certifi-cation of professional engineers, but not for software development. In safety critical
areas such as nuclear safety, air traffic control systems, motor vehicle braking systems
and medical devices, there has been considerable progress made in moving towards a
strict and refined development process, but in many small IT companies and in Open
Source, the process is considerably more ad hoc. There is currently work going on at
the International Organization for Standardization (ISO) relating to software for
med-ical devices, led by Dr. Fergal Mc Caffery of Dundalk Institute of Technology (DKIT),
and International Electrotechnical Commission (2014) was published in May 2014 and
a number of other documents are in train.
Historically the development of software traditionally went through a number of
separate and distinct phases: requirements gathering, design, coding, testing, release
and maintenance. Crucially, the duration of each phase of the project was dependent on
the functionality that was promised. Software was produced in a so called ‘Waterfall’
methodology, i.e. that everything was specified in advance, the customer signed off
on massive requirements documents and then a year or two later they would receive a
delivery of the final product. Since the majority of these huge projects failed1, there
has since been a movement to reduce the size of each ‘deliverable’. In many cases
1Depending on which reference you look at, some say more than 90% of these large projects fail to
the requirements had gone out of date by the time the software was delivered. Quite
simply, it is easier and less risky to deliver a few small projects on time and on budget
than a single big project.
An extension of the waterfall model was the ‘V-model’ where the left hand side of
the ‘V’ comprised of the traditional development process, the software was ‘released’
at the base of the ‘V’ and the right hand side of the ‘V’ was the rest of the lifetime of
the software.
A further extension to the ‘V-model’ is the ‘W-model’ where the development life
cycle is in the left hand side of the ‘W’ and the testing life cycle is in the right most
half of the ‘W’, but there is still a clear separation between development and testing.
Agile programming was first expounded by Schwaber (1997) who described the
‘Scrum’ (Sutherland, 2012) methodology, which uses fixed short duration ‘sprints’ of
usually one month between releases. This is in marked contrast to the waterfall model
where the phase duration was variable. The Scrum methodology is used widely and in
particular by groups working on web time, including Google, Yahoo! and Microsoft.
At around the same time Beck (1999) was developing the ‘eXtreme Programming’
methodology (XP) and he said that deliverables should involve very small change sets
and Beck advocated having only one feature per release, hence eXtreme Programming.
This is particularly well suited to cloud delivered services as the provider can rollout
new features as and when they see fit. Facebook are proud that their software engineers
are pushed to rollout new features to the public in their first week at work which would
be completely unheard of in older software companies2.
In agile methodologies, the two halves of the ‘W’ are super-imposed so that there
is a test phase closely associated with each stage of development. As the software
requirements are written they are immediately passed to the test team who write the
testing documents against them, so they are written simultaneously and collaboratively
instead. There is an agile methodology calledTest Driven Development (TDD), which
is gaining ground, where the tests are written by the developer before the code. TDD
encourages the developer to mentally better explore the edge cases where bugs are
more likely to occur.
2
Traditionally, the code was created and finished by the development team and
bundled up and passed over to a test team. Often known as ‘throwing the code over
the wall’. The test team looked for bugs and documented these bugs. The development
team then fixed these bugs and created a new build for the test team. There is often a
lot of antagonism between the development and test teams, where the former say the
latter are slowing down the development process by finding bugs and the later retort
that it would all be much quicker if development did not put bugs in their code. This
process was iterated until the production manager decided to release a build to the
customer. At this point, the customer’s User Acceptance Testing (UAT) team started
doing their testing and they sent their bugs back to the company whose test team
verified the bugs and documented them, and the development team fixed the bugs
and so the cycle went. Note also that a non-trivial proportion of fixes to bugs will
themselves also introduce bugs, some very significant indeed like the famous
‘heart-bleed’ bug in OpenSSL which was introduced during a bug fix and caused significant
disruption to secure websites in the spring of 20143. The ‘traditional’ process for
software development is still widely taught and used.
van Vliet (2000) discusses the general principles of software engineering. O’Regan
(2002) discusses specifics of software quality.
2.2.2
Open Source Software
Open Source is a movement which promotes the free distribution of products, most
notably software. Many well known software systems are Open Source, including the
Linux Kernel4, Mozilla Firefox5, Mozilla Thunderbird6 and the Apache webserver7.
Fitzgerald (2006); Raymond (1999); Feller and Fitzgerald (2002) go into some
con-siderable detail about Open Source8 software which is developed in a non-traditional
fashion, though these books are a bit dated now and Open Source development
method-ologies move quite quickly compared to those in many large commercial organizations
which do not understand the threat that their businesses are under. The source code
3https://cve.mitre.org/cgi-bin/cvename.cgi?name=CVE-2014-0160 4http://kernel.org
5http://www.mozilla.org/en-US/firefox/fx/ 6
https://www.mozilla.org/en-US/thunderbird/
7
http://httpd.apache.org/
8
is available for anybody on the Internet to download at any time, and anybody can
write useful code which can be incorporated into the main trunk of code. Many coders
will cooperate with others to build bigger useful components, but sometimes complete
outsiders will submit code which is incorporated. Big projects like Firefox will have
dedicated testers, but most of the bugs will be logged by people who are not associated
directly with the project.
The development process methodology in Open Source projects can vary greatly
from extremely structured to extremely unstructured. As a general rule the larger
and older the project the more structured the development process. Linux has been
in development in public since Linus Torvalds made an announcement in the autumn
of 1991 on the comp.os.minix newsgroup. Initially anybody who wanted to make a
change or an addition to the project sent a ‘patch’ to Linus Torvalds and he merged
it into his code. Today there is a hierarchical structure and Torvalds has a number of
lieutenants who manage subsystems, and below there is another layer of people who
manage smaller subsystems (Corbet et al., 2015). However, Torvalds is still the overall
lead on the project.9
2.2.3
Mozilla Firefox Development
Mozilla Firefox is a well known Internet browser which was first released more than ten
years ago in November 2004 and published by the Mozilla Corporation (2013a), itself
a wholly owned subsidiary of the Mozilla Foundation (Mozilla Foundation, 2013). The
Mozilla Foundation is a non-profit organization “dedicated to keeping the power of the
Web in people’s hands.”, 10 The Mozilla Corporation earns revenue primarily through
deals with search providers (Mozilla Corporation, 2013b) and employs many of the
developers and testers who work on Firefox. Recent studies (International
Telecom-munications Union, 2013; w3counter, 2013; Stats, 2013; Wikimedia, 2013; Clicky, 2013)
suggest that there were of the order of 450 million users of Firefox across a number
of versions in 2012 and it has likely exceeded 500 million in 2013, as the ITU has
es-timated the number of Internet users at 2,749 million and Firefox usage is eses-timated
at approximately 20%. Mozilla themselves claim that in May 2015 that ‘Half a billion
9
http://en.wikipedia.org/wiki/History_of_Linux
10
people around the world use Firefox’. 11
Firefox is an open source (Feller and Fitzgerald, 2002) project which derived from
the Netscape browser in 1998 when it was open sourced12. Since 2011 Firefox has been
developed using an Agile (Schwaber, 1997) methodology. Bug reports are public13 and
the source code is in a publicly accessible repository,14. Mozilla Firefox is relatively
unusual in being released on a very short (42 day) fixed release cycle. Version 5 of
Firefox, released on the 21st of June 2011, was the first of the ‘Rapid-Releases’ and
there was a 56 day gap before version 6 was released. Subsequent versions have been
released every 42 days or almost. Firefox version 18 was released on the 8th of January
2013, and version 19 was scheduled for release in the week of the 18th of February
2013, and was actually released on the 19th of February 2013. At the end of May 2015,
the current release is 38 which was released on the 12th of May 2015, and according
to https://wiki.mozilla.org/RapidRelease/Calendar, version 39 will be released
on the 30th of June 2015. Note that https://wiki.mozilla.org/RapidRelease/
Calendar appears to be the authoritative source of information on software releases
by the Mozilla organization despite being a Wiki.
As an open source project, the Firefox project is managed in a transparent way
across the Internet through https://wiki.mozilla.org/Firefox, and bugs can be
reported by anybody to https://bugzilla.mozilla.org, which is a database for
recording and managing bugs relating to the Mozilla project. These bugs often go into
a triage process where duplicates are marked as such and some reports are marked as
INVALID or sometimes that the report is actually an ‘enhancement’.
The Blackduck (2014) project tracks the activity of Open Source projects. As of
the 1st of March 2013, Firefox was made up of 8.8 million lines of code and 1.6 million
comment lines. As of May 2015, Firefox was made up of 13.0 million lines of code
and 2.1 million comment lines. Until early 2007, there were less than 20 contributors
of code in a given month, and then in the spring of 2007 the numbers jumped so
that by June 2007 there were 121 individual contributors. Since then the number of
contributors has grown to more than 300 and appears to be growing still, and there
11https://blog.mozilla.org/press/ataglance/ 12http://en.wikipedia.org/wiki/History_of_Firefox
13Some bugs deemed to be security or HR related are not visible to the public.
14
were 383 unique contributors to the Firefox project in April 2015. As of May 2015, in
total there have been more than 253,000 commits made by 3,499 contributors which
took an estimated 4,064 years of effort using the COCOMO model (Boehm, 1984).
The number of commits in the 12 months to 2015-05-28 is 60,226 and the number of
unique contributors as 1,217. A total of 28,612,890 lines were added and 20,154,184
lines were removed - or possibly just changed.
2.3
Bugs!
Bugs in software are a big problem that can cost money and lives - there are many well
known examples, including the death of patients that were given overdoses of radiation
therapy and banks overcharging15. Knight Capital was caused to loose $465 million
due to a number of software bugs and a poor testing environment16.
Software is unusual in this world in that it does not wear out like physical products,
though it can still fail. Physical products can have design flaws in exactly the same
way that software does, i.e. it does not do what it was supposed to do, but physical
products also have the added failure mode of physical failure when they break. Since
software is digital, it cannot wear out in the same way and it can be copied perfectly.
However, over time large software projects can end up being configured in ways that
were not originally intended and can drift into a less than perfect state. After the
last official release of a product when it is in maintenance, software which is not in
active development can become more awkward to maintain as often the maintainers are
often less experienced developers who did not participate in the original development
of the system and are not that familiar with the code base. Yin et al. (2011) estimated
that between 14 and 24% of bug fixes introduce new bugs into the system. In an
Irish example, the Garda Pulse system was written and maintained by staff from a
large consulting multinational. An acquaintance was asked to review the work and
large sections of it consisted of very poorly written code where hundreds of lines of
code were copy/pasted dozens of times with only a tiny modification each time. Best
practice which would be to re-factor the code and parameterize it - should a change
have been required in this code, then all of cases of the copied code would have needed
15
http://en.wikipedia.org/wiki/List_of_software_bugs
16
to be changed - making it highly likely to insert a new bug while fixing an old one.
In software engineering, Fowler has described ‘obvious’ patterns like this as having a
‘smell’17, (Fowler, 1999).
When there is a problem with software we generally call it a ‘bug’. For the purposes
of this thesis, a ‘bug’ is a mismatch between what the user expects and what the
software actually does, although others have used much stricter definitions. This turns
out to be quite difficult to work with, since many users will have different expectations.
A user might report a bug, but the software might have been deliberately designed
with a feature built in this particular way; the software developers will mark such a
bug report as ‘WONTFIX’ and they will close the report, i.e. they have no intention
of fixing this bug. This is seen on a regular basis by those subscribed to the R-HELP
and R-DEVEL mailing lists relating to R (R Core Team, 2015), as users claim to have
found a bug in R and in most cases, the R-Core team reply that they have not found a
bug in R and that the user has misunderstood. There may be no documents saying that
the software is designed in this particular way, but it is the developers who effectively
own the bug database, and have the final word. Requirements and specifications can
exist as a collective understanding amongst a group of developers, built through time
in chats over the Internet or in the pub, and they will be adamant that this piece
of software was always meant to be created in a particular way despite there being
no written document to say this. Some large Open Source organizations, such as
Mozilla, now employ full-time product managers whose job it is to define the expected
behaviour of the product. Note that the definition of a bug that is commonly used
in proprietary software development is a mismatch between the original specification
and what software actually does, e.g. Musa et al. (1987), on page 8, defines a software
failure as:
‘. . . the departure of the external results of program operation from
require-ments.’
However, in Open Source development there is frequently no set of written
require-ments or a specification as the software is not created as a “product”, but by groups
of developers who want to do things better or differently. It is possible that some of
these developers might have sketched out some requirements but they are laying at
home or have been thrown in the bin. Equally, some Open Source projects, like Perl,
create detailed and long lasting specification documents which go through long review
processes18.
People think of failures as being catastrophic failures, but they come in all shapes
and sizes from a complete crash to a bank miscalculating the interest you must repay
on your loan to the trivial misspelt label in some hidden backwater of the software
which nobody normally ever sees. These differences are normally labelled in a bug
tracking system using the Severity variable and for Bugzilla it has the following levels:
blocker, critical, major, normal, minor, trivial and enhancement. This study excludes
bugs marked as enhancement.
Software can fail because of hardware faults, or in rare cases the software executable
can be modified by a cosmic ray and not repaired by error correcting mechanisms
inherent in many components of modern computer hardware and thus cause a failure.
However, in most cases failures are due to a flaw being introduced at some stage of
the production process and exists silently from before the software is ever used. Here
we will concentrate on pure software failures and we will ignore failures caused by
hardware or otherwise. Some literature in the domain, such as Pham (2010), describes
failures in software as if they were hardware failures, i.e. that something was physically
broken, which can be confusing as this is just not the case with software.
The typical life-cycle of a bug is that there is a mistake made in the design or in
the coding stage, and then it can be repaired (possibly imperfectly) at any stage after
that.19 Studies have shown that the cost of a bug increases by an order of magnitude
for each phase later that it is detected; the earliest of these studies are highlighted in
the seminal paper on Software Engineering by Boehm (1976). For example if the cost
of a defect isx when it is detected in the (first) design stage, then it is 10x if detected
in the development stage, 100x if detected in the testing phase and 1,000x if detected
after release.20 Figure 3 in Boehm (1976) shows a plot of some data from IBM, TRW
and GTE which implies a factor of about 2.5 per phase but this is clearly quite old
18http://perl6.org/specification/
19Bugs can also be due to mistakes in a configuration file and nothing to do with the software code.
From the users’ perspective they cannot tell that this is due to a configuration file problem and to them it is just a bug.
20Depending on the study the factor 10 varies from 7 upwards but the principle that the later the
data and the systems developed back then were obviously much smaller in scale. One
explanation of why this occurs is that when a defect occurs in a later cycle, the work in
previous cycles has to be re-done, e.g. if there is a defect in the original requirements,
then this will cause work in all of the following stages, i.e. design, coding and testing
21. More recently, Kan (1995, Section 6.4) describes a number of studies which give
cost ratios of between 1 and 92 and points out that the effort to track down and fix a
bug that is found in the field is much higher.
While Musa et al. (1987) states that documentation defects are not bugs, we argue
that documentation is part of the product as a whole and a documentation defect
will cause the user to have incorrect expectations as to the way the software works,
and thus in our opinion it is a bug. A thorough glossary of testing terminology has
been produced by the International Software Testing Qualifications Board (ISTQB) an
industry body22. The ISTQB defines an ‘anomaly’ as:
‘Any condition that deviates from expectation based on requirements
speci-fications, design documents, user documents, standards, etc., or from
some-one’s perception or experience. Anomalies may be found during, but not
limited to, reviewing, testing, analysis, compilation, or use of software
prod-ucts or applicable documentation. See Also: defect, error, fault, failure,
incident, problem’
Curiously the ISTQB do not define a ‘bug’, but they define a defect as:
‘A flaw in a component or system that can cause the component or system
to fail to perform its required function, e.g., an incorrect statement or data
definition. A defect, if encountered during execution, may cause a failure
of the component or system. Synonyms: bug, fault, problem’
Our definition is supported by the seminal work of Boehm (1976) where the definition
of ‘software engineering’ specifically includes . . . not only computer programs, but also
the associated documentation required to develop, operate, and maintain the programs
and he further goes on to emphasise this point and writes the following definition:
21
http://istqbexamcertification.com/what-is-the-cost-of-defects-in-software-testing/
22
Fig. 2.1: The life cycle of a bug in the Bugzilla bug tracking system. Copyright The
Mozilla Foundation, licensed under the MPL.
‘Software Engineering: The practical application of scientific knowledge
in the design and construction of computer programs and the associated
documentation required to develop, operate, and maintain them.’
The Bugzilla project defines the life cycle of a bug in the Bugzilla bug tracking
system in their documentation (The Bugzilla Team, 2014, Section 5.4), refer also to
their diagram copied here as Figure 2.1 23.
2.3.1
Bug Databases
In many cases we do not know of the existence of a bug until somebody actually spots
it and records this. Most users do not record bugs but try to ignore them and the first
record is not necessarily the first sight of the bug. Further, a user might not recognize
23
something as a bug. The exception here are so called regression bugs which can be
automatically detected and logged because of an automated test and a framework to
manage it.
It is important to note that the time and date of the failures are actually the time
and date they were first recorded in a bug database, since these bugs have been around
since the software was first created and there is no ‘wear and tear’ in digital software.
For the purposes of this work we are looking at the bugs that are recorded in the bug
database https://bugzilla.mozilla.org/. On the 23rd of April 2014 the millionth
bug was filed in the Mozilla bug database which includes a variety of projects, only
one of which is Firefox. As of 9am on the 9th of October 2014, there were 1,080,387
bugs filed, by noon on the 28th of May 2015 there were 1,169,220 bugs in Bugzilla.
Some bugs are duplicates of previously reported bugs and eventually they will be
linked to the first such bug that was actively examined and commented on by the
triage or development teams and marked as a duplicate. Other bugs will be marked
as ‘WONTFIX’, i.e. somebody on the project with authority has decided, that for
some reason, nothing will be done about this bug and they just close it. Bugs can be
perfectly valid, but if the developers are not able to reproduce it, then they cannot
fix it so it might just be closed, e.g. the infamous user plea “it doesn’t work”. Other
bug reports might not have enough information and will be closed. For the purposes
of this work we will only be looking at bugs which have a resolution of either open,
i.e. ‘—’ or ‘FIXED’. Bugs with a status of ‘UNCONFIRMED’ will be ignored as many
will go on to be marked as duplicates or invalid in some way or else the person doing
triage will tidy up the report to clean it up. Bugs can also occur in configuration files
and example files that are provided with a software release. A consistent approach was
taken to the queries used in this research to reduce bias.
Many developers do not record bugs in bug databases, but instead they either just
0 25 50 75 100
Oct 2011
Jan 2012
Apr 2012
Jul2012 Oct
2012
Jan 2013
Bug Opening Date
Cum
ulativ
e
Bugs
to
date
Bug Severity
trivial
normal
minor
major
critical
2.3.2
Bug Data
Figure 2.2 shows the cumulative number of bugs assigned to version 10 of Firefox as
extracted from Bugzilla in early February 2013. The red vertical dashed line shows the
release date and the blue vertical dotted lines show the release dates of other versions
of Firefox26. Version 10 Extended Support Release (ESR) was released to the public
on the 31st of January 2012 and version 11 was released 42 days later on the 13th
of March 2012. An Extended Support Release (Mozillians, 2011) is given support by
the Mozilla organisation for nine release cycles (54 weeks) helping organisations which
cannot roll-out new versions of Firefox every six weeks. This means that releases with
security patches and other important bug fixes will continue for much longer than the
normal 42 day release cycle. For our purposes, it means that reliable bug data will
continue to be logged for more than a year after the original release date.
2.3.3
Open Data
Open data is an old concept, but has been recently been formalized in a number of ways
including at http://opendefinition.org/okd/and http://okfn.org/opendata/.
‘Open data is data that can be freely used, reused and redistributed by
any-one - subject only, at most, to the requirement to attribute and sharealike.’
- OpenDefinition.org
The advantage of open data for statistics research is that researchers from around
the world can use the same set of data to test their models, thus allowing more direct
comparison between models from different researchers. Until now researchers in the
domain have used either proprietary data which has not been made public, or they
have used the Naval Tactical Data System (NTDS) data which dates back to a paper
(Jelinski and Moranda, 1972) from the early 1970s and which implies to the author
that the data are from the 1960s. It includes no covariate information, and the details
of its origins are classified as defence related. Discussions the authors have had with
others in the domain have failed to shed any light on the issue.
24Thus avoiding creating work for themselves!
25Speaking with Prof. Brian Ripley in July 2012 regarding the R-Project, he recommended looking
at the subversion check-in notes for records of bugs fixed and comparing it with the Bugzilla records.
Curiously, while many authors cite Jelinski and Moranda (1972) as being the source
of the NTDS dataset, the original and difficult to obtain paper does not actually contain
the data for the NTDS dataset, and the first publication of the dataset, to the authors’
knowledge, is in Goel and Okumoto (1979).
Since Jelinski and Moranda (1972)’s seminal work, many papers in the area of
software reliability have used the NTDS dataset. A strength, but also a weakness of
the NTDS dataset is its simplicity.
A number of datasets including NTDS are described in Pham (2010), however all
of these datasets are quite simple, having only dozens of bugs at most and all of these
datasets except one are restricted to only one version, the exception having two versions
with 26 bugs recorded in the first and 43 bugs recorded in the second.
Papers such as Ravishanker et al. (2008) have used data sets other than NTDS
or they have simulated datasets for analysis in their paper, but unfortunately these
datasets are not made available publicly to other software reliability researchers.
Other bug datasets have been published, e.g. (Lamkanfi et al., 2013)27and (D’Ambros
et al., 2010)28, but these datasets are quite complex and intended for those who are
data mining for information within bugs, e.g. looking for swear words within the text
of a bug report29.
2.4
The Firefox-2013 Dataset
Here we describe a dataset on bug discovery for the Internet browser Mozilla
Fire-fox. This dataset has been made publicly available athttps://github.com/seanpor/
Firefox-2013. We have worked hard to make it easily accessible to researchers in
soft-ware reliability and believe that it provides excellent opportunities to allow researchers
to propose and evaluate a variety of software reliability models.
Figure 2.3 shows the cumulative number of bugs for each of the rapid releases of
Firefox. The dashed vertical lines in the figure correspond to release dates. Table 2.1
shows the count of each bug which is labelled with a version in the dataset. We have
taken all versions prior to release 5 and labelled them as ‘PreRapid’, and all bugs
27
https://github.com/ansymo/msr2013-bug_dataset
28
http://bug.inf.usi.ch/
29
0 50 100 150
2011-07 2012-01 2012-07 2013-01 2013-07
Version
5
6
7
8
9
10
11
12
13
14
15
16
17
18
19
20
21
22
23
24
25
Fig. 2.3: Cumulative number of Bugs logged to Bugzilla for each individual
Rapid-Release version of Firefox. The dashed vertical lines correspond to release dates in
marked as ‘UNSPECIFIED’ or ‘TRUNK’ have been relabelled as ‘Unknown’. As can
be seen in Figure 2.3, the paths of each of the known releases are largely parallel to
each other and there are often an inflection points on the release date. This inflection
point is at the point where the number of users (or testers) jumps within a few days
from thousands to tens or hundreds of millions and this could be interpreted in a
Goel-Okumoto model (Goel and Okumoto, 1979) as having a differentb, which we will
discuss further in Chapter 4. Once the next version has been released, the number of
users drops suddenly giving another inflection.
As can be seen in Table 2.1, most defects are recorded against TRUNK or
UN-SPECIFIED, which we have combined and relabelled as ‘Unknown’. Note that we do
not include the many defects which have been marked as an ‘enhancement’, or
re-jected as one of (DUPLICATE, EXPIRED, INCOMPLETE, INVALID, WONTFIX,
WORKSFORME) or it is still in the state UNCONFIRMED.
As previously mentioned, for the purposes of this work we will only be looking at
bugs which have a resolution of either open, i.e. ‘—’ or ‘FIXED’. Bugs with a status
of ‘UNCONFIRMED’ will be ignored as many will go on to be marked as duplicates
or invalid in some way or else the person doing triage will tidy up the report to clean
it up.
2.4.1
Fields in the dataset
The data are based on an ‘academic snapshot’, of the full Bugzilla database made on
the 18th of July 2013. In constructing the ‘academic snapshot’, the Mozilla team have
removed any bugs which might be security or HR related. Our data has been further
filtered to refer to only Firefox bugs on or after 2011-01-01 which are marked as neither
enhancements nor UNCONFIRMED.
The data are taken from a snapshot ofhttps://bugzilla.mozilla.org/taken on
the 18th of July 2013.
There is one record per bug. Note that bug reports are not perfect and may have
mistakes, but they are a record of what was in the Bugzilla database on the 18th of
July 2013. Note too that fields such asbug_severity and priority may be changed
after the bug is originally reported - typically by those in triage or a developer who sees
Release BugCount
PreRapid 102
5 42
6 41
7 41
8 65
9 65
10 99
11 78
12 119
13 125
14 118
15 127
16 85
17 135
18 124
19 126
20 121
21 108
22 91
23 76
24 48
25 23
Unknown 8,461
10,420
Table 2.1: The number of bugs logged to Bugzilla for each individual Rapid-Release
version of Firefox.
fields
Version : The version number of Firefox associated with this bug, e.g. 14, or
‘Pre-Rapid’ to describe any version prior to 5, or ‘Unknown’ for any bug which did
bug id : The original bug number in the Bugzilla database. Further details on this
bug can be queried athttps://bugzilla.mozilla.org/.
bug severity : One of: blocker, critical, major, normal, minor, trivial. Note that
these labels have an order.
bug status : One of: ASSIGNED, NEW, REOPENED, RESOLVED, VERIFIED.
priority : One of: ‘–’, P1, P2, P3, P4, P5. Where P1 has the highest priority and ‘–’
means that no priority has been assigned.
creation ts : A character string POSIX time stamp of when the bug was first inserted
into the Bugzilla database, e.g. "2011-04-13 17:19:05".
reporter : The ID number of the person reporting the bug from the underlying
Bugzilla database - for privacy reasons instead of needlessly using email addresses.
component id : The ID number of the component from the Bugzilla database. There
are 45 components used in Firefox, some of which are shared with other Mozilla
Corporation products like Thunderbird.
2.4.2
Version Covariates
This subsection describes the covariates and how they were created and extracted.
There is one covariate for each version of the software as specified by the Version
field. There are many bugs recorded for each version.
Referring to Section 2.4.2, for each version of Firefox from 5 to 25 we have the
following information:
Version : The release version number, e.g. 5.
Release The release version as text, e.g. ‘release-15.0’.
FChanged : The number of files changed since the previous version.
LInserts : The number of lines added since the previous version.
LDeletions : The number of lines deleted since the previous version.
The items: FChanged, LInserts and LDeletions were obtained by extracting the
tarballs for the source files for all the versions of Firefox and running a command such
as:
diff -r moz-18.0/ moz-19.0/ | diffstat -s
Where moz-18.0and moz-19.0 are the directory trees for Mozilla Firefox Release
18.0 and 19.0 respectively.
Note that the release dates for versions 23, 24 and 25 are after the cut-off date,
18th of July 2013, for bugs in this database.
Note too that where there is a minor change to a line, e.g. a single character is
Version Release FChanged LInserts LDeletions releasedate
5 release-5.0 3618 72367 62832 2011-06-21
6 release-6.0 4276 90398 83114 2011-08-16
7 release-7.0 4493 92537 78987 2011-09-27
8 release-8.0 7341 74473 70222 2011-11-08
9 release-9.0 4377 109381 73509 2011-12-20
10 release-10.0 6073 148795 122633 2012-01-31
11 release-11.0 4805 108274 76724 2012-03-13
12 release-12.0 4457 123432 84129 2012-04-24
13 release-13.0 4688 150233 106764 2012-06-05
14 release-14.0.1 16835 355941 560277 2012-07-17
15 release-15.0 15728 257432 501298 2012-08-28
16 release-16.0 6349 132879 84268 2012-10-09
17 release-17.0 1051 28867 22179 2012-11-20
18 release-18.0 1315 29593 22844 2013-01-08
19 release-19.0 6133 129714 149368 2013-02-19
20 release-20.0 6393 250433 180606 2013-04-02
21 release-21.0 6840 146689 108744 2013-05-14
22 release-22.0 9569 220244 171637 2013-06-25
23 release-23.0 11149 166918 121491 2013-08-06
24 release-24.0 6924 153191 115052 2013-09-17
25 release-25.0 10933 248838 201130 2013-10-29
Table 2.2: Covariate Information on Firefox Releases 5 to 25
2.5
Inequality of effort
An analysis of the raw Bugzilla database for Firefox shows that 29,515 unique email
addresses recorded 60,801 defects between 2008-Nov-20 when the first of the rapid
release bugs was recorded and the 2013-July-18 when the snapshot of the database
was taken. Note that of the 29,515 unique email addresses who recorded bugs, an
astonishing 24,392 or 83% recorded only one bug. At the other extreme, one particular
Clearly with hundreds of million users and only 29,515 unique email addresses
recording bugs, there must be bugs that have been seen many times and other bugs
that have been seen and not recorded.
Putting it another way, has the reader experienced an issue with Firefox? If so,
have they reported this to the Mozilla project?
As a simple illustration of the sorts of analyses that can be done with the
Firefox-2013 dataset, we look at the number of people who just report one bug and compare
it with the number of people who report more than one bug we can see that across all
versions of the dataset, that as time progresses that fewer people are doing more of the
work. Refer to Figures 2.4 to 2.8. A loess smoother30 has been added to these plots.
The extent of this can be measured using the Gini coefficient (Gini, 1912; Ceriani
and Verme, 2012), which is normally used for measuring income inequality. In it’s
common usage, a Gini Coefficient of 1.0 means that all of the wealth of a country is
concentrated in one person and a coefficient of 0.0 means that the wealth is perfectly
evenly distributed. So in the normal context of the Gini coefficient, a time increasing
Gini coefficient increasing means that that the wealth of that country is becoming
concentrated in fewer people.
In this case, the higher the Gini coefficient, the more that a small number of people
are reporting more bugs, and also that a large number of people are reporting only one
bug.
In the Firefox-2013 dataset there are a total of 1,761 separate email addresses31who
recorded 10,420 bugs. However, the top ten testers recorded 2,397 bugs, or 23% of the
total, and 1,103 testers only recorded one bug. This corresponds to a Gini coefficient of
0.758, Figure 2.4. If the Gini coefficient was zero, then there would be a single vertical
bar in this graph, i.e. everybody would be reporting the same number of bugs.
Curiously, the Gini coefficient for bug reporting email addresses seems to be
in-creasing over time, see Figure 2.8. The implication of an inin-creasing Gini coefficient is
that there is a smaller and smaller group of testers who are doing more and more of the
work and that the majority of the testers recording bugs only record a small number
of bugs.
30R function ‘
stats::loess()’