Munich Personal RePEc Archive
Issues and problems in human resource
development in the NER (India)
Mishra, SK
North-Eastern Hill University, Shillong (India)
25 October 2003
Issues and Problems in
Human Resource Development in the NER
SK Mishra Dept. of Economics NEHU, Shillong. 1. Introduction: Population, its composition and structure, its quality and interrelationship among its constituent individuals and communities are perhaps the most important determinants of development of a region. The composition and structure of population has several dimensions – distribution of the total between male and female, among different age groups, among different religious and ethnic groups, among different classes, occupations, skill categories, abilities and so on. Similarly, quality of population, illiterate, literate and educated, unskilled and skilled, pre-modernized and pre-modernized in their attitudes, behaviour and action, is very important. Interrelationship among different individuals at family, class, ethnicity and region levels also are equally important. And this importance is not mainly for sake of classification and presentation in tabular form, but for the fact that it impinges on the contribution of population towards making themselves, the region and the nation progressively better.
2. A Profile of Human Resources in NER: The demographic canvas of the North Eastern Region of India (NER) is perhaps the most colourful and enchanting in the whole nation. We do not find in any other part of the country such a variety – anthropologically, socially, linguistically, culturally, economically, politically and historically diversified stock of mankind. If the biologists are correct to correlate diversity with survival, sustenance, development and growth, the NER possesses the most potent prospects for the same.
The NER comprises eight socio-political units : Arunachal Pradesh, Assam, Manipur, Meghalaya, Mizoram, Nagaland, Sikkim and Tripura. Over the years the population in these socio-political units (States) have shown interesting trends.
Table 1 : Trends in Growth of Population in NER (1901-2001) Year Arunachal
Pradesh *
Assam Mani-pur
Megha-laya
Mizo-ram
Naga-land
Sikkim* Tripura NER * (Million)
India (Million)
1901 58 3290 284 341 82 102 53 173 4.38 238
1911 78 3849 346 394 91 149 63 230 5.20 252
1921 104 4637 384 422 98 159 75 304 6.18 251
1931 139 5560 446 481 124 179 90 382 7.40 279
1941 187 6695 512 556 153 190 108 513 8.91 319
1951 251 8029 578 606 196 213 129 639 10.64 361
1961 337 10837 780 769 266 369 183 1142 14.68 439
1971 468 14625 1073 1012 332 516 247 1556 19.83 548
1981 632 18041 1421 1336 494 775 316 2053 25.07 683
1991 865 22414 1837 1775 690 1210 406 2757 31.95 846
2001 1091 26638 2389 2306 891 1989 540 3191 39.04 1027
Source: Basic Statistics of NER 2000. Note:* Population figures for Arunachal Pradesh (1901-51) and
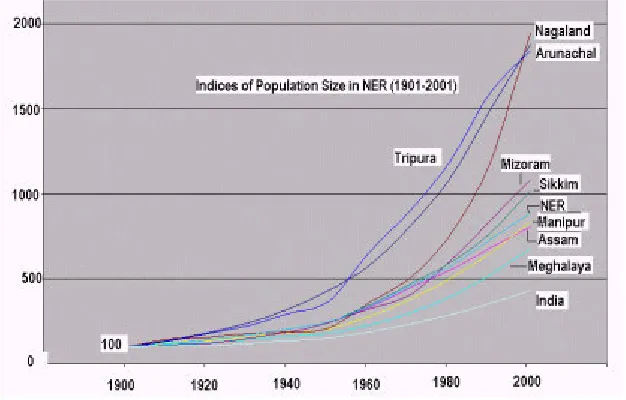
These figures suggest that first during 1901-1951 the growth of population in almost all states of NER exhibited a linear growth. It may be noted that 1941 Census reported pre-Independence (pre-Partition) population while 1951 Census reported post-Independence (post-Partition) population. Since then, growth rate of population in almost all states of NER exhibited a consistent acceleration.
Table 2 : Index of Growth of Population in NER (1901-2001) Year Arunachal
Pradesh
Assam Mani-pur
Megha-laya
Mizo-ram
Naga-land
Sikkim Tripura NER (Million)
India (Million)
1901 100.00 100.00 100.00 100.00 100.00 100.00 100.00 100.00 100.00 100.00
1911 134.48 116.99 121.83 115.54 110.98 146.08 118.87 132.95 118.72 105.88
1921 179.31 140.94 135.21 123.75 119.51 155.88 141.51 175.72 141.10 105.46
1931 239.66 169.00 157.04 141.06 151.22 175.49 169.81 220.81 168.95 117.23
1941 322.41 203.50 180.28 163.05 186.59 186.27 203.77 296.53 203.42 134.03
1951 432.76 244.04 203.52 177.71 239.02 208.82 243.40 369.36 242.92 151.68
1961 581.03 329.39 274.65 225.51 324.39 361.76 345.28 660.12 335.16 184.45
1971 806.90 444.53 377.82 296.77 404.88 505.88 466.04 899.42 452.74 230.25
1981 1089.66 548.36 500.35 391.79 602.44 759.80 596.23 1186.71 572.37 286.97
1991 1491.38 681.28 646.83 520.53 841.46 1186.27 766.04 1593.64 729.45 355.46
2001 1881.03 809.67 841.20 676.25 1086.59 1950.00 1018.87 1844.51 891.32 431.51
Of late, people have become conscious of over-using, misusing and disusing the material resources leading to the so-called environmental problems. However, this concern does not change the parameter, only the denotation of ‘people’ has changed. Now ‘people’ means the present and the future generations; earlier it meant only the ‘contemporary’ generation. That does not imply, however, that the stress on ‘resources for the people’ has increased. To care for the resources to bequeath to our grand children needs much to be done by the people of the present generation.
Nevertheless, when we look at the stock of people, with all its ability to transform material and non-material resources at the disposal of the society, we consider the said stock as the resources – the human resources – parallel to non-human resources, minerals, machines, animals, fish, forests, etc. The human ability to transform non-human resources into desired forms and impregnating them with desired attributes gives rise to various types of occupations. When by a concerted effort man brings forth such transformation through the biological processes mostly occurring in nature, the occupations of agriculture, animal husbandry and forestry develop. On the other hand, when such transformation is brought forth by means of mechanical, chemical and electro-magnetic processes, the occupations relating to mining and manufacturing develop. However, when services of a section of people are rendered to others of the same kind, the tertiary sector or ‘services’ as an occupation grows. Of late, information has become a very important resource for development. Generation, gathering, storing and supply of information is soon going to be the fourth sector of the economy since many people are joining these activities for earning their livelihood.
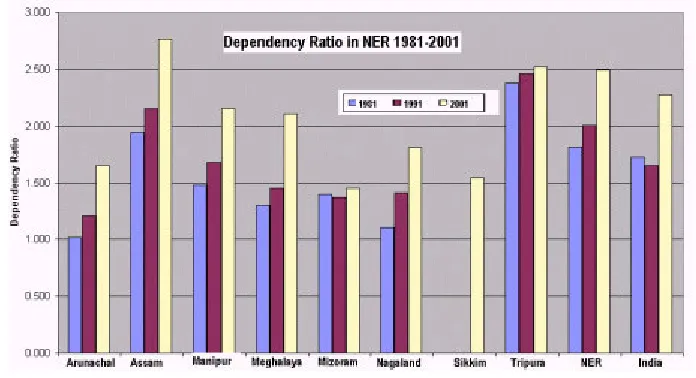
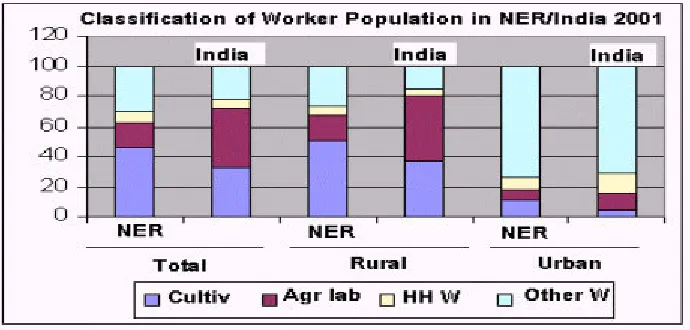
The economic landscape is a portrait of different occupations, which consistently changes with development. As per the Census, 2001, about 28.66 percent of the total population in the region are classified as main workers, the rest of the population largely dependent on these workers. The dependents are in a way the resources in making, the manpower of the future, in which the present generation invests. The dependency ratio in the region is 2.49 against 2.27 in India. Dependency ratio is the lowest in Mizoram (Arunachal Pradesh in 1991) and the highest in Assam (Tripura in 1991). It is generally observed that when a region is underdeveloped, dependency ratio is low because most of the adult population including women and adolescent do some work in the primary sector. It is required since due to low productivity of labour there is not much surplus that can sustain dependents. However, as the region develops economically, gainful employment of the adult, mostly men, can sustain larger number of dependents, mostly women, minors and the adolescent. As a result, dependency ratio increases. Further economic development leads to reduction in birth rate and the proportion of young population to the total population decreases. Female participation in gainful employment increases. Consequently, dependency ratio decreases. It seems that the NER is passing through the second stage.
up to 58.4 percent. State-wise figures are presented in Table below. It has been noticed that while the percentage of main workers engaged in agriculture (cultivators and labourers) in NER is decreasing, it is on increase at the national level. The 1981, 1991 and 2001 census figures for the percentage of main workers engaged in agriculture in NER are 74.44, 65.03 and 73.06 respectively, these figures for India are 58.80, 57.96 and 75.08 respectively.
Table 3 : Dependency Ratio in NER 1981-2001
State/Unit 1981 1991 2001 State/Unit 1981 1991 2001 Arunachal 1.016 1.203 1.652 Nagaland 1.104 1.406 1.807
Assam 1.941 2.155 2.761 Sikkim - - 1.544
Manipur 1.478 1.677 2.157 Tripura 2.374 2.459 2.521
Meghalaya 1.299 1.448 2.105 NER 1.818 2.004 2.489
Mizoram 1.396 1.365 1.449 India 1.725 1.654 2.274
[image:6.612.122.470.299.488.2]Dependency ratio = Non-Workers/Main Workers in the Population
Table 4 : Percentage of Total Population by Economic Classification - 2001
States W/P MW/W C/W AL/W AW/W HHW/W OW/W NW/W
Arunachal 43.97 85.76 58.44 3.85 62.30 0.86 36.85 56.03
Assam 35.88 74.11 39.15 13.50 52.65 3.44 43.91 64.12
Manipur 44.79 70.73 46.06 11.31 57.38 9.16 33.47 55.21
Meghalaya 41.47 77.66 47.80 18.09 65.89 1.88 32.23 58.53
Mizoram 52.70 77.48 53.91 5.85 59.77 1.40 38.83 47.30
Nagaland 42.74 83.35 64.05 3.98 68.03 2.13 29.84 57.26
Sikkim 48.72 80.69 49.91 6.43 56.34 1.23 42.42 51.28
Tripura 36.29 78.27 26.88 24.03 50.92 2.90 46.19 63.71
NER 37.93 75.56 41.97 13.23 55.20 3.44 41.36 62.07
INDIA 39.26 77.80 31.71 26.69 58.40 4.07 37.52 60.74
Table 5 : Changes in Main Economic Categories of Population during 1981-2001 Economic
Categories
Main Workers as % to Population
Cultivators as % to Population
Agricultural Labourers as % to Population
State/Year 1981 1991 2001 1981 1991 2001 1981 1991 2001
Arunachal 49.61 45.39 37.71 35.35 27.72 25.70 1.23 2.22 1.69
Assam 34.00 31.70 26.59 20.00 16.25 14.05 5.85 4.12 4.84
Manipur 40.35 37.36 31.68 25.66 21.33 20.63 2.01 3.47 5.07
Meghalaya 43.50 40.85 32.21 27.21 22.98 19.82 4.34 5.45 7.50
Mizoram 41.73 42.29 40.83 29.48 25.75 28.41 1.04 1.58 3.08
Nagaland 47.53 41.56 35.62 34.36 28.35 27.37 0.38 1.97 1.70
Sikkim - - 39.31 - - 24.32 - - 3.13
Tripura 29.64 28.91 28.40 12.83 11.00 9.75 7.12 6.80 8.72
NER 35.49 33.29 28.66 21.15 17.45 15.92 5.27 4.20 5.02
India 36.70 37.68 30.54 13.49 13.00 12.45 8.09 8.84 10.48
Table 6 : Percentage of Urban Population in NER (1991 & 2001)
Year Arunachal Pradesh Assam Mani-pur Megha-laya Mizo-ram Naga-land
Sikkim Tripura NER India
[image:7.612.87.565.372.636.2]1991 12.80 11.10 27.52 18.60 46.10 17.21 10.01 15.30 13.78 26.13 2001 20.34 12.72 24.12 19.63 49.50 17.74 11.10 17.02 15.47 27.80
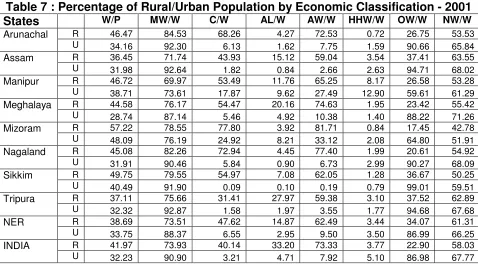
Table 7 : Percentage of Rural/Urban Population by Economic Classification - 2001
States W/P MW/W C/W AL/W AW/W HHW/W OW/W NW/W
R 46.47 84.53 68.26 4.27 72.53 0.72 26.75 53.53
Arunachal
U 34.16 92.30 6.13 1.62 7.75 1.59 90.66 65.84
R 36.45 71.74 43.93 15.12 59.04 3.54 37.41 63.55
Assam
U 31.98 92.64 1.82 0.84 2.66 2.63 94.71 68.02
R 46.72 69.97 53.49 11.76 65.25 8.17 26.58 53.28
Manipur
U 38.71 73.61 17.87 9.62 27.49 12.90 59.61 61.29
R 44.58 76.17 54.47 20.16 74.63 1.95 23.42 55.42
Meghalaya
U 28.74 87.14 5.46 4.92 10.38 1.40 88.22 71.26
R 57.22 78.55 77.80 3.92 81.71 0.84 17.45 42.78
Mizoram
U 48.09 76.19 24.92 8.21 33.12 2.08 64.80 51.91
R 45.08 82.26 72.94 4.45 77.40 1.99 20.61 54.92
Nagaland
U 31.91 90.46 5.84 0.90 6.73 2.99 90.27 68.09
R 49.75 79.55 54.97 7.08 62.05 1.28 36.67 50.25
Sikkim
U 40.49 91.90 0.09 0.10 0.19 0.79 99.01 59.51
R 37.11 75.66 31.41 27.97 59.38 3.10 37.52 62.89
Tripura
U 32.32 92.87 1.58 1.97 3.55 1.77 94.68 67.68
R 38.69 73.51 47.62 14.87 62.49 3.44 34.07 61.31
NER
U 33.75 88.37 6.55 2.95 9.50 3.50 86.99 66.25
R 41.97 73.93 40.14 33.20 73.33 3.77 22.90 58.03
INDIA
U 32.23 90.90 3.21 4.71 7.92 5.10 86.98 67.77
Table 8 : Percentage of Female Population by Economic Classification - 2001
States W/P MW/W C/W AL/W AW/W HHW/W OW/W NW/W
T 36.45 77.71 76.61 4.49 81.10 1.05 17.85 63.55 R 41.33 77.12 82.70 4.65 87.35 0.93 11.72 58.67
Arunachal
U 16.69 83.60 15.44 2.93 18.37 2.26 79.37 83.31 T 20.80 46.55 40.42 16.48 56.90 7.89 35.21 79.20 R 22.28 44.26 42.90 17.44 60.34 7.94 31.72 77.72
Assam
U 10.29 81.65 2.25 1.74 3.99 7.16 88.85 89.71 T 40.51 57.33 45.29 14.27 59.56 16.50 23.94 59.49 R 43.20 57.27 53.02 14.64 67.66 14.64 17.71 56.80
Manipur
U 32.28 57.55 13.62 12.74 26.36 24.13 49.51 67.72 T 35.02 67.97 51.88 20.66 72.54 2.50 24.96 64.98 R 38.92 66.61 57.20 22.23 79.43 2.60 17.97 61.08
Meghalaya
U 19.15 79.17 7.91 7.70 15.61 1.69 82.70 80.85 T 47.63 66.80 60.52 7.05 67.57 1.66 30.77 52.37 R 54.73 68.71 83.40 4.47 87.87 0.91 11.23 45.27
Mizoram
U 40.50 64.19 29.42 10.56 39.97 2.68 57.34 59.50 T 38.25 78.47 75.32 4.34 79.66 3.19 17.15 61.75 R 42.92 78.32 79.51 4.48 83.98 2.89 13.13 57.08
Nagaland
U 14.87 80.60 14.93 2.31 17.24 7.52 75.24 85.13 T 38.59 67.59 62.93 8.55 71.48 0.99 27.53 61.41 R 40.67 66.12 66.92 9.09 76.01 1.00 22.99 59.33
Sikkim
U 21.42 90.72 0.09 0.05 0.14 0.81 99.05 78.58 T 21.02 50.89 27.58 35.00 62.59 6.11 31.31 78.98 R 22.86 47.08 30.55 38.64 69.19 6.26 24.55 77.14
Tripura
U 12.09 85.73 0.48 1.66 2.15 4.74 93.12 87.91 T 25.06 54.74 46.45 15.91 62.35 7.13 30.51 74.94 R 26.64 52.67 50.30 16.97 67.27 6.95 25.78 73.36
NER
U 16.22 73.74 11.11 6.19 17.31 8.81 73.89 83.78 T 25.68 57.19 32.51 39.43 71.94 6.36 21.70 74.32 R 30.98 54.14 36.46 43.40 79.86 5.44 14.70 69.02
INDIA U 11.55 78.97 4.26 11.03 15.30 12.93 71.77 88.45
W = Total Workers; P = Total Population; MW = Main Workers; C = Cultivators; AL = Agricultural Labourers; AW = (C + AL) = Agricultural Workers; HHW = Household Workers; OW = Other Workers; NW = Non-Workers; T = Total; R = Rural; U = Urban.
distribution was somewhat pyramidal. Urban centers developed at the seat of power and supported most of the secondary and tertiary sectors. The primary sector, however, was the most dominant source of surplus to support the towns. Most of the secondary and tertiary sectors directly contributed to consumption, mainly by the power class.
Industrial revolution brought forth a great change in the occupational distribution, aggressively snatching the resources, human and non-human, for manufacturing and trade. The occupation of manufacturing for capital formation rather than direct consumption prospered significantly. That led to the replacement of feudalism by capitalism. Towns developed around the seat of manufacturing and trade. The base of the pyramid depicting occupational distribution became much narrower. In due course, when further technological development followed, the said base grew narrower while the contribution of secondary and tertiary sectors became dominant. Manufacturing created so much of surplus – value added – that it could support a large tertiary sector and the pyramid got inverted.
The less developed regions at present, without the NER being an exception, have advantages as well as disadvantages of being the latecomers in the process of development. The technological development of these regions has been squarely based on adoption and imitation rather than innovation. They have additionally adopted the norms of civic life also from the developed nations. It is to be noted that adoption is much easier than adaptation. Adoption without adaptation is often reflected in pathological alterations in the pyramid of occupational structure. Tertiary sector swells without the surplus base created by the secondary sector. It feeds on the surplus, which in a healthy economic system could have gone into the development of the secondary sector. Bypassing of the secondary sector triggers off the processes that weaken and arrest development of the primary as well as the tertiary sector. This situation leads to urban accretion, gross unemployment, under-employment and disguised unemployment. Little has been done to highlight the extent of under-employment and disguised unemployment in the tertiary sector of the developing regions, the NER in particular. However, it is such a commonplace that it is not difficult to see and experience. An analysis of human development index vis-à-vis economic development index in the NER suggests that human potentialities are grossly under-translated into their potential/optimal economic performance. Economies thriving on low GDP (Gross domestic product – due to low level of industrialisation) and grant sponsored large disposable income may exhibit a modified relationship between the said two indices.
‘ employment’ presupposes a fairly homogenous, mobile labour force, willing and able to work and responsive to incentives. These tacit assumptions of the establishment economics are unrealistic in the case of the NER economy. In a society of isolated communities, the notion of labour force does not make sense. Assimilation and resolute attitude to conservation of ethnic identity can hardly go together. Similarly, ‘ underemployment’ or ‘ disguised unemployment’ presupposes that if only demand and machines were available, men and women would be able and willing to work. In fact, much more would be required: a breakdown of community prejudices, of apathy, of lack of interest in money rewards, of resistance to cooperation, discipline and punctuality, etc. But much of the required actions does not make a part of economic planning and remain the hollow expressions of wishful imperatives.
In the same vein, ‘ urbanisation’ has a definite meaning in the context of economic development. One has to discriminate between ‘ urban accretion’ and ‘ true urbanisation’. Urban centers are flooded with the casual workers who earn no more than the subsistence wages (Mishra & Lyngskor, 2003). Ever-growing slums in the towns, swelling mass of the displaced and dejected rural population hanging on to the informal tertiary sector in the urban areas, overstressed urban infrastructure and the progressive ruralisation of the urban centers suggest a cautious step to be taken in analysis, diagnosis and treatment of the problems of economic development.
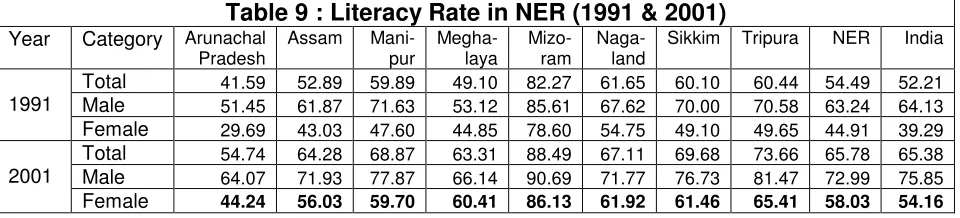
[image:10.612.86.566.501.610.2]6. Qualitative Aspects of the Human Resources: Economic development depends not only on the supply of the brute muscular power that human beings can apply to transformation of the non-human resources to more useful forms, but also on the skill embodied in the manpower applied to the production processes. Skill formation among the illiterate, though very important for economic development, has quite limited scope. Therefore, literacy and some extent of educational proficiency are of fundamental importance. Literacy among the females is of great importance, not only for participation in productive and civic activities, but also for rearing children for a better future. In this respect NER performs better than India as a whole.
Table 9 : Literacy Rate in NER (1991 & 2001)
Year Category Arunachal Pradesh
Assam Mani-pur
Megha-laya
Mizo-ram
Naga-land
Sikkim Tripura NER India
Total 41.59 52.89 59.89 49.10 82.27 61.65 60.10 60.44 54.49 52.21
Male 51.45 61.87 71.63 53.12 85.61 67.62 70.00 70.58 63.24 64.13
1991
Female 29.69 43.03 47.60 44.85 78.60 54.75 49.10 49.65 44.91 39.29
Total 54.74 64.28 68.87 63.31 88.49 67.11 69.68 73.66 65.78 65.38
Male 64.07 71.93 77.87 66.14 90.69 71.77 76.73 81.47 72.99 75.85
2001
Female 44.24 56.03 59.70 60.41 86.13 61.92 61.46 65.41 58.03 54.16
and still better skill by their own efforts. The touchstone of the worth of an education system is in meeting these objectives.
[image:11.612.85.564.223.535.2]The modernized attitudes relate to efficiency, diligence, orderliness, punctuality, frugality, scrupulous honesty, rationality in decisions on actions, analytical rather than dogmatic view to understanding the world, preparedness for change, alertness to opportunities, energetic enterprise, integrity and self-reliance, cooperativeness, acceptance of responsibility for the welfare of the community and the nation, willingness to take the long view and so on. The skills relate to knowing and the application of knowledge to changing things that may be more useful after such a transformation.
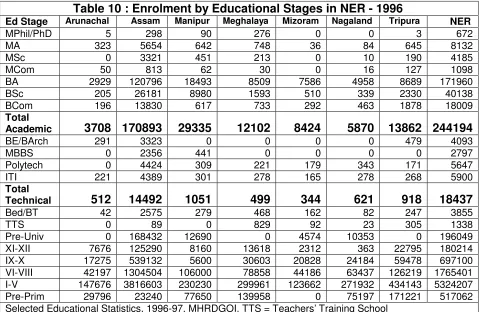
Table 10 : Enrolment by Educational Stages in NER - 1996
Ed Stage Arunachal Assam Manipur Meghalaya Mizoram Nagaland Tripura NER
MPhil/PhD 5 298 90 276 0 0 3 672
MA 323 5654 642 748 36 84 645 8132
MSc 0 3321 451 213 0 10 190 4185
MCom 50 813 62 30 0 16 127 1098
BA 2929 120796 18493 8509 7586 4958 8689 171960
BSc 205 26181 8980 1593 510 339 2330 40138
BCom 196 13830 617 733 292 463 1878 18009
Total
Academic 3708 170893 29335 12102 8424 5870 13862 244194
BE/BArch 291 3323 0 0 0 0 479 4093
MBBS 0 2356 441 0 0 0 0 2797
Polytech 0 4424 309 221 179 343 171 5647
ITI 221 4389 301 278 165 278 268 5900
Total
Technical 512 14492 1051 499 344 621 918 18437
Bed/BT 42 2575 279 468 162 82 247 3855
TTS 0 89 0 829 92 23 305 1338
Pre-Univ 0 168432 12690 0 4574 10353 0 196049
XI-XII 7676 125290 8160 13618 2312 363 22795 180214
IX-X 17275 539132 5600 30603 20828 24184 59478 697100 VI-VIII 42197 1304504 106000 78858 44186 63437 126219 1765401 I-V 147676 3816603 230230 299961 123662 271932 434143 5324207 Pre-Prim 29796 23240 77650 139958 0 75197 171221 517062 Selected Educational Statistics, 1996-97, MHRDGOI. TTS = Teachers’ Training School
technical education (Mishra, 2003-a). During 1976, 2.44 lakh students were enrolled in academic disciplines of higher education, while only 6.8 thousand were enrolled in the professional higher education and some 11.5 thousand were being trained in technical trades (see table 10). The NER has almost a dozen of universities, mostly turning out graduates in liberal arts and academic sciences.
A continued turning out of graduates and master degree holders in academic disciplines has flooded the market of ‘ educated’ manpower. The industrial sector has not expanded. The swelling number of so-called “educated” youth aspiring for jobs is in fact that of the ‘unemployable ones’ - partly because they have not acquired any skill that may be useful for the industry or even commerce, and partly because they have an apathetic attitude to manual work. Therefore they often seek jobs in the government, which suits most to their temperament and ability. The making of such unemployable educated youths is attributable to the higher education system. There is a need to revolutionise the educational system – general education through skill-generating curricula, skill to participate in productive and industrial activities, has to be given.
7. Human Resources and the Social Capital: There is another aspect of the quality of manpower that relates to the social capital – attitudes and institutions (the settled habits of thought and action at the community level) – that grossly determine how people live, earn their livelihood, use or misuse resources to meet their ends and generate, preserve, and economize the resources, innovate or imitate, take risks or be risk-aversive, and so on. And this is more of a concern to the people of affairs, the people busy in the ordinary business of life, since it interferes with and speaks on the individual and social interest closely connected to the attainment of material requisites of their well being. In manpower planning this aspect is grossly neglected. We have often forgotten the imports of the famous ‘Leontief paradox’ that arises by counting labourers disregarding their quality. We have overemphasized multitude of workers and underplayed the role of theirfortitude,aptitudeand attitude.
non-economic factors in economic development. Textbooks, articles and plans do pay lip service to the need to reform the social framework before economic planning begins. However, these declarations are no sooner forgotten than when the discussion on the conventional concepts of income, employment, savings, investment, etc. begins. The reasons are obvious though unsaid. Reforms of institutions and human attitudes, more painful to implement than financial expenditure programmes, violate vested interests of the power class (and the so-called public representatives are often led to think and act in the interest of this class, whether knowingly or unknowingly, by volition or by compulsion).
A rather long excerpt from Streeten (1966) will be illuminating. “… attitudes and valuation and social institutions are normally assumed to be given and adapted. We assume that there is a legal framework, that contracts are enforced, that an efficient civil service carries out government orders and an honest judiciary adjudicates; that people are able and willing to work if opportunities arise; that they are literate, skilled and able to cooperate with discipline, appearing on time and carrying out orders; that money spent is efficiently spent and not diverted into the pockets of corrupt officials; that alternatives are considered largely on their pecuniary merits, etc. It follows that none of these matters is considered a suitable area for planning.” Alternatively, in the Marxist scheme “what are parameters become dependent variables. Cultural, political and social institutions are the superstructure, which is determined by the methods of production. It reflects these conditions and gives rise to tensions and contradictions in due course. These tensions between the degree of development of the forces of production and the prevailing relations of production (the institutions and attitudes) in turn give rise to revolution. After the revolution the attitudes and institutions reflect the new conditions of production. Hence social, cultural and political attitudes and institutions, the so-called relations of production, though dependent variables, are, after a time-lag, adjusted to the extent required by the dynamic productive forces. Once again, though for fundamentally different reasons, planning the superstructure is not in question. It would be futile before the revolution and unnecessary after it. It was indeed for their attempts to speculate on how social attitudes and institutions could and should be reformed that Marx and Engels ridiculed the Utopian thinkers.” Streeten (1966)
8. Mass Poverty and efficiency of Human Resources: From the viewpoint of quality of human resources, poverty of the mass is very important. Mass poverty is important from many angles. Poverty is an issue of distribution of the regional wealth and closely relates to social welfare. It is a political issue also. But when poverty leads to poor health and low efficiency it has a direct bearing on production, the generation of social wealth. In the rural areas poverty is acute. A fair majority of the people in urban areas also is ill fed, ill clad and ill housed.
upon the assumption that investment enables us to produce more later than we would otherwise have done, while consumption is current enjoyment. This notion of investment (or consumption) does not suit the poor economies. The distinction between consumption and investment – if investment is defined as “abstaining for the sake of higher consumption later”, the distinction that suits the rich economies of the West – is applied to the poor economy of the NER, we commit a mistake of applying a category to a field of experience to which it is inappropriate. However, if investment is defined as any input which yields higher output later, irrespective of whether it involves “abstaining” or not, we fail to group certain activities under investment which should be classified as consumption. In the case of India in general and NER too, more food and better health now would reduce apathy and raise ability to work – they share in the characteristics of investment - consumption, too, is productive of more output. From this viewpoint expenditure on poverty removal is not in fact a welfare measure, but ‘ investment’ in the human capital.
Table 11: Percentage of Population below Poverty Line in NER
Year Arunachal Assam Manipur Meghalaya Mizoram Nagaland Sikkim Tripura
1983 40.38 40.47 37.02 38.81 36.00 39.25 39.71 40.03
1993-94 39.35 40.86 33.78 37.92 25.66 37.92 41.43 39.01
1999-2K 33.47 36.09 28.54 33.87 19.47 32.67 36.5 34.44
9. Concluding Remarks: In preceding sections we have touched upon several aspects of human resource development issues and problems. First, the growth of population, very fast in the region demands immediate attention. It is not because growth of population by itself is undesirable. But when economic growth of a region does not lend support to growth of population, resources are spent on maintaining the life than enriching it. Secondly, we have noted the features of occupational distribution. Proportion of workers in the primary and the tertiary sectors are overwhelmingly large, while the secondary sector, most important for material prosperity, employs very small proportion of workers. If human resources are to be better utilized, industrialization of the NER economy is the first prerogative of planning for development. In the same tune, the region produces ‘ educated’ manpower that suits the swelling tertiary sector at most and is possibly unemployable in the secondary sector. Once industrialization takes place, the demand for skilled manpower will increase. The existing educational institutions will have to start technical and professional education programmes. Several new educational institutions will have to be started especially for technical and professional courses suiting to the need of the growing economy.
It is estimated that about 35% of the total population is below poverty line in the NER. Poverty is related to efficiency of the human resources and expenditure on removal of poverty is an investment. Industrialization of the regional economy will go far to remove poverty of the people in the region.
In short, human resources in any region have three aspects increasingly more
important in the sequel: (1) physical fitness – relating to physical effort, easily
captured by the number of workers, their general health (corporal), number of
man-hours devoted to work, etc, (2) dexterity – agility, skill, expertise, ability,
proficiency – inculcated by training, and (3) attitude, outlook and mindset –
imbibed modernization ideals (in the sense of Gunnar Myrdal, pp. 38-40) and
their practice at a mass level. This third aspect makes ‘soft resources’ or the ‘social
capital.’ The first two aspects of human resources are generally considered in planning for development. However, there is a need to devise suitable and practical programs for preserving and generating social capital. It is a difficult area often bypassed by the economic planners under the umbrella of non-economic factors. But this neglect is anti-productive. We should note what Myrdal
said once – there are no economic problems, social problems, political problems
and so on. There are problems, and their economic, social and political aspects.
A general feeling of skepticism has been observed in talking of and far more in an attempt to including attitudinal variables and the modernization ideals in economic analysis, which centers on their amenability to quantification. Nevertheless, we should note that the classical methods of collecting data and measurement of so-called ‘economic variables’ may well be enriched and extended to use the methods of experimental economics on which Kahneman and Smith have done serious works. Experimental methods devised by them will come handy to measure and incorporate attitudinal variables in economic planning (Mishra, 2003-b).
References
• Mishra, SK (2003) “On Self-financing of Institutions of Higher Learning in India” Available at The United Nations Online Network in Public Administration and Finance http://unpan1.un.org/intradoc/groups/public/documents/APCITY/UNPAN024233.pdf or DOI: 10.2139/ssrn.454520
• Mishra, SK (2003-b) “Institutional Economics: Its Relevance to the North Eastern Economy of India”. http://www.freewebs.com/nehu_economics
• Mishra, SK & Lyngskor, JW (2004). “Real Wages of Casual Labourers in Shillong” Social Science Research Network at http://ssrn.com/abstract=481502
• Myrdal, Gunnar (1971) Asian Drama: An inquiry into the Poverty of Nations. (abridged by Seth S King), Vintage Books, New York.
• North Eastern Council (2000) Basic Statistics of North Eastern Region 2000, Ministry of Home Affairs, Govt. of India, Shillong.