AR Modeling for Cardiac Arrhythmia Classification using
MLP Neural Networks
A.Ouelli
Laboratoire de Physique de la Matière et Nanotechnologie University Sultan Moulay Slimane
Beni Mellal Morocco
B.Elhadadi ,H.Aissaoui
Laboratoire de Physique de la Matière et Nanotechnologie University Sultan Moulay Slimane
Beni Mellal Morocco
B.Bouikhalene
Laboratoire de Traitement d’Information et Telecommunication University Sultan Moulay Slimane
Beni Mellal Morocco
ABSTRACT
In this paper, we propose a three stage technique for cardiac arrhythmia classification. This method includes a de-noising module, a feature extraction module and a classification module. In the first module we investigate the application of a FIR least squares filter for noise reduction of the electrocardiogram (ECG) signals. The feature extraction module explores the ability of autoregressive model (AR) to extract relevant features from one-lead electrocardiogram signals in order to classify certain cardiac arrhythmias. Then a number of multilayer perceptron (MLP) neural networks with different number of layers and seven training algorithms are designed. The performances of the networks for speed of convergence and accuracy classifications are evaluated for various ECG data types including normal sinus rhythm, atrial premature contraction, premature ventricular contraction, ventricular tachycardia, ventricular fibrillation and Supraventricular tachycardia obtained from the MIT-BIH database. Among the different training algorithms, the resilient back-propagation (RP) algorithm illustrated the best convergence rate and the Levenberg–Marquardt (LM) algorithm achieved the best overall detection accuracy. The classification accuracies of the six types of arrhythmia were 98.7% to 100% which is a significant improvement.
Keywords
Autoregressive model, cardiac arrhythmia, ECG features, ECG classification, MLP, RP algorithm, LM algorithm, neural networks, MIT-BIH database.
1.
INTRODUCTION
The ECG is the most important biosignal used by cardiologists for diagnostic purposes. The ECG signal provides key information about the electrical activity of the heart. The early detection of the cardiac arrhythmias can prolong life and enhance the quality of living through appreciates treatment. Therefore, we need many techniques that analyze the ECG signal to detect the heart diseases. In this paper, the following arrhythmia categories have been considered: Normal sinus rhythm (NSR), Pre-ventricular contraction (PVC), Ventricular tachycardia (VT), Ventricular fibrillation (VF), Supra ventricular tachycardia (SVT) and Atrial premature contraction (APC). Among those threatening arrhythmias, VT and VF are most dangerous because they produce the hemodynamic deterioration. Sudden death accounts for approximately half of all deaths from cardiovascular disease and is generally caused by VT and VF. Other arrhythmias such PVC, APC etc, are not so lethal, but are also important for diagnosis. PVC arrhythmia, result from the existence of ectopic centers in the ventricular area of the
classification performance [13,14]. Accordingly, in the current work we exploit the capability of AR modeling parameters to classify six types of cardiac arrhythmias namely NSR, APC, PVC, SVT, VT and VF. In the classification stage, we have used the Multilayer Perceptron Neural Network. Three hundred sample patterns each from the six classes were selected for classification. In this paper, we propose an automated method for cardiac arrhythmia classification. In the preprocessing module, a FIR least squares filter is used to provide an informative representation that is both robust to noise and tuned to the morphological characteristics of the waveform features. For the feature extraction module we have used a suitable set of features that consist of six coefficients resulting from autoregressive modeling of the three components of the ECG signal (P, QRS, T waves). Then we investigated several MLP neural networks by varying number of hidden layers and neurons for each layer. Multiple algorithms were employed for training of neural networks. The performance of these algorithms was compared in several experiments. The paper is organized as follows. Section 2 describes the preprocessing module. Section 3 explains the feature extraction. Section 4 presents the classifier. Section 5 describes the database and performance metrics. Section 6 shows some simulation results. Section 7 discusses the results and finally Section 8 concludes the paper.
[image:2.595.319.530.339.551.2]2.
ECG DATA PROCESSING
2.1
Preparing Data for AR Modeling
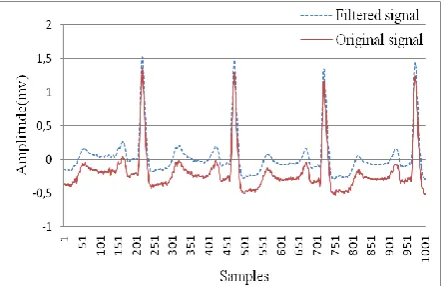
The data in the analysis was obtained from the MIT-BIH Arrhythmia Database (MITDB), Creighton University Ventricular Tachyarrhythmia Database (CUDB), and MITBIH Supraventricular Arrhythmia Database (SVDB). The NSR, PVC and APC were sampled at 360Hz, the VT and VF were sampled at 250Hz, and the SVT was sampled at 128Hz.Fig. 1 Suppression of noise from ECG record No105
The data including VT, VF, and SVT were resampled in order that all the ECG signals in the analysis had a sampling frequency of 360Hz. ECG recordings are very often contaminated by residual power-line (PL) interference, base-line drift, artifacts and EMG disturbances due to involuntary muscle contractions (tremor) of the patient. The base-line drift resulting from electrochemical processes at the electrode-to-skin barrier is a typical low-frequency noise that distorts the
susceptible ST segment. All ECG data have been filtered by a FIR least squares filter with a pass band [0 40] Hz to remove the DC drift and the other types of noise (Fig. 1).
The QRS complexes used in this context were extracted from the filtered signals based on the arrhythmia database annotations. A normal ECG refers to the usual case in the health adults where the heart rate is 60~100 beats per minute, RR intervals in APC are shorter than NSR, the RR intervals in VF and VT are much shorter than normal. In the current study, the sample size of the various segments was cycle varying, it is dynamically estimated according to the cardiac rhythm; 34% of RR interval samples before R peak and 66% of RR interval samples after R peak were picked for modeling. It is adequate to capture most of the information from a particular cardiac cycle (P, QRS, and T). Finally the following types of ECG data were ready for AR modeling and feature extraction, a brief description is given for each class [15].
2.1.1
Normal Sinus Rhythm
[image:2.595.55.278.502.645.2]Heart rate is 60 to 100 beats per minute, P waves are rounds, smoothes and uprights in lead 2. Every QRS complex is preceded by a P wave. Each P wave is the same distance from the QRS complex less than 0.20 seconds. All QRS complexes are similar in size and shape and point in the same direction. Each QRS has the same distance from the T waves and the QRS duration is 0.10 seconds or less. Refer Fig.2.
Fig.2 Patterns of NSR (record 100 of MIT-BIH database)
2.1.2
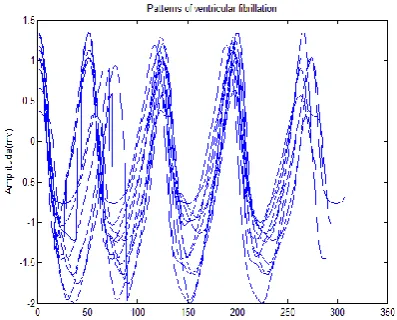
Ventricular Tachycardia
VT is a rapid heartbeat that originates in one of the lower chambers (the ventricles) of the heart. To be classified as tachycardia, the heart rate is usually at least 100 beats per minute. There are widened QRS complexes .The rhythm is usually regular, but on occasion it may be modestly irregular. Rapid ventricular rhythms are more serious than rapid atrial rhythms because they make the heart extremely inefficient. Refer Fig.3.
2.1.3
Supra Ventricular Tachycardia
Aberrant conduction during SVT results in a wide complex tachycardia. The P waves are frequently buried in preceding T waves and difficult to see due to the fast rhythm of this arrhythmia. Refer Fig.4.
[image:3.595.325.528.81.431.2]Fig.3 Patterns of VT(record cu13 of CUDB database)
Fig. 4 Patterns of SVT (record 800 of MIT-BIH database)
2.1.4
Premature Ventricular Contraction
PVCs result from any disruption of the normal electrolyte shifts during depolarization and repolarization, they are caused by the existence of an irritable ventricular focus. It may be uniform or multiform. Usually PVC is followed by a full compensatory pause because the sinus node timing is not interrupted. PVC may be followed by a non compensatory pause if the PVC enters the sinus node and resets its timing; this enables the following sinus P wave to appear earlier than expected. Characteristics Complex is early Wide QRS (>0.12 seconds), Often has a compensatory pause, not proceeded by P wave and T wave has an opposite deflection. Usually rhythm is irregular. Refer Fig. 5.
2.1.5
Atrial Premature Contraction
During APC, P Waves may have a different shape. PR Interval normally varies in a normal range of (0.12–0.20 sec). QRS interval is Normal (0.06–0.10 sec). After the APC, sinus rhythm usually resumes. Rhythm is irregular whenever APC occurs. Refer Fig. 6.
[image:3.595.62.267.119.479.2]Fig. 5 Patterns of PVC (record 119 of MIT-BIH database)
Fig. 6 Patterns of APC (record 209 of MIT-BIH database)
2.1.6
Ventricular Fibrillation
[image:3.595.326.528.257.428.2]VF is defined as chaotic asynchronous fractionated activity of the heart that occurs with no ventricular depolarization or contraction. No P waves, no QRS interval and no PR interval. The amplitude and frequency of the oscillatory activity can be used to define the type of fibrillation as coarse, medium, or fine. Small baseline undulations are considered fine; large ones are coarse. Refer Fig. 7.
[image:3.595.326.525.556.716.2]2.2
Autoregressive Modeling
The six classes of ECG signals with a sampling frequency of 360Hz were utilized for AR modeling after filtering. A general AR model of order P can be expressed as
P
y(n) = ∑ a
i(n) y(n-i) + e(n)
iWhere y(n) represents ECG signal, e(n) represents unknown, zero mean white noise, which is called modeling error, ai(n)
represents the AR model coefficients.
The model order P means that P past samples are needed to predict the present value of the data. The model was estimated from the points of data from each cardiac cycle of the six types of ECG signals. The model order selection was performed on the six types of the ECG signals, various model orders were preselected to choose the more adequate for best classification, an order of 2 appears sufficient to model ECG signal for the purpose of classification. Burg’s algorithm was used to compute the AR coefficients.
3.
ECG FEATURES EXTRACTION
Physiological signals are frequently characterized by a non stationary time behavior; the ECG signal is highly non stationary within each beat. The AR model coefficients ai(n)
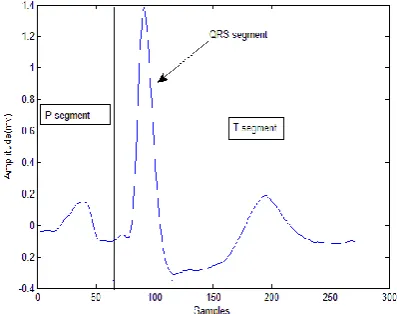
[image:4.595.313.545.81.232.2]are time-varying. In this section a new method of feature extraction for purpose of cardiac arrhythmia classification is presented. The classifier based on the MLP neural networks uses new features extracted from the morphology of each part of the ECG data. The ECG data segments were extracted according to the arrhythmia database annotations. Each segment contains RRi samples (number of samples between two successive R peaks), RRi/3 before Ri peak and 2/3*RRi after Ri peak, the QRS complex were presented by a segment of RRi/6 samples centered on Ri peak as shown in Fig. 8.
Fig 8: Extraction of the three part of a particular cardiac cycle
[image:4.595.65.264.498.655.2]Finally AR modeling was performed on every segment of the cardiac cycle and coefficients were estimated by Burg’s algorithm, a feature vector of six elements was produced for each data patterns. Table 1 show a sample of these feature vectors for the six considered cardiac arrhythmia.
Table 1: Samples of features vectors of the six ECG types APC -1.8873 0.9735 -1.9244 0.9263 -1.9263 0.9333
NSR -1.9060 0.9595 -1.9499 0.9504 -1.9398 0.9399
SVT -1.9485 0.9841 -1.8979 0.9126 -1.9459 0.9541
VF -1.9584 0.9792 -1.9748 0.9920 -1.9761 0.9925
VT -1.9733 0.9871 -1.9520 0.9689 -1.9778 0.9808
PVC -1.9768 0.9872 -1.9778 0.9781 -1.9844 0.9846
4.
DATABASE AND PERFORMANCE
METRICS
4.1
Performance Metrics
One of the significant issues in ECG beat classification is how to appropriately evaluate the performance of a proposed method. In this study, we have considered three statistical indices:
of total tested beats
%
100
of total tested beats
Number
FP FN
Accuracy
Number
of total tested beats
Specificity %
100
of total tested beats
Number
FP
Number
of total tested beats
%
100
of total tested beats
Number
FN
Sensitivity
Number
Where FP stands for the words false positive and FN stands for the words false negative. Sensitivity measures how successfully a classifier recognizes beats of a certain class without missing them, whereas specificity measures how exclusively it classifies beats of a certain type.
4.2
ECG Database
5.
RESULTS
5.1
Features Extraction results
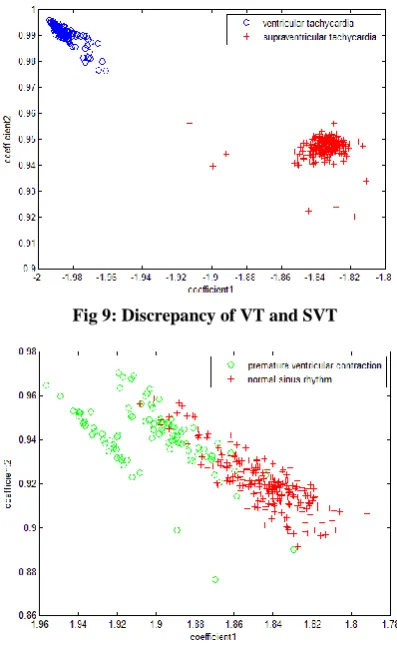
[image:5.595.319.547.258.393.2]The ECG features were extracted by applying AR modeling of order 2 to the ECG signals. This resulted in six AR coefficients to represent an ECG segment. Each beat is featured only with six parameters, two from each beat segment (P, QRS, and T). VTs are characterized by widened QRSs which are less widened in SVTs, P waves are often buried in preceding T waves in SVT beats, then information extracted from the three segments may discriminates them effectively. Fig. 9 shows that there is a very good class separation between VT and SVT. In Fig 10 this discrepancy is less obvious but the class separation will be better when the four other features will be taken in consideration. Then we can conclude that the six features give a good power to classify the different classes of ECG signals.
Fig 9: Discrepancy of VT and SVT
Fig 10: Discrepancy of PVC and NSR
In this research, six types of ECG signals namely, NSR, APC, PVC, VF, VT and SVT were considered for classification which was performed using a number of multilayer perceptron neural networks with different number of layers and seven training algorithms. One hundred and fifty cases each from the six classes were selected at random in training phase, and the remaining cases were used for testing in testing phase. The sensitivity, specificity and accuracy values were computed for all the ECG classes.
5.2
MLP Neural Network Architectures
and Training Algorithms
Various network architectures were evaluated to find an optimum solution for ECG signal diagnosis problem. In order to evaluate system performance, the number of hidden layers as well as the number of neurons in the hidden layers was varied in different experiments. The output (target) vector is defined with a combination of 1s or 0s to represent each of the classes being recognized. To assign the ECG waveforms into one of six different classes, the number of neurons in the output layer is set to be six. Table 2shows the ECG classes and representation of the desired neural network outputs. Table 2: ECG classes and representation of desired neural
network outputs
We investigated four architectures of neural networks. Two architectures, NET1 and NET2 have a single hidden layer with X neurons which was set to 30 and 20, respectively, and we propose two other network architectures NET3 and NET4 with two hidden layer. NET3 and NET4 also have 6 neurons at the input layer and 6 neurons in output layer. Hidden layers of NET3 have both 15 neurons, and these values for NET4 are 15 and 12 neurons. Other parameters for these four architectures are the same. In order to facilitate the performance comparison of different training algorithms, we have used their acronyms. Table 3 shows these training algorithms and their acronyms.
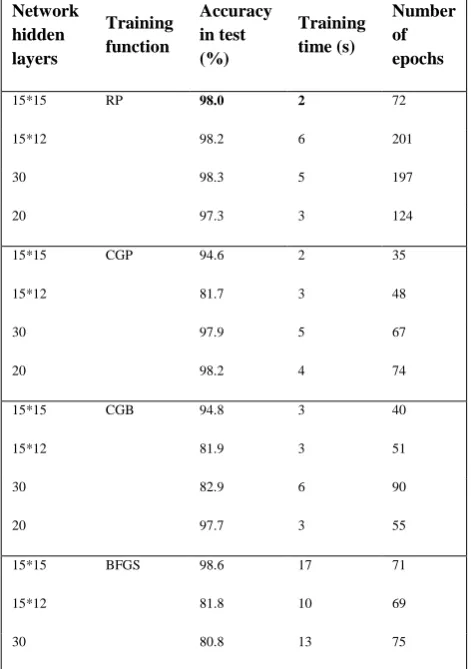
In order to compare the convergence speed and total accuracy of different training algorithms, the classifiers were trained for a predetermined value of mean-squared error (MSE). The number of training iterations, the total accuracies and the time required to achieve the mentioned value of error were recorded. MSE was set to 0.00001. In order to evaluate the recognition accuracies (Acc) of the classifiers with different training algorithms and structures, the classifiers were trained for a predefined number of iterations set at 1000. Three previously defined performance metrics were used for each neural network. For example it can be seen that for NET3 (which has 2 hidden layers with 15 neurons in each layer) the best test accuracy and the fewest epoch numbers are obtained with the LM training algorithm but the best training time was obtained with the RP algorithm. The results are shown in Table 4. In order to simplify the comparison among the different results, we have highlighted in bold type the best results for each of the network structures.
No ECG description Neural network outputs
1 Normal sinus rhythm 1 0 0 0 0 0
2 Pre-ventricular contraction 0 1 0 0 0 0
3 Atrial premature contraction 0 0 1 0 0 0
4 Ventricular fibrillation 0 0 0 1 0 0
5 Ventricular tachycardia 0 0 0 0 1 0
[image:5.595.64.263.275.600.2]It is clear that the best overall accuracy is reached with the NET3 (which has 2 hidden layers with 15 neurons in each layer) and where the Levenberg–Marquardt algorithm is used for training phase. The Levenberg–Marquardt training algorithm gives the best accuracy for all considered architectures.
Table 3: Nine different training algorithms used for training of MLP neural networks
Acronym Algorithm
RP Resilient backpropagation SCG Scaled conjugate gradient
CGB Conjugate gradient with Powell–Beale restarts
CGP Polak–Ribiére conjugate gradient
BFGS Broyden, Fletcher, Goldfarb, and Shanno (BFGS) quasi-Newton backpropagation OSS One-step secant quasi-Newton
[image:6.595.48.284.416.751.2]LM Levenberg–Marquardt
Table 4: Comparative results for total accuracy and speed convergence of different training algorithms Network
hidden layers
Training function
Accuracy in test (%)
Training time (s)
Number of epochs
15*15 RP 98.0 2 72
15*12 98.2 6 201
30 98.3 5 197
20 97.3 3 124
15*15 CGP 94.6 2 35
15*12 81.7 3 48
30 97.9 5 67
20 98.2 4 74
15*15 CGB 94.8 3 40
15*12 81.9 3 51
30 82.9 6 90
20 97.7 3 55
15*15 BFGS 98.6 17 71
15*12 81.8 10 69
30 80.8 13 75
20 80.9 7 77
15*15 OSS 97.4 5 80
15*12 82.0 4 64
30 97.7 8 129
20 98.4 8 132
15*15 LM 99.6 20 38
15*12 98.8 18 46
30 99.0 40 94
20 99.0 9 31
15*15 SCG 99.4 6 117
15*12 82.4 4 74
30 97.8 3 75
20 98.8 5 107
5.3
Classification Results
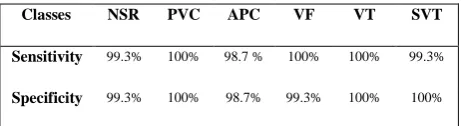
[image:6.595.313.542.583.747.2]The ECG features were extracted by applying autoregressive modeling of order 2 to the ECG signals. This resulted in six AR coefficients to represent an ECG segment in this research. Six types of ECG signals namely, NSR, APC, PVC, VF, VT and SVT were considered for classification. Classification was performed using multilayer perceptron neural networks. One hundred and fifty cases each from the six classes were selected at random in training phase, and the remaining cases were used for testing in testing phase. The sensitivity and specificity values were computed for all the ECG classes. The results of the MLP based classification are shown in Tables 5 and 6. The results for a sample training set are shown in Table 5 and the classification sensitivity and specificity for various classes are shown in Table 6. The accuracy of detecting NSR, APC, PVC, SVT, VT and VF were 99.3%, 98.7%, 100%, 99.3%, 100%, and 99.3% respectively, the overall accuracy is 99.6%.
Table 5: Classification results based on AR coefficients for sample training set
classes NSR PVC APC VF VT SVT
NSR 149 0 1 0 0 0
PVC 0 150 0 0 0 0
APC 1 0 148 1 0 0
VF 0 0 0 150 0 0
VT 0 0 0 0 150 0
Table 6: Performance of the classification based on AR coefficients
Classes NSR PVC APC VF VT SVT
Sensitivity 99.3% 100% 98.7 % 100% 100% 99.3%
Specificity 99.3% 100% 98.7% 99.3% 100% 100%
6.
DISCUSSION
The arrhythmias classification by neural network classifier requires generation of the input vectors which should include features that represent properly the rhythm and the morphology of the arrhythmia, The main objective of this study was to explore the ability of autoregressive modeling (AR) to extract relevant features from one-lead electrocardiogram signals in order to classify certain cardiac arrhythmias. The modeling results showed that the AR order of 2 was sufficient to model ECG signals for the purpose of the classification, the same order was considered in [19] where two AR coefficients and the mean-square value of QRS complex segment were utilized as features for classifying PVC and NSR using a fuzzy ARTMAP classifier, sensitivity of 97% and specificity of 99% were achieved. In the current study a variable sample size based on R-R intervals was considered to extract the relevant information from a particular cardiac cycle then better features were extracted from modeling process, in [14 and 20] a fixed sample size of 1.2 seconds and 0.9 seconds respectively had been used, which lack of exactitude due to the heart variability rhythm (APC and VT samples are much shorter than SNR) .The use of variable sample size enhance considerably the classification accuracy by producing better features.
Physiological signals are frequently characterized by a non stationary time behavior, the ECG signal is highly non stationary within each beat; the AR model coefficients ai(n)
are time-varying. In [13, 14, and 20] these AR coefficients were considered constants over the whole pattern samples; the non stationary nature of the ECG signal is omitted. In our study we divide a cardiac cycle into three part (P, QRS, and T segments), AR coefficients were estimated for each segment separately, which pick some information about the non stationary nature of the ECG signal. Considering the non stationary nature of ECG signals give us better features that enhance the classification performance.
The classification results show that AR modeling can be used to discriminate between different arrhythmias. The classification results achieved using AR modeling is comparable to the recently published results on the classification of cardiac arrhythmias. Normal and abnormal PVC conditions have been classified using the QRS power spectrum and self–organizing maps with sensitivity of 82.71% and specificity of 88.06% [21]. Accuracy of 93% and 96% has been reported for VT and VF respectively using a modified sequential probability ratio test algorithm [11]. An overall accuracy of 93% to 99% was achieved with decimated ECG data and artificial neural networks [22]. The total least squares-based Prony modeling technique produced an
accuracy of 95.24%, 96% and 97.78% for SVT, VT and VF respectively [23].
The current study classifies six types of ECG arrhythmias, the same set of arrhythmias was considered for classification in [13 and 24]. In [13] the accuracy of detecting the same types of arrhythmia were 93.2% to 100% using AR modeling and a generalized linear model based algorithm. The accuracy of discrimination of NSR, APC, SVT, PVC, VT and VF were 99.307%, 99.274%, 99.854%, 98.344%, 99.441% and 99.883%, respectively with a support vector machine (SVM) based classifier [24], the results of our proposed method were 98.7% to 100%.
As our experimental results indicate the classification performance of the MLP neural networks convergence according to speed and accuracy. Generally, it is a difficult problem to determine which training algorithm is the fastest for a given task since many factors are at play. These factors include: the complexity of the problem, the number of data points in the training set, the number of weights and biases in the network, the error goal, and whether the network is being used for pattern recognition (discriminant analysis) or function approximation (regression). To compare the speed of the training methods, consider Table 4. As shown, most of the algorithms have good convergence, but the RP algorithm shows the highest speed of convergence. To compare training algorithms for the classification of the ECG signals, accuracy was calculated for each class. In terms of the recognition accuracy, it can be seen that the LM algorithm achieved the best performance for all the four MLP neural networks considered in this study.
7.
CONCLUSIONS
Autoregressive modeling of the three part of the cardiac cycle give efficient features that characterize separately the three important part of the cardiac cycle; the most relevant information is stored in the QRS complexes.
It should be noted that in addition to selection of classifier type and architecture, feature set selection might also have a vital role in classification results. Further examination of other feature sets with more relevant information about the non linear and non stationary nature of the ECG signal may be warranted in future studies. Other classifiers with higher overall recognition accuracies may also be studied.
In this study, we have used a scalar AR model to extract relevant information from one lead ECG signals. Further work is in progress to use multivariate AR modeling to process and extract relevant features from two lead ECG signals, the preliminary results show a considerable improvement of the classification accuracy. We project also to apply our method to Electroencephalogram (EEG) and other biomedical signals.
8.
REFERENCES
[1] G.D.Clifford, F. Azuaje, P.E. McShary, Advanced Methods and Tools for ECG data Analysis, Artech House, Norwood, MA 02062, 2006.
[2] H.G. Hosseini, K.J. Reynolds, D. Powers, A multi-stage neural network classifier for ECG events, in: Proceedings of the 23rd International Conference on IEEE EMBS, vol. 2, 2001, pp. 1672-1675.
[3] O.T. Inan, L. Giovangrandi, G.T.A. Kovacs, Robust neural-networkbased classification of premature ventricular contractions using wavelet transform and timing interval features, IEEE Trans. Biomed. Eng. 53 (2006) 2507-2515.
[4] S.N. Yu, K.T. Chou, Selection of significant for ECG beat classification, Expert Syst. Appl. 36 (2009) 2088-2096.
[5] U.R. Acharya et al., Automatic identification of cardiac health using modeling techniques: a comparative study, Inform. Sci. 178 (2008) 4571-4582.
[6] C.H. Lin, Frequency-domain features for ECG beat discrimination using grey relational analysis-based classifier, Comput. Math. Appl. 55 (2008) 680-690. [7] E.D. Ubeyli.Features for analysis of electrocardiographic
changes in partial epileptic patients, Expert Syst. Appl. 36 (2009) 6780-6789.
[8] Mukhopadhyay S, Sircar P: Parametric modelling of ECG signal. Med Biol Eng Comp 1996, 34:171-173 [9] Pinna GD, Maestri R, Cesare AD: Application of time
series spectral analysis theory: analysis of cardiovascular variability signals. Med Biol Eng Comp 1996, 34:142-148.
[10] Bennett FM, Chrisstini DJ, Ahmed H, Lutchen K: Time series modeling of heart rate dynamics. Proc Comp Cardiol 1993, 273-276.
[11] Arnold M, Miltner WHR, Witte H: Adaptive AR modeling of nonstationary time series by means of Kalman filtering. IEEE Trans Biomed Eng 1998, 45:553-562.
[12] Mainardi LT, Bianchi AM, Baselli G, Cerutti S: Pole tracking algorithms for the extraction of time-variant heart rate variability spectral parameters. IEEE Trans Biomed Eng 1995, 42:250-258.
[13] Mehmet Engin: ECG beat classification using neuro fuzzy network. Pattern Recognition Letters 25 (2004) 1715-1722.
[14] Dingfei Ge, Narayanan Srinivasan and Shankar M Krishnan: Cardiac arrhythmia classification using autoregressive modeling. BioMedical Engineering OnLine 2002, 1:5.
[15] A.OUELLI, B.ELHADADI, H.AISSAOUI, B.BOUIKHALENE: AR Modeling for Automatic Cardiac Arrhythmia Diagnosis Using QDF Based Algorithm. IJARCSSE, Vol. 2, issue5, May 2012, 402-407.
[16] Massachusetts Institute of Technology, MIT-BIH arrhythmia database. [http://www. physionet.org /physiobank/database/mitdb].
[17] Massachusetts Institute of Technology, CU database. [http://www. physionet.org / physiobank /database/cudb]. [18] Massachusetts Institute of Technology, MIT-BIH
Supraventricular Arrhythmia database. [http://www.physionet.org / physiobank /database /svdb] [19] Ham F M, Han S. Classification of cardiac arrhythmias using fuzzy ARTMAP. IEEE Transactions on Biomedical Engineering, 1996, 43(4): 425-430.
[20] Dingfei Ge, HOU Bei-Ping and XIANG Xin-Jian: Study of Feature Extraction Based on Autoregressive Modeling in ECG automatic diagnosis. Acta Automatica Sinika, Vol. 33, N. 5, 462-466.May 2007.
[21] M.L.Talbi, A.Charaf. PVC discrimination using the QRS power spectrum and self–organizing maps. Computer methods and programs in biomedicine.2009, 223-231. [22] Fukunaga K. Introduction to Statistical Pattern
Recognition. New York: Academic Press, 1990, 153-154 and 400-409.
[23] Ge Ding-Fei, Xia Shun-Ren. Application of AR model in telediagnosis of cardiac arrhythmias. Chinese Journal of Biomedical Engineering, 2004, 23(3): 222-229.