207
ARRHYTHMIA DETECTION BASED ON COMBINATION OF
FREEMAN CHAIN CODE AND FIRST ORDER TEXTURE
FEATURES
1 ZAMEN F. JABR,2RANA H. HUSSAIN, 3 SHAYMAA R. SALEH
1College of Education for Girls, University of Thi-Qar, Iraq
2,3Department of Computer Science, College of Computer Science and Mathematics University of Thi-Qar,
E-mail: 1[email protected]
,
2[email protected], 3 [email protected]ABSTRACT
This paper presents a novel method of detection and classification an Arrhythmia based on ECG chart us-ing image processus-ing techniques and neural network as classifier tool .The method consist of three major stage firstly preprocessing to prepare the ECG chart image, secondly features extraction stage represent by freeman chain code and first order features which are arranged in vector consist of 14 input each one hold one feature value, finally stage this vector of features entered to BPNN classifier to classify an Arrhythmia type. The system applied on dataset consists of 90 ECG chart images. Two different ratios of train-ing/testing groups which are (30% to 70%,50% to 50%) are applied to the classifiers. The higher system's accuracy in first ratios was100% for training group and 90.5% for testing group while higher system's accu-racy in second ratio was 100% for training group and 97.8% for testing group with time 31.6 second. The system achieved using Matlab.
Keywords: ECG chart, Arrhythmia, Freeman chain code, First order features, Artificial neural network.
1. INTRODUCTION
Nowadays one of the most important rea-sons which cause death are heart diseases and heart failure. In 2006 Heart Disease took 631636 lives in US which are 26 percent of whole death in US in this year. The number one cause of death world-wide according to the World Health Organization, are heart disease or cardiovascular diseases (CVD).With rate 82% of these deaths, happen in low- and middle-income countries[1].
One of the most considered and clinically used dynamic signs is Electrocardiogram ECG. ECG can be defined as the electrical action of the heart note down by resources of electrodes on the body outward. By electrical phenomena in dissimi-lar parts of the heart we can originate the classic waves (P-Q-R-S-T complexes, as its clear in fig-ure(1) of a normal ECG are created which synchro-nized by the electrical action in the sinus node cells inside the right atrium[2].
An ECG wave as it is shown in fig-ure1symboled by capital letter P, Q, R, S, T waves. The Atrial Contraction represented by the P wave, the ventricular relaxation represented by the T
wave. The ventricular contraction contained in the QRS complex wave. The QRS complex, ST seg-ment, PR interval, RR interval, PR segseg-ment, QT interval is the most significant sections in an ECG signal used in the diagnosis of many cardiac diseas-es. [3].
A major kind of abnormal heart action is Cardiac arrhythmia. An arrhythmia can be defined as a problem with the heartbeat rate or rhythm of the heartbeat. For the period of an arrhythmia, the heart may beat too fast or too slow, or with an ir-regular rhythm. Tachycardia state is said to be Fast heartbeat while slow heartbeat is named Bradycar-dia. Most arrhythmias are not dangerous, but some can be and some can be even fatal [4].
208 The purpose of this paper is prepare auto-matic recognition and classification system to some type of heart daises based on ECG chart which is give curve detect the electrical action of the heart. The benefit of this system summarize in following items:
1) Simulate the ability of the physician in diagno-ses the state of heart.
2) Reducing the burden on the physician by reduc-ing the time spent in the diagnosis.
3)The ability to save digital information about the pathology detected in an electronic file that can be returned when needed at a later time.
2. RELATED WORK
There are many previous researches worked in the direction of ECG, Some of these re-search highlights how to transform the image of electrocardiogram into a digital format for the pur-pose of storing and archiving it using image pro-cessing methods and patterns recognition as in re-searches [5,6], while others work toward diagnosis of heart disease using digital signal processing techniques as in researches [7,8]. In[5], Prashanth et. al. proposed method for mining and digitization of ECG signal from two sources thermal ECG printouts, scanned ECG and captured ECG images. The Radon transform is used for de-skewing while morphological techniques are applied to extract the time series from ECG image. In [6] Deepak et. al. proposed method to generate time series digitized signal from ECG chart image using set of tech-niques that are deal with digital image processing. The method also involves compute of Heart rate, QRS Width and Stability (variation in R-R peaks) from the resulted signal .In [7] Mohammad et.al. develop a procedure to excerpt information from Electrocardiogram (ECG) data & conclude kinds of Arrhythmias. The decisions were done by determin-ing diverse intervals such as PR Interval, RR Inter-val, Heart Rate (HR) etc. and those intervals were matched with the model intervals. . In[8] N. N. S. V. Rama Raju Butterworth Filter is used to remove noise from the signal as preprocessing step. The number of parameters are extract using wavelet transform these parameter distinguish different ar-rhythmic daises. The Classification step is perform by Neural Network classifier.
In this paper we propose recognition method for detect and classify arrhythmias based on ECG chart which enter to our system as image. Number of image processing techniques and statis-tical measures are applied to extract the vital fea-tures to be enough to judge if the ECG are normal or have cardiac daises (Bradycardia, Tachycardia ).
The remainder of the paper is organized as follows: section 3, describes freeman chain code algorithm, Section 4 briefly definition to first order texture features computation; in section 5 steps of our proposed recognition and classification meth-od. Experimental results and discussions are pre-sented in Section 6; Section 7 concludes the paper. 3. CHAIN CODE
The techniques which is used to denote frequent number data of the stroke An 8-direction called Freeman Chain Code (FCC). The Freeman code brings connectivity and formal information about the objects in image [9].
The code of the boundary of character im-age can be founded using chain code representa-tion, this codes is demonstrating the direction of where is the location of the next pixel and match to the neighborhood in the image. For binary image there are two types of boundary depiction algorithm that are frequently applied: chain code based and run-length based algorithms. The run- length rithm usually used in image compression, this algo-rithm works by register the successive ‘runs’ of similar objects and background pixels. While chain code based algorithm of a character image begin through a binary image as input. The representation of binary image is done with only two possible gray values for each pixel, such as “0” and “1”[10].
Commonly, binary images present in two types of groups are the foreground is represented by 1 and the background is represented by 0. The de-scriptions of object boundaries in image processing field achieved using 8- direction FCC because of simplicity and data representation in compact form and its fitness for fast processing. Figure2 display 8-neighbourhood and the directions which pro-cessed by FCC which is used in this paper as fea-ture extraction tool from ECG curve [11].
209 For example, a code “0” is assigned if the pixel found is located at the right of the current location or pixel. a code “1” is assigned If the pixel found is directly to the upper right. Until we return to the first location or boundary pixel the process of assigning a code for location of the next boundary pixel is repeated. A list of chain codes is the result of this process in this list the direction that taken in moving from each boundary pixel to the next is showing. The process of assigning a code of the located boundary pixel that is found is shown in figure3 [12].
4. FIRST-ORDER HISTOGRAM BASED FEATURES
One of a means of extracting information from imagery is texture analysis which is consider mathematical procedures used to determine the spatial variation within image. Texture can be de-fined as an a real construct that describes local spa-tial organization of spaspa-tially varying spectral values that is repeated in a region of larger spatial scale. Thus, the perception of texture is a function of spa-tial and radiometric scales [13].
Some measures such as first-order texture measures can be calculated from the original image values. These measures do not take in consideration the relationships with neighborhood pixel. Texture analysis using histogram-based approach is
estab-lished on the intensity value concentrations on all or part of an image represented as a histogram. From this approach many features derived include moments such as mean, standard deviation, average energy, entropy
,
skewness and kurtosis [14]. The gray-level histogram calculates by a simple sum-mary of the statistical information of the image and individual pixels. Therefore, the histogram com-prises the first-order statistical information about the image (or sub image). These statisticsare
de-fined by the following equations [15].The most frequently used central moments are variance , Skewness and Kurtosis given by M2, M3 and M4 respectively. The variance defined as a measure of the histogram width that measures the deviation of gray levels from the mean. Skewness is a measure of the degree of histogram asymmetry around the Mean and Kurtosis is a measure of the histogram sharpness [16].
5. PROPOSED METHOD OF ARRHYTH-MIA DETECTION
The purpose of this paper is build a recog-nition and classification method of an Arrhythmia from ECG chart which entered to our system as digital image acquired by scanner. ECG chart throw in many steps start with preprocessing of ECG im-age which consist from branch steps in order to illumination enhancement and noise removing the output of this stage is binary image contain the curve of ECG and black background, secondly stage implies feature extraction using first order feature and freeman chain code feature which result 0 1 7 5 3 6 4 2
Figre2: 8-connected neighbors
Figure3 ( a,b) 4-connected objects ,( c,d) chain code to these objects with c to 4-connected boundary with d for
8-connected boundary
) 1 ( 1 1 ( , ) ) ( N M M x N
y Ii x y i mean ) 2 ( 1 1 2 ) ) , ( ( ) ( tan N M M x N
y Ii x y i
i deviation dard s ) 3 ( 1 ( , )
2 1 1 ) ( N
y Ii x y
M x MN i e Energy ) 4 ( )) , ( ln ( 1 ( , ) 1 1 y x i I N
y Ii x y
M
x MN i
Entropy
) 5 ( 2 1 1 3 ) ) , ( ( N M M x N
y Ii x y
Skewness ) 6 ( 3 4 1 1 4 ) ) , ( ( ) ( N M M x N
y Ii x y
210 in vector contain 14 feature ,third stage perform classification to this vector and determine if the ECG normal or tachycardia or bradcardia. Figure(4) shows our proposed method.
5.1 Preprocessing stage
First stage in our proposed method is the preprocessing which implies four sub- steps which is ECG image acquisition , convert ECG image to gray scale and blurring, image binarization and image closing. The aim of this stage is to prepare the image and remove the noise from it to be ready for the subsequent processing stage (the post pro-cessing).These sub-steps are explained in more de-tails in item a to d.
a. ECG image acquisition
The ECG image acquisition by using HP Scan Deskjet F2400 scanner with horizontal and
vertical resolution 300 dpi, bit depth 24, and the image store in JPEG format as shown in Figure(5) .
b.Convert ECG image to gray scale and blurring
In this step ECG image is converted from 3-dimension image to 2-dimension image (gray scale image) by computing the average of each pixels in three layer in original image and place this average value in same position in new image. as it declare in the following equation .
) 7 ( 3 / )) , ( ) , ( ) . (
(IR i j IG i j IB i j
Newpixle
Where: IR=value of pixel (I,j) in Red layer. IG=value of pixel (I,j) in Green layer. IB=value of pixel (I,j) in Blue layer.
After that, the gray image will be blurred using motion filter in order to decrease the effect of grid found in ECG chart image . By applying this filter with length 5 and degree 90 the ECG curve region will be more obvious and the grid will be foggy this will help us in next step (image binariza-tion).
c. Image binarization
Because we need to deal with interest re-gion of ECG chart which is represent by curve of ECG image we need to convert the blurred gray image to binary image. Global threshold method is applied to this image this process result in image with binary value 0 to curve pixels and binary value 1 in background pixels the complement process is performed on the resulted binary image to give the high value (binary value 1) to curve pixels because this curve consider the interest region in image.
d. Image Closing
The resulted binary image have curve with small broken (holes) in some region so we apply morphological closing on binary image to close this broken and get on ECG curve clear along image. The shape of structural element used in closing operation is line shape with length 7 this helps us in fills holes smaller than the structural element.
Figure4. diagram of ECG daises detection method
211 5.2 Post processing stage
This is the second stage in our method which consist of two stage (feature extraction stage, Normalization stage).These two-stage explained with more details below.
5.2.1 Feature extraction stage
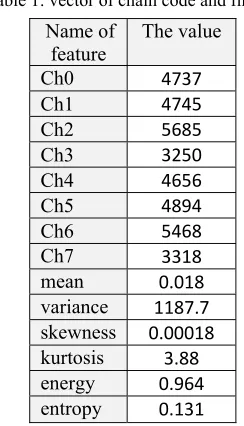
We extract from binary closing image vector of feature consist of 14 features first eight was ex-tracted from applying chain code algorithm on im-age which compute the movement change of ECG curve in eight neighbors (0,1,2,3,4,5,6,7). After that we calculate summation of movements in eight direction and save it in spreadable variables. The remaining six feature is extracted using first order measurement (mean , variance, skewness, kurtosis, energy, entropy) on binary closing image. This vector of features initiate to enter the recognition stage so to determine the state of heart action if it is normal or there is an Arrhythmia based on these features , if it is founded the classification system ANN must classify the type Arrhythmia either it is bradicardia or tachycardia. Table(1) bellow detect the features vector for one ECG chart image consist of combination of freeman chain code and first or-der features.
Name of
feature The value
Ch0 4737
Ch1 4745
Ch2 5685
Ch3 3250
Ch4 4656
Ch5 4894
Ch6 5468
Ch7 3318
mean 0.018
variance 1187.7
skewness 0.00018
kurtosis 3.88
energy 0.964
entropy 0.131
The numerical features which are extract-ed using chain code and first orderextract-ed measurement saved in text file this process help in digitization the ECG image in small size text file resulting in suita-ble storage and retrieval of ECG information for each patients in speed and easy way.
5.2.2Recognition Stage
Artificial neural networks (ANNs) will be used for recognition and classification of the ECG chart im-age. ANNs are a kind of artificial intelligence which tries to simulate the actions of nervous sys-tem in the human brain. It is consist of a number of computational units or neurons. In ANNs neurons are arrange in different layers. These layer are(input, hidden, output). Network weights that are used to connect each neuron to other neuron in the next layers are adjustable through a learning pro-cess. In order to obtain the output of ANNs the hid-den and output layers multiply each input by its network weights and then do summation on these multiplying which then passed through a transfer function to get the result[18].
ANN that are used in this paper is trained using Resilient back-propagation (Rprop) rithm. Resilient back-propagation (Rprop) algo-rithm is a learning algoalgo-rithm which is the finest algorithm in terms of combining correctness, speed as well as strength with respect to the training pa-rameters. The Rprop is a local adaptive learning algorithm, the simple notion is to minimize the harmful influence that present due to the size of the partial derivative on the weight step [19].
ANN architecture which is used in our method shaped as one hidden layer where we put 14 neurons in input layer one for each input fea-tures in database vector and 10 neurons in hidden layer and three neuron in output layer one for each case of ECG. The network is trained with target matrix has Rows equivalent to number of infor-mation vectors of ECG features vector and columns equivalent to class number equivalent to that input vector. Each rows in this matrix contains on zeros value with a 1 value in element with position i, where i is the class number that we need to treat it. The highest correct classification rate in this meth-od was 100% in training group and 97.8% in testing group. Figure (6) shows the construction of ANN which is used in classification stage.
[image:5.612.128.250.413.626.2]
6. EXPERIMENTAL RESULTS AND DIS-CUSSION
Table 1: vector of chain code and first
d f
[image:5.612.310.521.572.669.2]212 To verify this proposed method we create dataset consist of 90 ECG chart image using scan-ner device where the scanning operation of the ECG chart with resolution 300dpi vertically and horizontally these images store in JPEG format. We got on ECG Chart from Nasiriya heart center in Dhi-Qar Governorate. The collected dataset implies normal and arrhythmia groups of dissimilar age sets both male and female patients .The ninety image in our dataset include 39 image has normal action of ECG, 27 image with bradycardia daises and the remaining 24 image have tachycardia daises.
This dataset divided into two groups train-ing and testtrain-ing the first group include 30% of image for training,70 of image for testing. The second group include 50% of image for training and 50% of image for testing the selection of image is done randomly. The classification results obtained from our method are 100% for training in both two group while testing we get on 90.5% on first group and 97.8% in second group. Table (2) shows the classi-fication results in two group where the number marked in bold font detect the correct classification for ECG state. Our method is programmed using MATLAB R2017a with computer has processor Intel( R) Core(Tm)i7 CPU @ 2.10 GH with RAM capacity is 8GB.
The difference between our method with previous work is in[5] the purpose of system is generate se-ries signal in digit form using image processing techniques database used involves of ECG records of 10 persons, the resolution of scanner is 600 dpi black and white mode then the resulted image stored as JPEG image. The accuracy of this system is 95%.
In[6] also used image processing techniques to pre-pare digitization record of ECG chart dataset con-taining paper records of 20 patients. The accuracy rate was 96.4% in converting an ECG paper record to a digital signal. As Comparing with [5] and [6] our method generate new form of digitization to
ECG record where we save the fourteen features extracted form post processing stage saved in text file also our method apply on 90 ECG chart image. In[7] digital signal processing with if ..then ..else rule are used to arrhythmia detection higher accu-racy noticed from this system was 90%.
In [8] the goal of system was Identification of car-diac arrhythmias based on features extracted form signal where signal processing techniques was used to achieve this goal with principal component anal-ysis and neural network as classifier the accuracy of this system was 97.1% with PCA-NN. In Our method neural network with resilient back propaga-tion algorithm is used as classifier tool which gave us 97.8% accuracy in classification which is more than accuracy obtained in the two searches men-tioned in [7, 8].
Table(3) shows a comparison between our method which is proposed to detect the daises of heart based on image processing techniques with past researches in field of ECG that interest in digit-ization ECG or detection daises of heart using ECG.
Train to test
ratio 30/70 50/50
Class Name
Target class Target class
nor mal brad ycar dia tach ycar dia nor mal brad ycar dia tach ycar dia Ou tpu t cla ss
nor-mal 28 0 6 20 0 1
brady-cardia 0 16 0 0 14 0
tachy-cardia 0 0 13 0 0 10
Accuracy 90.5% 97.8%
Table2: testing ratios of the proposed method
Searchers System task Technique Accuracy
Prashanth et. al 2010 [5] Digital Time Series Signal Generation Image
processing 95%
Deepak et. al. 2012[6] Paper Rec-ords Digiti-zation Image
processing 96.4%
M. R. Islam et.al 2015 [7] Arrhythmia Detection Digital signal pro-cessing With if ..then ..else rule 90%
N. N. S. V. Rama Raju et.al. 2017[8] Identification of cardiac arrhythmias. Digital signal pro-cessing With PCA-NN 95.% with NN 97.1% with PCA-NN Our
method Digitization and Ar-rhythmia detection Image processing with BPNN 97.8%
213 7. CONCLUSION
A condition in which the heart beats with an irregular or abnormal rhythm is known as Ar-rhythmia .In medical field apply an automated sys-tems, need to be handled very carefully because this system deal with human life. From the study that has been carried out in this paper and based on the obtained results the ECG state action can be deter-mine using this method and decide if there is a need to treatment or not based on classification result of this method. High success result came from the robust features which are extracted carefully using freeman chain code in 8-neigbros in addition to statistical features represented by first order meas-urement. The selection of classifier also play major role in success this method since, the accuracy in a pattern recognition system not only be subject to features extraction method but also depend on the good selection of classifier. Two types of train-ing/testing groups which are (50% to 50%, 30% to 70) are used for the classifiers. Highest classifica-tion result was on 50 training-50 testing group where we get 97.8% as correct classification which consider promise result in pattern recognition sys-tem. Also From the result it observed that the train-ing data size has less affect on the result of neural network where even when the training data are few it gave best results.
This paper is established on a limited number of image which capture to ECG using flat-bed scanner, for that reason experimental results cannot be comprehensive. In the future research on more samples of ECG chart image is needed, using the same method proposed in this study and com-paring the new results with current results.
REFRENCES:
[1] A. M. Patel, P. K. Gakare, A. N. Cheeran, "Real Time ECG Feature Extraction and Ar-rhythmia Detection on a Mobile Platform", International Journal of Computer Applica-tions ,Volume 44– No.23, April 2012
[2] M. Sansone et.al. , "Electrocardiogram Pattern Recognition and Analysis Based on Artificial Neural Networks and Support Vector Ma-chines: A Review", Journal of Healthcare En-gineering ꞏ Vol. 4 ꞏ No. 4, 2013.
[3] M.Vijayavanan , V.Rathikarani, P. Dhana-lakshmi, "Automatic Classification of ECG Signal for Heart Disease Diagnosis using morphological features", International Journal of Computer Science & Engineering Tech-nology, Vol. 5 No. 04 Apr 2014.
[4] E. Gajendra, J. Kumar," A Novel Approach of ECG Classification for Diagnosis of Heart Diseases: Review", International Journal of Advanced Research in Computer Engineering & Technology Volume 4 Issue 11, November 2015.
[5] P. Swamy et. al.," An Improved Method for Digital Time Series Signal Generation from Scanned ECG Records", International Con-ference on Bioinformatics and Biomedical Technology, pp. 400-403, 2010.
[6] D. K. Garg et. al.," ECG Paper Records Digiti-zation through Image Processing Techniques, International Journal of Computer Applica-tions ",Volume 48– No.13, June 2012. [7] M. R. Islam et.al.," Arrhythmia Detection
Tech-nique using basic ECG Parameters, Interna-tional Journal of Computer Applications" ,Volume 119 – No.10, June 2015.
[8] N. N. S. V. Rama Raju, V.Malleswara Rao, B.N.Jagadesh, "Identification and Classifica-tion of Cardiac Arrhythmia using Neural Network", Helix Vol. 7(5), 2017.
[9] I.H. Ali, " New Method for Image Features Ex-tracting Based on Enhanced Chain Code", oriental journal of computer science & tech-nology ,Oriental journal of computer science &technology, Vol. 6, No. (4), December 2013.
[10] I. Wegener, ”Towards a Theory of the Ran-domized-Based Search Heuristics”, Lecture Notes in Computer Science, vol. 2747, 2003. [11] A. N. Azmi and D. Nasien, "Feature Vector of
Binary Image using Freeman Chain Code (FCC) Representation based on Structural Classifier", Int. J. Advance Soft Comput. Appl., Vol. 6, No. 2, July 2014.
[12] S. Madhvanath, G. Kim and V. Govindaraju, “chain code Contour Processing for Hand-written Word Recogntion “, IEEE Transac-tions on pattern Analysis and Machine intelli-gence , Vol. 21, No. 9, September 1999. [13] G. N. Srinivasan, and G. Shobha, " Statistical
Texture Analysis, proceedings of world acad-emy of science", engineering and technology, vol 36, December 2008.
[14] B. Jahne ," Digital Image Processing", Spring-er-Verlag Berlin, germany. 2005.
214 [16] N. Aggarwal, R. K. Agrawal, " First and
Sec-ond Order Statistics Features for Classifica-tion of Magnetic Resonance Brain Images" , Journal of Signal and Information Processing, vol 3, 2012.
[17] D. S. Jayas, J. Paliwal, N. S. Visen," Multi-layer Neural Networks for Image Analysis of Agricultural Products ", Silsoe Research Insti-tute, 2000.