A COMPREHENSIVE FRACTAL APPROACH IN DETERMINATION OF THE EFFECTIVE THERMAL CONDUCTIVITY OF GAS DIFFUSION LAYERS IN
POLYMER ELECTROLYTE MEMBRANE FUEL CELLS
MOHD FIKRI BIN AZIZAN
A project report submitted in partial fulfillment of the requirement for the award of the Degree of Master of Mechanical Engineering
Faculty of Mechanical and Manufacturing Engineering
Universiti Tun Hussein Onn Malaysia
Special dedication to my beloved mother and father
(Azizan bin Saad and Norsyakimah Lee binti Abdullah), and all family members for their love and encouragement
ACKNOWLEDGMENT
In the name of Allah S.W.T, The Most Gracious and Merciful.
Alhamdulillah, praise to Allah S.W.T. for giving me the strength to complete my Master Research project with successfully. First and foremost, I would like to give my deepest thanks to both my parents (Azizan bin Saad and Norsyakimah Lee binti Abdullah), and also to family members (Mohd Faizal bin Azizan, Intan Syafinaz binti Azizan, Muhammad Fauzi bin Azizan and Intan Diyana binti Azizan) for their continuing support and encouragement in completing this project.
I would like to express my deepest gratitude to my supervisor, Prof Madya Dr. Bukhari bin Mansoor and also to Dr. Hamidon bin Salleh, as the co-supervisors for constantly guiding and encouraging me throughout this study. I would like to convey my greatest appreciation to him for giving me the professional training, advice, motivation and suggestion to carry this project to its final form.
In particular, my sincere thanks are also extended to all my friends and others who have provided assistance at various occasions especially to all members Automotive Laboratory, and Principal, Fellows and Assistance Fellows of Tun Fatimah Resident Collage. With my heartfelt would like to say thanks to each and every one of them. Their views and tips are useful indeed. Regrettably, it is not possible to list all of them in this limited space.
ABSTRACT
ABSTRAK
TABLE OF CONTENTS
TITLE i
DECLARATION ii
DEDICATION iii
ACKNOWLEDGEMENT iv
ABSTRACT v
ABSTRAK vi
TABLE OF CONTENT vii
LIST OF FIGURES ix
LIST OF TABLES xiiii
LIST OF SYMBOLS AND ABBREVIATIONS xiv
LIST OF APPENDICES xvi
CHAPTER 1 INTRODUCTION 1
1.1 Research background 1
1.2 Problem statement 3
1.3 Significance 5
1.4 Objective 5
1.5 Scope of study 6
CHAPTER 2 LITERATURE REVIEW 7
2.1 Introduction 7
2.2 Application of fuel cell 8
2.3 Proton exchange membrane fuel cell 9
2.4 Gas diffusion layer in PEMFCs 11
2.5 Fractal model of effective thermal conductivity of gas diffusion layer in
polymer electrode membrane fuel cells 13
2.9 Measurement the through plane thermal conductivity of the PEM and GDL 22
2.10 Summary 25
CHAPTER 3 METHODOLOGY 26
3.1 Introduction 26
3.2 Experimental setup 28
3.3 Measurement and uncertainty analysis 30
3.4 Calculation of heat flux, Q and thermal conductivity, k of PEM and GDL 35
3.5 Scanning of electron microscope 35
3.6 Fractal approach to thermal conductivity 36
3.7 Summary 39
CHAPTER 4 RESULTS AND DISCUSSION 40
4.1 Thermal conductivity of the PEM and GDL 40
4.2 Temperature profile of PEM and GDL 41
4.3 Determination of the PEM and GDL fractal dimension 42 4.4 Effect of the temperature on the through-plane thermal conductivity of
PEM and GDL 46
4.5 Thermal conductivity by fractal approach 55
4.6 Summary 57
CHAPTER 5 CONCLUSION AND RECOMMENDATION 59
5.1 Introduction 59
5.2 Conclusion 59
5.3 Recommendation 60
LIST OF FIGURES
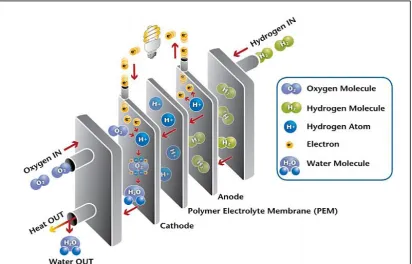
1.1 A functionally description of fuel cells 2
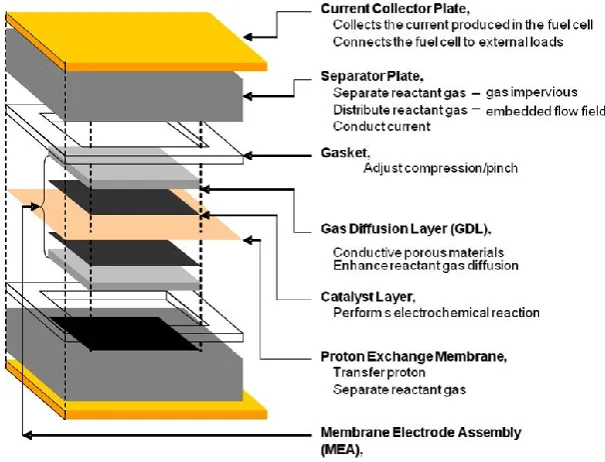
1.2 Schematic of Membrane Electrode Assembly (MEA) in PEMFCs
4
2.1 The illustration movements of hydrogen atom cross-over the membrane
10
2.2 Nafion ® Du Pont membrane fuel cell 10
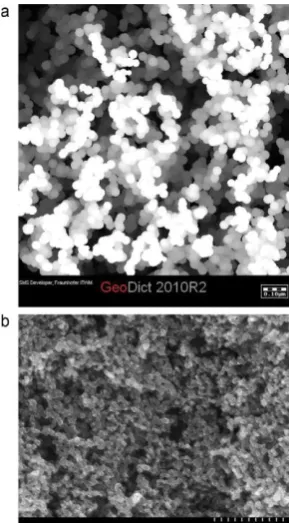
2.3 (a) The reconstructed microporous layer 13
2.3 (b) SEM image of a microporous layer 13
2.4 Microstructure and material parameter for the fractal model
14
2.5 The series-parallel model 15
2.6 A comparison of the effective thermal conductivity between the fractal parallel models, series model and the series-parallel layer models of thermal conductivity
19
2.7 (a) Scanning electron microscope picture of typical carbon fiber paper sheets use in fuel cell - Toray TGPH-060 CFP with no PTFE
20
2.7 (b) Scanning electron microscope picture of typical carbon fiber paper sheets use in fuel cell - close-up view of the TGPH-060 CFP with no PTFE
20
2.7 (c) Scanning electron microscope picture of typical carbon fiber paper sheets use in fuel
cell - Toray TGPH-060 CFP with 20% PTFE 2.7 (d) Scanning electron microscope picture of
typical carbon fiber paper sheets use in fuel cell - close-up view of the TGPH-060 CFP with 20% PTFE
20
2.8 Measured thermal conductivity of the GDLs at different compression loads
23
2.9 Measured thermal conductivity of the membrane as a function of the temperature for dry Nafion ® membrane (N112 and N117), error bar calculated at 15%
24
2.10 Measured thermal conductivity as a function of temperature for GDL- Toray carbon paper (TGP-H-060), error bar calculated at 15%
25
3.1 A methodology flow chart 27
3.2 Schematic diagram of the test setup to measure
29
3.3 (a) Schematic diagram thermocouple location 32
3.3 (b) Actual through-plane test rig for location along the aluminum bronze
32
3.4 A typical steady state temperature profile through the GDL
33
3.5 Schematics thermal resistance network of the upper and lower standard material and specimen of PEM
34
4.1 Steady state temperature profile at thermocouple location for Nafion N117 Catalyst Coated Membrane at variants ambient temperature
42
4.2 (a) SEM Image cross-sections TGP-H-060 44
4.2 (b) SEM Image cross-sections TGP-H-090 44
4.2 (d) SEM Image cross-sections Untreated N117 Membrane
44
4.2 (e) SEM Image cross-sections Coated N117 Membrane
44
4.2 (f) SEM Image cross-sections CT 44
4.2 (g) SEM Image cross-sections Sigracet 35 AA 44
4.2 (h) SEM Image cross-sections Sigracet 35 BA 44
4.3 (a) SEM Image surface TGP-H-060 45
4.3 (b) SEM Image surface TGP-H-090 45
4.3 (c) SEM Image surface ELAT LT1400W 45
4.3 (d) SEM image surface untreated N117 membrane
45
4.3 (e) SEM image surface coated N117 membrane 45
4.3 (f) SEM image surface CT 45
4.3 (g) SEM image surface Sigracet 35 AA 45
4.3 (h) SEM image surface Sigracet 35 BA 45
4.4 Measured thermal conductivity as function temperature for samples of PEM and GDL
48
4.5 Measured thermal resistance for the tested PEM Coated N117
50
4.6 Measured thermal resistance for the tested PEM Untreated N117
50
4.7 Measured thermal resistance for the tested GDL Toray Carbon Paper TGP-H-060
51
4.8 Measured thermal resistance for the tested GDL Toray Carbon Paper TGP-H-090
51
4.9 Measured thermal resistance for the tested GDL CT
52
4.10 Measured thermal resistance for the tested GDL ELAT
52
4.11 Measured thermal resistance for the tested GDL Sigracet 35 AA
4.12 Measured thermal resistance for the tested GDL Sigracet 35 BA
53
4.13 Hysteresis in thickness of the GDL under the external compression for TGP-H-060 (increase and decrease in pressure)
54
4.14 Hysteresis in thickness of the GDL under the external compression for TGP-H-090 (increase and decrease in pressure
55
4.15 Comparison of thermal conductivity using experimental and fractal approach between each sample of GDL on the Room Temperature
57
4.16 The effect of compression pressure with the thermal conductivity by using experimental and fractal approach between each sample of GDL
LIST OF TABLES
2.1 Properties of two type GDL material 8
2.2 Specifications of Nafion membrane within the membrane electrode assemblies for N117 catalyst coated membrane
11
2.3 Estimated thermal conductivities of GDL sample at 20°C
12
2.4 Various specific values of thermal conductivity
12
2.5 Microstructure and material parameter of the sample „a‟ and „b‟
18
3.1 The specification of the PEM and GDL 28
4.1 Characteristics of the GDL sample for pore fractal dimension, tortuous fractal dimension and thermal conductivity
56
4.2 Comparison of the experimental thermal conductivity at room temperature with measured using fractal approach
LIST OF SYMBOLS AND ABBREVIATIONS
ΔT - Temperature drop across thin film
- Ratio of the number of perpendicular channels to the total number of channels
λ - Size of the path
λmin, λmax - The minimum and maximum pore diameters
τ - Tortuous pathways
Ɛ, Ø - Porosity
A - Total area of a structural size
As - Area of heat transfer
C - Intercept of the line constant to the data in a log-log plot
Cph Phonon heat capacity
DAQ - Data Acquisition
Df - Fractal dimension
Dp - Specific pore fractal dimension
Dt - Tortuous fractal dimension
f() - The effects of anisotropy and structure in the in-plane and through plane directions
FC - Fuel Cell
GDL, DM - Gas Diffusion Layer and Diffusion Media
k - Thermal conductivity
kg - Thermal conductivity of the occupied gas
ks1 - Thermal conductivity of the carbon fiber
ks2 - Thermal conductivity of the PTFE
Keff - Effective thermal conductivity
Keff,p - Effective thermal conductivity of gas phase
kmem - Thermal conductivity of PEM and GDL
L(λ) - Corresponding path of length
Lo - Linear length of capillary pathway in the flow direction
Ls - Thickness of PEM and GDL
M(L) - Fractal structure
MEA - Membrane Electrode Assembly
MPL - Microporous layer
N - The cumulative pore size distribution
P - Pressure
PEM - Polymer Eletrolyte Membrane
PEMFCs - Polymer Eletrolyte Membrane Fuel Cells
PTFE - Polytetrafluoroethylene
Q - Heat flow rate
R - Pore size
r - Pore radius
R - Thermal resistance
RH-sample - Contact resistance between the sample and the holder
RL - Lower resistance
rmax - Maximum pore radius
Rsample - Thermal of sample
Rtotal - Total thermal resistance
RU - Upper resistance
SEM - Scanning Electron Microscope
T - Temperature
Tc - Temperature of the cold plate
Th - Temperature of the hot plate
Vp - Pore volume related with a certain pressure
vph - phonon velocity
LIST OF APPENDICES
APPENDIX TITLE PAGE
1 Steady state temperature profile for through-plane thermal conductivity experimental
65
2 Example calculation value of Q and k for through-plane thermal conductivity Experimental and fractal of TGP-H-060
69
3 Image of sample and image of SEM for PEM and GDL
73
4 Design and development through-plane thermal conductivity test rig
88
CHAPTER 1
INTRODUCTION
1.1 Research background
The main applications of PEMFCs not only focusing on transportation, but it does include of portable and stationary power generation. In automotive industries, the well-known company as Honda, Toyota, General Motor and Hyundai has been developed and demonstrated their product based on technology fuel cell (Fuel Cell Vehicle) not only to fuel energy consumption saving but because of the potential impact on the environment, such as emissions control greenhouse gases (Wang et al., 2011) (Wu et al., 2014) (You et al., 2017).
Figure 1.1: A functionally description of fuel cells (Energy Design Resources, 2013)
random cycle load are effect the humidity condition of Nafion membrane and also to GDL. (Wu et al., 2014)
The main challenge in the design of fuel cells is to transfer heat from the gas diffusion layer (GDL) in the polymer electrolyte membrane due to the result of a chemical reaction to produce electricity. Analysis of this process requires the determination of the effective thermal conductivity and thermal contact resistance is also associated with the interface between the GDL and the adjacent surface or coating. However, thermal conductivity of diffusion media or GDL is more difficult to estimate due it porosity structure. GDL porosity makes it necessary to use effective thermal conductivity to describe heat transfer in solid and liquid phases. Because of GDL is anisotropic and having high porosities, there are widely dispersed in literature thermal conductivity values.
In measuring thermal conductivity, there are several methods can be used. The prediction methods for effective thermal conductivity of porous media can be predicted by empirical formulas, numerical simulations, or theoretical models. The empirical formulas and numerical simulation have several issues where empirical method only based on simplifying assumption and empirical constants didn‟t indicate any specific physical meanings. For numerical simulation method, the difficult to analyst detail of GDL geometry model of porosity structure. (Nikooee et al., 2011) Fractal approach can be used to estimate the thermal conductivity of diffusion media. Fractal theory can analyze complex structure such as high porosities characteristic. Fractal theory widely used in diverse engineering application which is involve physical phenomena in disordered structures and over multiple scales.
1.2 Problem statement
associated in proton exchange membrane fuel cells generate large amounts of heat which produces a temperature gradient in the various components of the cell.
In literary studies, Nafion commonly used as the thermal conductivity of the membrane. GDL is one of the main components in MEA. The center part in MEA is Proton Exchange Membrane or Polymer Electrolyte Membrane (PEM). Figure 1.2 shows the schematic of MEA and their components. However, it is difficult to estimate the thermal conductivity of thermal diffusion media or gas diffusion layer because of GDL is anisotropic and having high porosities. However GDL porosity makes it necessary to use an effective thermal conductivity to describe heat transfer in solid and liquid phases. As mentioned before, in having high porosity materials and also anisotropic of GDL, which is probably be the reason why the thermal conductivity are widely scattered in the literature (Zakil et al., 2016).
[image:19.595.154.457.348.579.2]Among the methods used including of empirical formulas, numerical simulations, or theoretical models to in determine the thermal conductivity, it‟s experiencing one of the following three things: analytical methods are usually based on very simplifying assumptions. Numerical solution with realistic assumptions that can capture details GDL as heterogeneous porous media usually takes time using simulations. The Empirical relationships including significant physical constants. In
that case, fractal methods have been recommended by Nikoee et al., (2011) as the successful method to estimate the thermal conductivity of diffusion media.
Fractal geometry has been widely used in recent years to characterize the complex, heterogeneous porous media. The main idea behind fractal geometry is the scale parameter extraction invariant, which can describe the structure of complex geometry. Physics phenomena that occur in such media can be associated with this parameter. The main role of fractal geometry, in this case, is to simplify the structure of porous media complex diffusion into the fractal dimension and the physical basis for the derivation of the targeted phenomena.
There are different fractal dimensions that describe the characteristics of the pores in the porous medium. Among the various fractal dimension, fractal dimension and tortuous pore fractal dimension (called pores or areas based on the number of fractal dimension calculation method) is the most important. Parameters that can be measured by simple experiment can be used to develop the thermal conductivity equation. To overcome these weaknesses, fractal geometry will be proposed as an approach that will help to estimate the effective thermal conductivity of the polymer electrolyte membrane.
1.3 Significance
This study aim to contributed regarding the temperature and heat transfer mechanism to determine the thermal conductivity of the components of the membrane electrode assembly and gas diffusion layer in order to approach of fractal method.
1.4 Objectives
This study embarks on the following objectives:
equation) in determination of the effective thermal conductivity of GDL in polymer electrolyte membrane fuel cells.
ii. To validate by varying temperature, pressure and thermal conductivity of GDL by using experimental method (through-plane method).
1.5 Scopes of study
The scopes of this study are listed as below:
i. An experimental study to determine the thermal conductivity (experimental) of the PEM samples; coated Nafion® 117 and untreated Nafion 117, the GDL samples; CT, ELAT® LT1400W, Sigracet 35 AA (0 % PTFE) and Sigracet® 35 BA (50 % PTFE) and additional of thermal contact resistance experiment between PEM and GDL samples with a metal plate as a function of temperature and pressure.
ii. Comparisons have been made between the fractal methods and the existing experimental results measured by one dimensional through-plane thermal conductivity.
iii. Using equation of effective thermal conductivity in series and parallel model to obtain pore fractal dimension from GDL pore size distribution. iv. Scanning Electron Microscope (SEM) images of diffusion media also had
been used, and conventional methods of fractal image processing such as box counting can be used to determine the pore fractal dimension.
v. The effect of the temperature on the through-plane thermal conductivity of all the components in the PEM and GDL was investigated in the temperature range 27 ºC - 90 ºC.
vi. The measurements temperature along the standard material and specimens were performed under camber in order to eliminate the heat transfer by convection.
CHAPTER 2
LITERATURE REVIEW
2.1 Introduction
In Polymer Electrolyte Membrane Fuel Cell (PEMFC) the membrane and catalyst layer (consisting of the MEA), both of which require further research is essential to identify and develop cost-effective material alternatives. Correlation properties of the membrane for the performance of polymer electrolyte materials generally are more in need. The process of heat transfer in porous GDL has been investigated and appropriate predictive model of effective thermal conductivity by using fractal theoretical characterization of the actual microstructure of GDL (Wang et al., 2011).
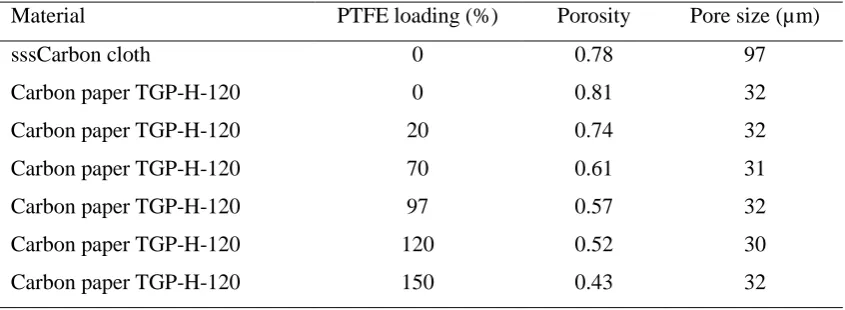
Radiation heat transfer occurs through the release or absorption of heat radiation pore walls. From studies on the type of coal, it has been found that radiation mechanism has a significant effect on heat transfer through large pore size (> 10 μm) at high temperatures (>1000 K), while foremost carbon material, the effect of radiation heat transfer is negligible for temperatures below 1000 K (Shi et al., 2008). Table 2.1 show summarizes properties of two type GDL materials. According to table, its show that the pore size of GDL is less than 100 µm (Wang et al., 2016).
Table 2.1: Properties of two type GDL material (Wang et al., 2016)
Material PTFE loading (%) Porosity Pore size (µm)
sssCarbon cloth 0 0.78 97
Carbon paper TGP-H-120 0 0.81 32
Carbon paper TGP-H-120 20 0.74 32
Carbon paper TGP-H-120 70 0.61 31
Carbon paper TGP-H-120 97 0.57 32
Carbon paper TGP-H-120 120 0.52 30
Carbon paper TGP-H-120 150 0.43 32
2.2 Application of fuel cell
Technologies of fuel cells have got an attention in the transportation industry including public transport and private vehicles. This is because the potential energy produced by the fuel cell is capable of producing high efficiency, economical used and the ability to reduce the environmental pollution caused by carbon monoxide gas (Wang et al., 2011).
Development of fuel cell technology not only focusing on transportation, but there are many of manufacturer working on other application for example, vending machine, vacuum cleaners machines and traffic light. The growing of fuel cell technologies also involved of power generation for hospital, police station and the bank because of the advantages its-self (Segura et al., 2009).
2.3 Proton exchange membrane fuel cell
There are many types of fuel cell as explained in Chapter 1. As PEMFC were selected, by using proton (hydrogen ion) conducting membrane will remain squeezed between two porous platinum-catalyzed electrodes. At first, this membrane is based on polystyrene, but currently Teflon-based products namely "Nafion" is used. It offers high stability, high oxygen solubility, good thermal and high mechanical stability. Nafion membrane is widely used for PEMFCs and have variety thickness and specific application. These membrane are proton-conductive polymer film, also as known as electrolyte or ionomer. The membrane functions are to allow only protons to through-pass to cathode (Oxygen) from anode (Hydrogen) as shown in Figure 2.1. Others are to spate the anode and cathode compartment of PEMFCs. PEMFCs are low temperature fuel cell and operating temperature is relatively low (between 60 – 100 °C). Hydrogen fuel cells require oxygen for humidified and operations. Pressure, in general, remains the same on both sides of the membrane. Operating at high pressure is necessary to achieve high power density, especially when the air is selected as the anodic reactants. The PEMFC meets the demands of rapid startup, acceleration, high power density and reliability. PEMFC will be best for light-duty vehicle applications (T-raissi et al., 1992) (Mekhilef et al., 2012).
membrane is reduced. The PEM must have durability in an acidic environment at high temperatures for thousands of hours. It should also have a reasonable low permeability to fuel. Nafion‟s developed by Du Pont as showed in Figure 2.2 is the most PEM used widely known and used because it can resistant of temperature below 100 ºC. Nafion‟s also become benchmark for comparison with other material to develop new material for low cost to produce fuel cells. In the Table 2.2, the Nafion N117 measurements are taken with membrane conditioned to 23 ºC, 50 % relative humidity (Khandelwal et al., 2006) (Vishnyakov, 2006).
[image:25.595.234.398.567.714.2]Figure 2.2: Nafion ® Du Pont membrane fuel cell (Stripe et al., 2011)
Figure 2.1: The illustration movements of Hydrogen atom cross-over the membrane (Scramlin et al., 2015)
H
+H
+H
+H
+H
+
H
+Table 2.2: Specifications of Nafion membrane within the membrane electrode assemblies for N117 catalyst coated membrane
Specifications
Dimension 300 mm x 300 mm
Thickness 0.183 mm
Basis weight 360 g/m2
2.4 Gas diffusion layer in PEMFCs
Gas Diffusion layer as kwon as Diffusion Media (DM), have a play roles as: (1) electronic connection between the electrode and bipolar plate with channel, (2) transit for reactant transport and heat/water removal, (3) mechanical support to the membrane electrode assembly (MEA), and (4) protection of the catalyst layer from corrosion or erosion caused by flows or other factors. (Wang et al., 2011). GDL structural are very important for transport inside of GDLs for fuel cell conversion. There are Carbon-based GDL such as carbon paper and carbon cloth where are commonly used in PEMFC due to its porosity, electronic conductivity, and flexibility. The better performance for GDL material is carbon cloth than carbon paper as mention by Ralph et al at high current more than 0.5A cm-2 with internal humidification (Stacks, 1997) (Park et al., 2012).
use effective thermal conductivities for describing heat transfer in the solid and fluid phases (Yu et al., 2002). In Table 2.4, it‟s estimated from the thermal conductivities of each phase and their volumetric fraction in the medium.
Table 2.3: Estimated thermal conductivities of GDL sample at 20 °C. (Ramousse et al., 2008)
Sample (A = 16 cm2)
Rmeasured
(KW-1)
𝑅𝑚𝑀𝑎𝑥
(Km2 W-1)
𝑘𝑒𝑓𝑓𝑀𝑖𝑛
(Km-1 W-1)
𝑅𝑚𝑀𝑖𝑛
(Km2 W-1)
𝑘𝑒𝑓𝑓𝑀𝑎𝑥
(Km-1 W-1)
Quintech (190 µm) 0.327 5.23E-04 0.36 1.39E-04 1.36
Quintech (190 µm) 0.537 8.59E-04 0.33 4.75E-04 0.59
Quintech (190 µm) 0.727 1.16E-03 0.20 7.79E-04 0.30
SGL Carbon (420 µm) 1.008 1.61E-03 0.26 1.23E-03 0.34
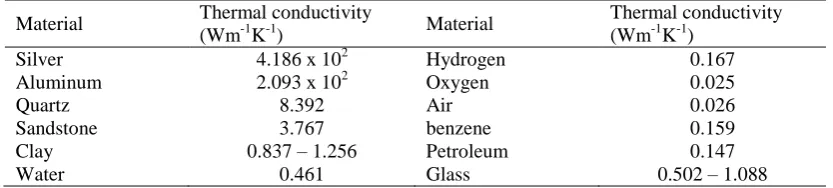
Table 2.4 Various specific values of thermal conductivity (Shi et al., 2008)
Material Thermal conductivity
(Wm-1K-1) Material
Thermal conductivity (Wm-1K-1)
Silver 4.186 x 10² Hydrogen 0.167
Aluminum 2.093 x 10² Oxygen 0.025
Quartz 8.392 Air 0.026
Sandstone 3.767 benzene 0.159
Clay 0.837 – 1.256 Petroleum 0.147
Water 0.461 Glass 0.502 – 1.088
[image:27.595.111.528.355.449.2]2.5 Fractal model of effective thermal conductivity of gas diffusion layer in polymer electrode membrane fuel cells
[image:28.595.238.383.96.358.2]The model accounts for the actual microstructures of the GDL in terms of two fractal dimensions, one relating the size of the capillary flow pathways to their population and the other describing the tortuosity of the capillary pathways have been discussed in previous study. The fractal permeability model is found to be a function of the tortuosity fractal dimension, pore area fractal dimension, sizes of pore and the effective porosity of porous medium without any empirical constants. A large number of reports show that the microstructure and pore size distribution of porous media have fractal characteristics. Therefore, it is possible to get through porous media permeability pore structure fractal analysis (Shi et al., 2006).
2.5.1 Fractal parallel model
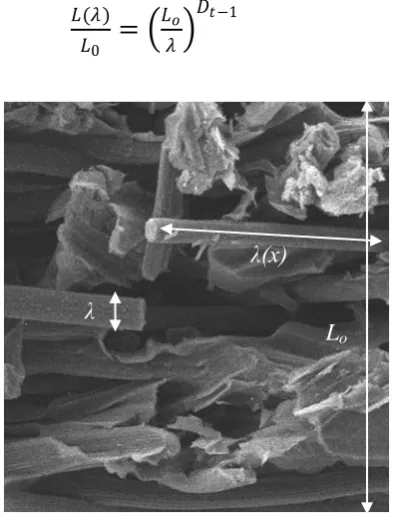
In a porous medium having fractal characteristics, surface area, pore volume and the length of capillary pathways follow a power law (Nikooee et al., 2011) (Shi et al., 2012). Figure 2.4 shows the microstructure and material parameters for the fractal model. The length L(λ) of the capillary pathway equation (1) can be considered as below:
𝐿(𝜆)
𝐿0
=
𝐿𝑜 𝜆
𝐷𝑡−1
(1)
Where, Lo represents the linear length of these capillary pathways in the flow direction, λ denotes the diameter of the path, L(λ) is its corresponding length and Dt is the tortuous fractal dimension (Shi et al., 2008). From the equation (2), the tortuous pathways can be obtained by:
𝜏 =
𝐿(𝜆)𝐿 02
=
𝐿𝑜 𝜆2𝐷𝑡−2
(2)
For porous media have fractal characteristics, the cumulative pore size distribution N can be attributed with the maximum pore size as equation (3) follows:
λ
[image:29.595.222.419.268.527.2]Lo λ(x)
𝑁 𝑅 ≥ 𝑟 =
𝑟𝑚𝑎𝑥 𝑟𝐷𝑝
(3)
Where, R denotes an arbitrary pore size for which pores with the larger than radii, r have been counted, rmax is the maximum pore radius and Dp specifies pore fractal dimension. Based on the method of fractal analysis the pore fractal dimension can vary, for instance, if the image of the GDL cross section is used, the pore fractal dimension would vary between 1 and 2 and if the pore size distribution (example as obtained by porosimetry methods) is employed the dimension would be between 2 and 3 (Nikooee et al., 2011) (Zheng et al., 2012).
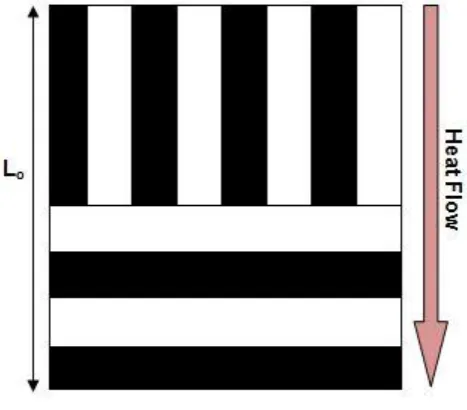
The series–parallel model (Figure 2.5), Nikooee et al.,(2011) claimed that Shi et al., (2012), was proposed a fractal model for estimation of thermal conductivity (Nikooee et al., 2011) (Shi et al., 2012). The effective thermal conductivity of the medium can be obtained as equation (4) :
𝑘
𝑒𝑓𝑓=
1−𝜉 1𝑘𝑒𝑓𝑓 ,𝑝+ 𝜉 𝑘𝑒𝑓𝑓 ,𝑠
(4)
[image:30.595.200.434.312.517.2]Where, keff is effective thermal conductivity, keef,p represents effective thermal conductivity of the gas phase in parallel and keef,s is the effective thermal conductivity if the gas and solid phases in perpendicular pore channel . ξ is the ratio of the number
of perpendicular channels to the total number of channels, with values range from 0 to 1.
The effective thermal conductivity through of parallel and perpendicular to the heat direction can be described by using equation (5) and (6) :
𝑘
𝑒𝑓𝑓 ,𝑠=
𝜀 1𝑘𝑔+ 0.22
𝑘𝑠1+ 0.78−𝜀
𝑘𝑠2
(5)
𝑘𝑒𝑓𝑓 ,𝑝 = 𝑘𝑔 2−𝐷𝑝 𝜀𝜆𝑚𝑎𝑥
𝐷𝑡−1 1− 𝜆𝑚𝑖𝑛 𝜆𝑚𝑎𝑥
𝐷𝑡−𝐷𝑝 +1
𝐿0𝐷𝑡−1 𝐷𝑡−𝐷𝑝+1 1− 𝜆𝑚𝑎𝑥𝜆𝑚𝑖𝑛
2−𝐷𝑝 + 0.22𝑘𝑠1 + 0.78 − 𝜀 𝑘𝑠2 (6)
Where kg, ks1 and ks2 are the thermal conductivities of the occupied gas carbon fiber and PTFE, respectively. ε donate the specifies porosity and λmin and λmax denote the minimum and maximum pore diameters respectively.
The modified equations for parallel and series claimed by Shi et al.,(2008) are suitable for the prediction of the effective thermal conductivity of a GDL. The proposed of combination with the contribution of parallel and series tubes by a series scheme based on the equation (4) will reach the effective thermal conductivity (Shi et al., 2008). Such series scheme is suitable to determine through plane conductivity. The equation (7) is suitable to determine of in-plane thermal conductivity contribution with combination of parallel scheme.
𝑘𝑒𝑓𝑓 = 1 − 𝜉𝑖𝑛 𝑘𝑒𝑓𝑓 ,𝑝 + 𝜉𝑖𝑛𝑘𝑒𝑓𝑓 ,𝑠 (7)
Where, ξin is the ratio of the number of channels perpendicular to the in-plane flow direction to the total number of channels. The ξin, is related in the through plane heat conduction, ξ. As on the geometrical parallel–perpendicular tubes scheme presented previously (Figure 2.4), the equation (8) is the ratio of the number of channels:
By using simplifying assumption on equation (8) to obtained suitable configuration of channels in through-plane condition. Based on Nikooee et al., (2011) this simplifying assumption and for practical applications is suitable used for two parameters can be related using a more general function, f(ξ)as equation (9) below:
𝜉𝑖𝑛 = 𝑓 (9)
Where f(ξ) represents to the effects of anisotropy and structural differences in the in-plane and through plane directions. To get the length of Lo can be calculated in the mathematical equation (11) as proposed by Nikooee et al., (2011). The A can be expressed as the total area of a structural size and determine using equation (10). The pore area fractal dimension Dp can be calculated if the parameter such as ε, λmin and
λmax are determined by the equation (12) (Zheng et al., 2012). The distribution size can be measured as the solid part as well as of all pores of different size between λmin and λmax. It is can be describes using fractal geometry as equation (12) below:
𝐿𝑜 = 𝐴 (10)
𝐴 =𝜋𝐷𝑝𝑑2𝑚𝑎𝑥
4𝜀 2−𝐷𝑝 1 − 𝜆𝑚𝑖𝑛 𝜆𝑚𝑎𝑥
2−𝐷𝑝
(11)
And the general equation of Lo can be estimated as below:
𝐿𝑜 = 𝜋𝐷𝑝𝑑2𝑚𝑎𝑥
4𝜀 2−𝐷𝑝 1 − 𝜆𝑚𝑖𝑛 𝜆𝑚𝑎𝑥
2−𝐷𝑝
(12)
2.5.2 Fractal prediction of effective thermal conductivities
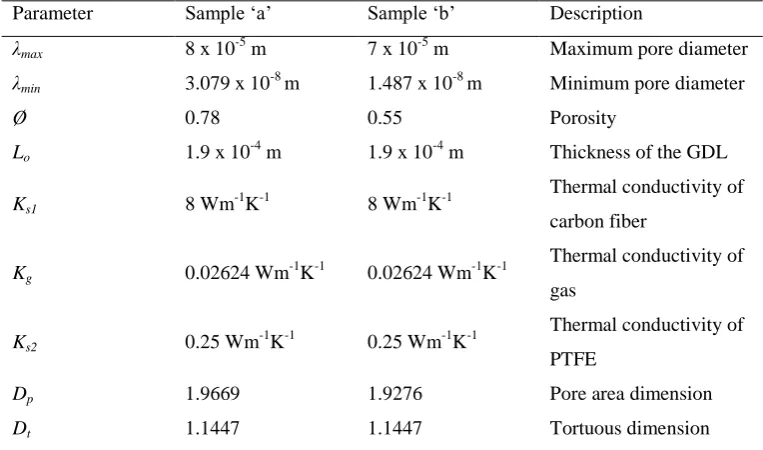
[image:33.595.148.530.459.684.2]Shi et al., (2008) using the effective thermal conductivities keff by modification of fhe fractal parallel model equation used air through the samples GDL: TGP-H-060 carbon paper „a‟ and TGP-H-060 carbon paper treated with PTFE „b‟(Shi et al., 2008). A comparison is made between different theoretical models. In this study, the parameters of GDL used are listed in Table 2.5; the values of fractal dimension are derived from scanning electron microscopic micrographs of the two samples. Comparison between the results of both samples showed that the sample keff 'b' is greater than the sample 'a‟ according to Table 2.5. The increase is due to the filling of keff PTFE, which has high thermal conductivity, in the pore space of carbon paper. Figure 2.6 shows the comparison of the effective thermal conductivity between the fractal parallel models, series model and the series-parallel layer models of thermal conductivity. It was showed that for each model giving different results.
Table 2.5: Microstructure and material parameters of the sample „a‟ and „b‟ (Shi et al., 2008)
Parameter Sample „a‟ Sample „b‟ Description
λmax 8 x 10⁻⁵ m 7 x 10⁻⁵ m Maximum pore diameter
λmin 3.079 x 10⁻⁸ m 1.487 x 10⁻⁸ m Minimum pore diameter
Ø 0.78 0.55 Porosity
Lo 1.9 x 10⁻⁴ m 1.9 x 10⁻⁴ m Thickness of the GDL
Ks1 8 Wm-1K-1 8 Wm-1K-1
Thermal conductivity of
carbon fiber
Kg 0.02624 Wm-1K-1 0.02624 Wm-1K-1
Thermal conductivity of
gas
Ks2 0.25 Wm-1K-1 0.25 Wm-1K-1
Thermal conductivity of
PTFE
Dp 1.9669 1.9276 Pore area dimension
2.6 Determination of the required fractal dimension
To define the pore fractal dimension, it can be calculated by various techniques which are obtained from GDL pore size distribution by using equation (3). Mercury porosimetry are recommended by Nikooee et al., (2011) to obtain the pore size distribution. The other techniques is using Scanning Electron Microscope (SEM) images of diffusion media and fractal image processing conventional methods which is counting the box can be utilized in the determine of pore fractal dimension (Rama et al., 2008). The last technique is measured the GDL capillary pressure is curve by using this equation (13):
𝐼𝑛 𝑑𝑉𝑝
[image:34.595.178.459.100.329.2]𝑑𝑃 = 𝐷𝑝 − 4 𝐼𝑛𝑃 + 𝐶 (13)
Figure 2.6: A comparison of the effective thermal conductivity between the fractal parallel models, series model and the series-parallel layer
Where Vp can be defined as pore volume related with a certain pressure, P and C is intercept of the line constant to the data in a log-log plot.
[image:35.595.174.473.260.515.2]The fractal dimensions of pore size distribution of the GDL material have been introduced by using a porosimetry technique. In this method, it can be determine the hydrophilic and hydrophobic pore size distribution (Nikooee et al., 2011). The equation (3) and SEM method are been used for this fractal analysis. Figure 2.7 shows the SEM image of a carbon fiber without any coating.
2.7 Determination of tortuous fractal dimension
In the previous study by Nikooee et al., (2011) introduced a new method in the determination of tortuous fractal dimension in the absence of SEM images. In this method, the ideas generated by the most representative medium based on the available data on the pore size distribution and porosity of GDL layer. In advance for
(a) (c)
(b) (d)
Figure 2.7: Scanning electron microscope picture of typical carbon fiber paper sheets use in fuel cell (a) Toray TGPH-060 CFP with no PTFE;
(b) close-up view of the TGPH-060 CFP with no PTFE; (c) Toray TGPH-060 CFP with 20% PTFE ; (d) close-up view of the TGPH-060
construction, the selection of the type of artificial medium must be selected. The multi-fractal has been used as the representative of the real porous media. A proper depiction of the real GDL layer will come out from the random multi-fractal model which can be considered as generalization of simple mono-fractal models. The similar to the real porous medium in basic characteristics of the generated medium such as pore size distribution and porosity can produce the most representative multi-fractal medium. Though, the common algorithms for the generation of multi-multi-fractal media do not usually match the required pore size distribution and/or porosity, they have recently been used to shed light into physical characteristics of porous media such as hydraulic permeability and water retention characteristics (Shi et al., 2012).
Nikooee et al., (2011) used the counting box technique for determination of tortuous fractal dimension. In the description, it will use the different size of boxes to cover the tortuous curves. The non-empty boxes needed to accommodate curves which are then calculated. Finally, the numbers of numbers of boxes versus to the size of the box are drawn on a log-log and the slope of the line that best fitted to give the tortuous fractal dimension (Yu et al., 2004) (Nikooee, et al., 2011).
2.8 The modified algorithm for the generation of random multi-fractal media
At the beginning, the platform on which the pores and solid parts distributed, divided into cells of different sizes based on known samples GDL pore size. In descending order, the pore sizes produced. For example, in the first step, the largest pores in the solid parts of the pores with smaller sizes produced. A similar procedure by Nikooee et al., (2011) is followed to make the pores of each size (Zamel et al., 2012) (Nikooee et al., 2011).
In the next step, the solid parts are divided into cells with specific size smaller pore size equal to certain smaller are present in the GDL medium. This algorithm is repeated to generate pore size of the GDL and to match the pore size distribution as much as possible. Due to the number of pores and solid parts together with the porosity that can be used to determine the field of initiator, the final generated medium will have a porosity and pore size distribution in real samples.
Nikooee et al., (2011) mention that to get the distribution of tortuous fractal dimension, the algorithm was coded and run 100 times for each of three used of samples which is pure GDL, 12.8% PTFE coated GDL and 32.2% PTFE coated GDL (Nikooee et al., 2011).
2.9 Measurement the through plane thermal conductivity of the PEM and GDL
2.9.1 Effect of compression pressure on the through-plane thermal
conductivity of the gas diffusion layer
[image:38.595.148.480.383.625.2]When applying the compression pressure, it will have the reduction in the thickness on the GDL and PTFE. Then, the variation in thickness is almost negligible after increasing the pressure which indicates that the deformation of the GDL has „saturated‟. Alhazmi et al., (2014) claimed that there is a hysteresis effect in the compression curves which signals that there has been a permanent deformation in the compressed GDL sample. In Figure 2.8, shows the investigated effect of the applied load on the thermal resistance. It is clear that the thermal resistance values of the treated GDLs are higher than that of the untreated GDL. This is due to the increase in the contact resistance between the fibers of the GDL after adding the PTFE (Khandelwal et al., 2006) (Alhazmi et al., 2014).
2.9.2 Effect of the temperature on the through-plane thermal conductivity in the PEM
Figure 2.9 shows that the thermal conductivity of Nafion® decreases with increasing temperature, where the test temperature is defined as the average temperature across the test specimen. Although the downward trend in thermal conductivity is nearly within the error bar limit, this behavior of Nafion® may be explained on the basis of its structure and morphology (Chun et al., 1998) (Zhang et al., 2006).
2.9.3 Effect of the temperature on the through-plane thermal conductivity of the GDL
[image:39.595.161.461.289.496.2]The through-plane thermal conductivity of the GDL was found to be significantly lower than its in-plane thermal conductivity. The through-plane thermal conductivity of the GDL increasing with the temperature (Nikooee et al., 2011). Figure 2.10 shows the variation of the thermal conductivity for Toray carbon paper (TGP-H-060) as a function with increasing of temperature
Figure 2.9. Measured thermal conductivity of the membrane as a function of the temperature for dry Nafion ® membrane (N112 and
REFERENCES
Alhazmi, N., Ingham, D.B., Ismail, M.S., Hughes, K., Ma, L. and Pourkashanian, M. (2014). “The through-Plane Thermal Conductivity and the Contact Resistance of the Components of the Membrane Electrode Assembly and Gas Diffusion Layer in Proton Exchange Membrane Fuel Cells” 270: 59–67.
Burheim, O., Vie, P. J. S., Pharoah, J. G. and Kjelstrup, S. (2010). Ex Situ Measurements of through-Plane Thermal Conductivities in a Polymer Electrolyte Fuel Cell. Journal of Power Sources 195 (1): 249–56. doi:10.1016/j.jpowsour.2009.06.077.
Chengel, Y. A. (2011). Heat and Mass Transfer Fundamental and Application. Fourth Edi. New York: McGraw-Hill.
Chun, Y. G., Chang, S. K., Dong, H. P. and Dong, R. S. (1998). Performance of a Polymer Electrolyte Membrane Fuel Cell with Thin Film Catalyst Electrodes. Journal of Power Sources 71 (1–2): 174–78. doi:10.1016/S0378-7753(97)02792-4.
David, P. W., Juijun , Z., Rob H., Jeffrey F. and Xianguo L. (2010). Proton Exchange Membrane Fuel Cell. CRC Press,Taylor & Francis Group.
Ellis, M.W., Von, Spakovsky, M. R. and Nelson, D.J. (2001). “Fuel Cell Systems: Efficient, Flexible Energy Conversion for the 21st Century.” Proceedings of the IEEE 89 (12): 1808–18. doi:10.1109/5.975914.
Energy Design Resources. (2013). https://energydesignresources.com/resources/e-news/e-news-90-fuel-cells.aspx.
Iranzo, A. (2017). Fuel Cell Hardware. Woburn: ElectroChem Inc. http://fuelcell.com/fuel-cell-hardware/.
Joseph, D., Julian, B., Corinna, H., Dirk H., Mikkel J., Alexander, D., Jong, H., and Hyoung, J. K. (2016). Porous Nafion Membranes 520: 723–30.
Kantorovich, Isaac I., and Ezra B. (1999). Heat Transfer within Highly Porous Chars : A Review 78: 279–99.
Khandelwal, Manish, and Mench, M. M. (2006). Direct Measurement of through-Plane Thermal Conductivity and Contact Resistance in Fuel Cell Materials. Journal of Power Sources 161 (2): 1106–15. doi:10.1016/j.jpowsour.2006.06.092.
Marotta, E. E., and Fletchert, L.S. (1996). Thermal Contact Conductance of Selected Polymeric Materials 10 (2).
Mekhilef, S., Saidur, R., and Safari, A. (2012). Comparative Study of Different Fuel Cell Technologies. Renewable and Sustainable Energy Reviews 16 (1). Elsevier Ltd: 981–89. doi:10.1016/j.rser.2011.09.020.
Nikooee, E., Karimi,G., and Li. X. (2011). Determination of the Effective Thermal Conductivity of Gas Diffusion Layers in Polymer Electrolyte Membrane Fuel Cells : A Comprehensive Fractal Approach, no. July: 1351–59. doi:10.1002/er. Park, Sehkyu, Lee, J. and Branko N. P. (2012). A Review of Gas Diffusion Layer in
PEM Fuel Cells : Materials and Designs. International Journal of Hydrogen Energy 37 (7). Elsevier Ltd: 5850–65. doi:10.1016/j.ijhydene.2011.12.148. Radhakrishnan, A., Lu, Z. and Kandikar, S. G. (2010). Effective Thermal
Conductivity of Gas Diffusion Layers Used in PEMFC: Measured with Guarded-Hot-Plate Method and Predicted by a Fractal Model. The Electrochemical Society 33 (1): 1163–76.
Rama, P., Chen, R. and Andrews, J. (2008). A Review of Performance Degradation and Failure Modes for Hydrogen-Fuelled Polymer Electrolyte Fuel Cells. Proceedings of the Institution of Mechanical Engineers, Part A: Journal of Power and Energy 222 (5): 421–41. doi:10.1243/09576509JPE603.
Ramousse, J., Sophie, D., Olivier, L. and Denis, M. (2008). Estimation of the Effective Thermal Conductivity of Carbon Felts Used as PEMFC Gas Diffusion Layers. International Journal of Thermal Sciences 47 (1): 1–6. doi:10.1016/j.ijthermalsci.2007.01.018.
Sadeghi, E., Djilali, N. and Bahrami, M. (2011). Effective Thermal Conductivity and Thermal Contact Resistance of Gas Diffusion Layers in Proton Exchange Membrane Fuel Cells. Part 1: Effect of Compressive Load. Journal of Power Sources 196 (1): 246–54. doi:10.1016/j.jpowsour.2010.06.039.
Scramlin, J., Brad, L., Alex, W., Joseph, P., Abigail, N., Kelsey, K., Keith, M., Eric, G., Thomas, P. and Michael, A. (2015). Visual Encyclopedia of Chemical Engineering. University of Michigan. http://encyclopedia.che.engin.umich.edu/. Segura, F. and Andu, J. M. (2009). Fuel Cells : History and Updating . A Walk along
Two Centuries 13: 2309–22. doi:10.1016/j.rser.2009.03.015.
Shi, Y., Shu, C. and Shuhai, Q. (2012). Fractal-Based Theoretical Model on Saturation and Relative Permeability in the Gas Diffusion Layer of Polymer Electrolyte Membrane Fuel Cells. Journal of Power Sources 209: 130–40. doi:10.1016/j.jpowsour.2012.02.092.
Shi, Y., Jinsheng, X., Mu, P. and Runzhang, Y. (2006). A Fractal Permeability Model for the Gas Diffusion Layer of PEM Fuel Cells. Journal of Power Sources 160 (1): 277–83. doi:10.1016/j.jpowsour.2006.01.032.
Shi, Y. , Jinsheng, X., Shuhai, Q., Mu, P. and Runzhang, Y. (2008). Fractal Model for Prediction of Effective Thermal Conductivity of Gas Diffusion Layer in Proton Exchange Membrane Fuel Cell. Journal of Power Sources 185 (1): 241– 47. doi:10.1016/j.jpowsour.2008.07.010.
Stacks, B. (1997). Low Cost Electrodes for Proton Exchange Membrane Fuel Cells Performance in Single Cells and Ballard Stacks 144 (11).
http://www.fuelcellsetc.com/store/Customized-MEA.
T-raissi, A. and Kenneth, G. S. (1992). Current Technology of Fuel Cell Systems, 1953–57.
Vishnyakov, V. M. (2006). Proton Exchange Membrane Fuel Cells. Vacuum 80 (10): 1053–65. doi:10.1016/j.vacuum.2006.03.029.
Wang, S. and Yulin W. (2016). International Journal of Heat and Mass Transfer Investigation of the through-Plane Effective Oxygen Diffusivity in the Porous Media of PEM Fuel Cells : Effects of the Pore Size Distribution and Water Saturation Distribution. International Journal of Heat and Mass Transfer 98. Elsevier Ltd: 541–49. doi:10.1016/j.ijheatmasstransfer.2016.03.060.
Wang, Y., Ken, S. C., Jeffrey, M., Sung, C. C. and Xavier, C. A. (2011). A Review of Polymer Electrolyte Membrane Fuel Cells: Technology, Applications, and Needs on Fundamental Research. Applied Energy 88 (4): 981–1007. doi:10.1016/j.apenergy.2010.09.030.
Wu, B., Ming, Z., Weiyu, S. and Wenming, L.(2014). ScienceDirect The Degradation Study of Nafion / PTFE Composite Membrane in PEM Fuel Cell under Accelerated Stress Tests. International Journal of Hydrogen Energy 39 (26). Elsevier Ltd: 14381–90. doi:10.1016/j.ijhydene.2014.02.142.
You, P. Y. and Kamarudin, S. K. (2017). Recent Progress of Carbonaceous Materials in Fuel Cell Applications : An Overview. Chemical Engineering Journal 309. Elsevier B.V.: 489–502. doi:10.1016/j.cej.2016.10.051.
Yu, B. (2004). Fractal Analysis of Permeabilities. AIChE Journal 50 (1).
Yu, B., and Cheng, P. (2002). A Fractal Permeability Model for Bi-Dispersed Porous Media. International Journal of Heat and Mass Transfer 45: 2983–93. doi:10.1016/S0017-9310(02)00014-5.
Zakil, F. A., Kamarudin, S. K. and Basri, S. (2016). Modified Nafion Membranes for Direct Alcohol Fuel Cells : An Overview 65: 841–52. doi:10.1016/j.rser.2016.07.040.
Zamel, N., Jürgen, B. and Andreas, W. (2012). Estimating the Thermal Conductivity and Diffusion Coefficient of the Microporous Layer of Polymer Electrolyte Membrane Fuel Cells. Journal of Power Sources 207. Elsevier B.V.: 70–80. doi:10.1016/j.jpowsour.2012.02.003.
Zhang, J., Zhong, X., Jiujun, Z., Yanghua, T., Chaojie, S., Titichai, N. and Zhiqing, S. (2006). High Temperature PEM Fuel Cells. Journal of Power Sources 160 (2): 872–91. doi:10.1016/j.jpowsour.2006.05.034.