Shalev, N. and Farkas, J. and Fietzke, J. and Novak, M. and Schuessler, J.A.
and Pogge von Strandmann, Philip A.E. and Torber, P.B. (2018) Mg isotope
inter-laboratory comparison of reference materials from earth-surface
low-temperature environments. Geostandards and Geoanalytical Research 42
(2), pp. 205-221. ISSN 1639-4488.
Downloaded from:
Usage Guidelines:
Please refer to usage guidelines at or alternatively
For Review Only
Mg isotope inter-laboratory comparison of reference materials from earth-surface low-temperature
environments
Journal: Geostandards and Geoanalytical Research
Manuscript ID GGR-0525.R2
Manuscript Type: Original Article
Date Submitted by the Author: n/a
Complete List of Authors: Shalev, Netta; The Hebrew University of Jerusalem, Institute of Earth Science; The Geological Survey of Israel; ETH Zurich, Earth sciences Farkas, Juraj; Czech University of Life Sciences Prague, Faculty of Environmental Sciences; Czech Geological Survey, Department of Geochemistry; University of Adelaide Faculty of Sciences, Department of Earth Sciences
Fietzke, Jan; GEOMAR, Marine Geosystems
Novak, Martin; Czech Geological Survey, Department of Geochemistry Schuessler, Jan; GFZ German Research Centre for Geosciences
Pogge von Strandmann, Philip ; University College London, and Birkbeck, University of London, London Geochemistry and Isotope Centre (LOGIC); Bristol University, Bristol Isotope Group (BIG)
Törber, Philip ; Czech University of Life Sciences Prague, Faculty of Environmental Sciences; Czech Geological Survey, Department of Geochemistry; University of Adelaide Faculty of Sciences, Department of Earth Sciences
Keywords: Mg isotopes, reference materials, Low-temperature, Earth-surface, Inter-laboratory comparison
For Review Only
Mg isotope inter-laboratory comparison of reference materials from
earth-1
surface low-temperature environments
2
3
Netta Shalev(1,2,3), Juraj Farkaš (4,5,6), Jan Fietzke (7), Martin Novák (5), Jan A. Schuessler (8), 4
Philip A.E. Pogge von Strandmann (9,10), Philip B. Törber (4,5,6) 5
6
Affiliations: 7
(1) Institute of Earth Science, the Hebrew University of Jerusalem, Edmond J. Safra campus, 91904, Jerusalem, Israel 8
(2) Geological Survey of Israel, 30 Malkhe Israel Street, 95501, Jerusalem, Israel 9
(3) Institute of Geochemistry and Petrology, Department of Earth Sciences, ETH Zürich, Clausiusstrasse 25, 8092 Zürich, 10
Switzerland; [email protected], Tel: +41 44 633 67 84, Fax: +41 44 632 11 79 11
(4) Faculty of Environmental Sciences, Czech University of Life Sciences Prague, Kamýcká 129, 165 21 Prague 6, Czech 12
Republic; [email protected] 13
(5) Department of Geochemistry, Czech Geological Survey, Geologická 6, 152 00 Prague 5, Czech Republic; 14
(6) Department of Earth Sciences, University of Adelaide, North Terrace, Adelaide, SA 5005, Australia; 16
(7) GEOMAR Helmholtz Center for Ocean Research Kiel, Wischhofstr. 1-3, 24148 Kiel, Germany; [email protected] 18
(8) GFZ German Research Centre for Geosciences, Telegrafenberg, 14473 Potsdam, Germany; jan.schuessler@gfz-19
potsdam.de 20
(9) London Geochemistry and Isotope Centre (LOGIC), University College London, and Birkbeck, University of London, 21
Gower Street, London, WC1E 6BT, UK; [email protected] 22
(10) Bristol Isotope Group (BIG), Bristol University, Wills Memorial Building, Queen’s Road, Bristol, BS8 1RJ. 23
24
For Review Only
Abstract
25
To enable quality control of measurement procedures for determinations of Mg isotope amount 26
ratios, expressed as δ26Mg and δ25Mg values, in earth-surface studies, the δ26Mg and δ25Mg values of 27
eight reference materials (RMs) were determined by inter-laboratory comparison between five 28
laboratories and considering published data, if available. These matrix RMs, including river water 29
SLRS-5, spring water SRM 1640a, Dead Sea brine DSW-1, dolomites JDo-1 and CRM 512, limestone 30
CRM 513, soil SRM 2709a and vegetation SRM 1515 apple leaves, are representative for a wide 31
range of earth-surface materials from low-temperature environments. The inter-laboratory 32
variability, 2s (twice the standard deviation), of all eight RMs ranges from 0.05 to 0.17 ‰ in δ26Mg. 33
Thus, it is suggested that all these materials are suitable for validation of δ26Mg and δ25Mg 34
determinations of earth-surface geochemical studies. 35
Keywords:Mg isotopes, Reference materials, Low-temperature, Earth-surface, Inter-laboratory 36
comparison 37
38
1.
Introduction
39
Magnesium is a major element of the silicate Earth and vital in biogeochemical cycling. It has three 40
stable isotopes: 24Mg (78.99%), 25Mg (10.00%), and 26Mg (11.01%). Analytical improvements over the 41
past decades have made the differentiation between the Mg isotope amount ratios (expressed as 42
δ26Mg and δ25Mg relative to the international δ-zero standard, DSM3; equation 1; Galy et al. 2003, 43
IUPAC, see Brand et al., 2014) of terrestrial materials possible and enable today’s rapid increase in 44
the use of Mg isotopes as a powerful tool in investigations of Earth’s biogeochemistry (e.g., Young 45
and Galy 2004, Teng 2017). Yet, determinations of δ26Mg and δ25Mg values of natural samples are 46
challenging, due to the significant risk of bias introduced during Mg purification, the large 47
instrumental mass bias and the sensitivity of the sample-standards-bracketing measurements to 48
matrix effects (e.g., Young and Galy 2004, An and Huang 2014, Teng 2017). Hence, processing well-49
For Review Only
characterised reference materials (RMs), similar in matrix to the samples, is required to validate the 50
results. While δ26Mg and δ25Mg values of silicate rock RMs are available for high-temperature 51
systems (Teng et al. 2015), Mg isotope data of RMs representative of samples with complex matrices 52
from earth-surface low-temperature environments are scarce (Bolou-Bi et al. 2009, Foster et al. 53
2010, An and Huang 2014, Teng 2017). To assess systematic errors and achieve comparability of Mg 54
isotope data between different laboratories concerning earth-surface low-temperature systems, 55
well-characterised matrix RMs need to be established. 56
δ26Mg and δ25Mg values are being used as a biogeochemical tool to study many different processes 57
in low-temperature environments, e.g., in marine environments and marine sediments and rocks 58
(e.g., Ling et al. 2011, Wombacher et al. 2011, Pogge von Strandmann et al. 2014, Higgins and Schrag 59
2015), evaporitic environments (e.g., Geske et al. 2015b, Shalev et al. 2017), soils and vegetation 60
(e.g., Tipper et al. 2010, Opfergelt et al. 2012, Pogge von Strandmann et al. 2012, Ma et al. 2015, 61
Uhlig et al. 2017) and ground water, spring water and rivers (e.g., Tipper et al. 2006b, Pogge von 62
Strandmann et al. 2008, Brenot et al. 2008, Chapela Lara et al. 2017). The most fractionated 63
materials on earth are found in low-temperature environments, with the lowest δ26Mg values found 64
in carbonates (δ26Mg of -5.6 ‰, Wombacher et al. 2011) and the highest in weathered residual 65
silicates (δ26Mg of +1.8 ‰, Liu et al. 2014b) and evaporites (δ26Mg= +1.4 ‰, Permian carnallite, 66
Shalev et al. 2017). However, the only natural earth surface RM which is well-characterised to date is 67
seawater (δ26Mg of -0.83 ±0.09 ‰; 2s; N=90; Foster
et al. 2010, Ling et al. 2011 and references 68
therein). Published δ26Mg and δ25Mg data of earth surface materials from more than two 69
laboratories (N >2) are also available for Cal-S limestone (-4.38 ±0.09 ‰, 2s, N=3; Wombacher et al. 70
2006; Bolou-Bi et al. 2009), SCo-1 shale (-0.89 ±0.08 ‰, 2s, N=3), JCp-1 aragonite (-1.96 ±0.05 ‰, 2s, 71
N=4) and JDo-1 dolomite (-2.37 ±0.04 ‰, 2s, N=5; Teng 2017 and references therein). Here, N is 72
used to denote the number of full-procedure replicates, i.e. independent sample dissolution and Mg 73
purification, while n is used to denote the number of repeated measurements of the purified Mg 74
sample solutions by MC-ICP-MS. 2s is twice the standard deviation on N or n values. 75
For Review Only
76In this study, the δ26Mg and δ25Mg values of eight RMs (Table 1), representative for their respective 77
earth surface environments, were estimated by inter-laboratory comparison, conducted in five 78
laboratories. The participating laboratories utilised different sample preparation methods, i.e., 79
different analyte-matrix separation procedures, and MC-ICP-mass spectrometers from various 80
manufacturers with different sample introduction systems (Table 2). This approach is suitable to test 81
the applicability of these different measurement methods with respect to the varying chemical and 82
physical material properties and to identify potential bias originating from differences in sample 83
preparation and instrument setup. Whereas measurement results from a single laboratory might 84
produce very precise δ26Mg and δ25Mg values for any material never analysed before, there is still 85
the potential risk that the data is affected by undetected bias. We suggest that our inter-laboratory 86
comparison study provides a robust and practicable approach to provide the geo-analytical 87
community with fit-for-purpose δ26Mg and δ25Mg values for matrix-RMs with confidence intervals 88
constrained by the currently attainable level of measurement precision. Materials of this study 89
included solids: carbonates, soil and organic material (leaves), and liquids: river water, spring water 90
and brine, thereby represent most of the material types from earth surface low-temperature 91
environments studied to date. Most selected RMs are provided by reference material producers and 92
are widely available to the community. Also, certified mass fractions data are available for most 93
materials studied in this work (Table 1). Based on the results of this study and published values, 94
where available, recommended δ26Mg and δ25Mg values are proposed. These can be used as quality 95
control RMs in laboratories analysing earth surface materials to verify their measurement methods. 96
[Table 1] 97
98
2.
Methods
99
2.1. Investigated materials 100
For Review Only
The investigated materials include: JDo-1 and BCS-CRM 512 dolomites, BCS-CRM 513 limestone, 101
SRM 2709a soil, SRM 1515 apple leaves, IAPSO Atlantic seawater, SLRS-5 river water, SRM 1640a 102
spring water and DSW-1 Dead Sea brine. Solid samples are powdered and require complete 103
dissolution prior to the column chemistry. The published chemical compositions of the investigated 104
materials are described in Table 1. ∑c(Matrix-cations)/c(Mg) molar ratios (i.e., the molar ratios of the 105
sum of Na, K, Ca, Si, Al, Ti, Fe and Mn relative to Mg) of the RMs vary significantly: Na/Mg ratios 106
range between 0.0 (carbonates) and 8.8 (seawater), Ca/Mg ratios range between 0.2 (seawater) and 107
220 (BCS-CRM 513 limestone) and K/Mg ratios range between 0.0 (JDo-1 and BCS-CRM 512 108
dolomites) and 3.7 (SRM 1515 apple leaves). The soil (SRM 2709a), spring water (SRM 1640a) and 109
limestone (BCS-CRM 513) have the most complex matrices with significant Si/Mg ratios (18, 3.3 and 110
0.8, respectively), Al/Mg ratios (4.6, 0.04 and 0.45, respectively), Fe/Mg ratios (1.0, 0.02 and 0.08, 111
respectively) and Ti/Mg ratio (0.12 in the soil SRM 2709a). 112
113
2.2. Measurement procedures 114
The eight RMs, IAPSO Atlantic seawater and Cambridge-1 were analysed for δ26Mg and δ25Mg values 115
in the laboratories of the University of Bristol (BIG) and University of London (UCL), UK (BIG LOGIC); 116
The Geological Survey of Israel (GSI), Jerusalem, Israel; the Helmholtz Laboratory for the 117
Geochemistry of the Earth Surface (HELGES) at GFZ Potsdam, Germany; the Czech Geological Survey 118
(CGS) in Prague (Czech Republic); and the GEOMAR Helmholtz Center for Ocean Research, Kiel, 119
Germany. The powdered or liquid RMs were split and spread among the different laboratories. Each 120
laboratory conducted measurements, using its own previously established measurement procedure, 121
to get completely independent results, and potentially identify any method-specific bias. The 122
different procedures for material digestion, Mg purification and instrumentation, conducted in each 123
laboratory, are described below and summarized in Table 2. All Mg isotope ratio measurements 124
were conducted by MC-ICP-MS using standard-sample bracketing and the calculated isotope amount 125
For Review Only
ratios are reported as per mil deviation from the delta-zero measurement standard DSM3 in the 126
delta notation according to Coplen (2011): 127
(1)
(
)
(
)
− =
= 1
Mg Mg
Mg Mg Mg
Mg
DSM3 24 x
sample 24 x 3 sample/DSM 24
/ x
x δ
δ 128
where x denotes either 26 or 25 and DSM3 is the mean value of the two bracketing standards 129
measured before and after the sample, respectively. Multiplication of equation (1) with a factor 130
1000 gives the per mil (‰) deviation relative to DSM3. 131
To validate the different measurement procedures used by the participating laboratories and to test 132
for any potential inter-laboratory bias, we adapted the following approach. During this study, 133
Cambridge-1 and IAPSO Atlantic seawater were analysed by all participating laboratories. These 134
results are compared to literature values (e.g., compilations in Teng 2017; An and Huang 2014; and 135
the in GeoReM database, Jochum et al. 2005) in order to validate the measurement procedure of 136
each laboratory. Thereby, the pure Mg-solution Cambridge-1 was used to evaluate the repeatability 137
precision of the MC-ICP-MS measurements (solution not processed through columns) for each 138
laboratory. Then, seawater was used to evaluate the intermediate precision of the entire 139
measurement procedure for each laboratory, including sample pre-treatment, matrix separation by 140
column chemistry, and MC-ICP-MS analysis. In addition, a typical intermediate precision was 141
estimated by each laboratory (Table 2), based on long-term (more than one year) repeated 142
measurements of one or more matrix materials as detailed below (sections 2.2.1-2.2.4). The only 143
case where this long-term experience with matrix material is missing is at GEOMAR and therefore 144
only Cambridge-1 repeatability precision was considered. These estimates are considered as a 145
benchmark against which we can evaluate the precision obtained on the matrix RMs investigated in 146
this inter-laboratory comparison study. Then, to provide consensus δ26Mg and δ25Mg values for each 147
earth-surface reference material, the arithmetic mean of N ≥ 3 full-procedure-replicates was 148
calculated. These comprised all data produced by the participating laboratories and – where 149
available – literature data and are reported together with 95% confidence intervals. 150
For Review Only
[Table 2]151
152
2.2.1. Sample preparation and Mg isotope ratio measurements at UCL and Bristol (BIG 153
LOGIC) 154
Procedures for sample analyses are similar to those described in previous studies (Pogge von 155
Strandmann 2008, Foster et al. 2010, Pogge von Strandmann et al. 2011, 2012). A brief description is 156
given below. 157
Carbonate powders (ca. 20 mg) were dissolved in 2 mol/l HCl. Apple leaves (SRM 1515, ca 50 mg) 158
were dissolved in repeated steps of concentrated HNO3, heated at 130 °C and evaporated to
159
dryness. Soil powders (ca. 10 mg) were dissolved in stages of concentrated HF-HNO3, followed by
160
HNO3, and finally 6 mol/l HCl. Water samples (ca. 0.01–0.2 ml) were simply dried down.
161
Subsequently, the samples were dissolved in 2 mol/l HNO3, and a small aliquot (around 0.2 - 3 µg
162
Mg) was taken for column chemistry. 163
Magnesium analyte-matrix separation was performed by a two-stage cation exchange chemistry, 164
using Bio-Rad AG® 50W-X12 (200-400 mesh) resin in 2 mol/l HNO3, as described by Pogge von
165
Strandmann et al. (2011). Soil samples were subjected to an additional column to quantitatively 166
remove Ti (because 48Ti2+ and 50Ti2+ are direct interferences on 24Mg+ and 25Mg+). This column 167
contained 0.25 ml of TRU-Spec™ resin, and Mg was eluted in 7 mol/l HNO3 (Pogge von Strandmann
168
et al. 2012). The total procedural blank for Mg isotope ratio measurements by this method is ca. 0.4 169
ng Mg, which is insignificant compared to the amount of Mg put through chemistry (<0.2 %). Splits 170
of the elution were collected before and after the Mg collection bracket, to ensure close to 100 % 171
Mg yield was achieved, i.e., <0.1 % of the processed Mg was detected in these splits. 172
Magnesium isotope ratio measurements were conducted using a Thermo Scientific Neptune MC-ICP-173
MS with a high-sensitivity “X” Ni skimmer cone and standard Ni sample cone interface. A purified 174
sample solution of ca. 100 ng/ml Mg was introduced via an Elemental Scientific Inc. Apex-Q, with a 175
ca. 50 µl/min uptake rate nebuliser tip, in 2 % HNO3 (v/v). Mg isotope ratios were measured in low
176
For Review Only
mass resolution mode (see footnote in table 2), with all intensities at m/z 24, 25 and 26 measured 177
simultaneously in separate Faraday cups (H3, Centre, L3). Each individual measurement consisted of 178
20 ratios (84 seconds total integration time). These conditions gave typical signals of 18 - 20 V/100 179
ng/ml on 24Mg. The on-peak background in 2 % HNO3 (v/v) was repeatedly recorded during the
180
sequence and subtracted from all standard and sample intensities. Each sample was analysed 3 or 4 181
times (n = 3 or n = 4 in Table 3) during the same session (336 seconds/sample), each time separated 182
by several hours. The difference in the measured 26Mg/24Mg intensities ratio between bracketing 183
DSM3 standards was ≤0.06 ‰ in all analyses performed for this study. 184
USGS (United States Geological Survey) and GSJ (Geological Survey of Japan) silicate rock reference 185
material measurement results by this procedure are documented by Pogge von Strandmann et al. 186
(2011), other silicate rocks by Teng et al. (2015), IAPSO Atlantic seawater results by Foster et al. 187
2010, and carbonates by Pogge von Strandmann 2008, Kasemann et al. (2014) and Pogge von 188
Strandmann et al. (2014). For example, measurements of the pure Mg solution Cambridge-1 189
(without processing through columns) gave -2.63 ±0.07 ‰ for δ26Mg and -1.36 ±0.06 ‰ for δ25Mg 190
(2s, n=126) and IAPSO Atlantic seawater results were -0.82 ±0.06 ‰ for δ26Mg and -0.43 ±0.04 ‰ for 191
δ25Mg (2s, n=26, Foster et al. 2010). Hence, the typical intermediate precision of this method, based 192
on several years of repeated measurements, is estimated at ±0.06 ‰ (2s) on δ26Mg, and ±0.04 ‰ 193
(2s) on δ25Mg. The results on reference materials agree with data obtained in other laboratories, 194
indicating no bias outside the stated precision. 195
196
2.2.2. Sample preparation and Mg isotope ratio measurements at GSI 197
Carbonate powders (ca. 100-150 mg) were dissolved in HNO3 and evaporated to dryness. Water
198
samples (ca. 10 µl DSW-1 and 2 ml IAPSO) were simply dried down. All samples were then re-199
dissolved in 10 ml 1.3 mol/l HCl and an aliquot (200-500 µg Mg) was taken for column chemistry. 200
Magnesium purification was performed by liquid chromatography (Galy et al. 2002) using Bio-Rad 201
Econo-Pac Chromatography Columns 732-1010 with an extended reservoir, filled with ca. 18 ml of 202
For Review Only
Bio-Rad AG® 50W-X12 100-200 mesh resin. The matrix was rinsed with 25 ml of 1.3 mol/l HCl and 20 203
ml of 2.3 mol/l HCl. Mg2+ was then eluted with 24 ml of 2.3 mol/l HCl. Total procedural blanks 204
contained <0.5 % Mg of the amount of Mg processed through column chemistry. The first and the 205
last 2 ml before and after the Mg elution were collected separately in order to verify close to 100% 206
Mg recovery. In addition, the Mg amount in the Mg cut (Mg-COL) was compared to the amount 207
originally loaded to the column (Mg-ORIG). Only samples with Mg-COL/Mg-ORIG >95 % (taking into 208
account the uncertainties of both measurements), no detectable Mg in the first and the last 2 ml 209
before and after the Mg fraction, and molar ratio of ∑c(matrix-cations)/c(Mg) in the final Mg fraction 210
of <5 % (after Galy et al. 2001 and others) were used for isotope ratio measurements. These 211
parameters were verified for each sample separation using ICP-AES (Optima 3300, Perkin–Elmer). 212
Once Mg was purified, the solution was fully evaporated and the chloride salts were re-dissolved in 213
0.1 mol/l HNO3.
214
Magnesium isotope ratio measurements were conducted using a Nu instruments Plasma II HR-MC-215
ICP-MS. The 2 µg/ml Mg solutions (in 0.1 mol/l HNO3) were introduced into the mass spectrometer
216
via a DSN-100 desolvation system (self-aspirating PFA nebuliser, uptake rate of ca. 100 µl/min) and 217
standard Ni cones interface. The measurements were conducted using pseudo-high resolution, with 218
a 50 μm source slit at a mass resolving power RP(5,95%) = 7000 (see footnote in table 2). Three
219
Faraday cup collectors were used to measure the ion beam intensities at m/z 24, 25 and 26 220
simultaneously. Each measurement run comprises 20 integrations of 10 s data acquisition, i.e. a total 221
200 seconds of data acquisition per measurement. These conditions gave sample signal intensities of 222
25-35 V on m/z 24. The zero reference points were reset simultaneously for all measured masses by 223
deflecting the potential of the electrostatic analyser before measuring each block. A blank solution 224
measured in the beginning of each measurements day, produced <5 mV on m/z 24 and therefore 225
the difference from the off-peak zero is considered insignificant. Each sample solution was measured 226
by several brackets of standard-sample-standard, which were used for statistical analysis, where n is 227
the number of brackets of each sample. Outliers were eliminated as long as their elimination 228
For Review Only
reduced the 95 % confidence interval (= ∙√), despite the reduction of n that rises both √ and the 229
t-distribution value. 230
The δ26Mg mean of pure Mg Cambridge-1 solution measured in this study is -2.62 ±0.14 ‰ (2s, n=36, 231
Table 3), identical within stated precisions to results reported by other laboratories (e.g., 232
compilations by Teng 2017, An and Huang 2014; -2.61 ±0.05 ‰, 2s). The δ26Mg value of IAPSO 233
Atlantic seawater reference material measured in this study (-0.84 ±0.09 ‰, 2s, n=12, Table 3) is also 234
identical to the previously reported seawater value (-0.83 ±0.09 ‰, 2s, N=90; Foster et al. 2010, Ling 235
et al. 2011 and references therein). In order to further test the measurement procedure, a sample of 236
modern Dead Sea brine (DSW-1) was purified through Mg column chemistry and this single solution 237
was repeatedly measured over two years (δ26Mg=-0.67 ±0.11 ‰, δ25Mg=-0.35 ±0.05 ‰, 2s, n=35, 238
Table 3). Accordingly, our long-term estimate of the typical intermediate precision is ±0.11 ‰ (2s) on 239
δ26Mg, and ±0.05 ‰ (2s) on δ25Mg. The results on reference materials agree with data obtained in 240
other laboratories, indicating no bias outside the stated precision. 241
242
2.2.3. Sample preparation and Mg isotope ratio measurements at GFZ 243
Solid powders (30 - 100 mg) were digested in HF/HNO3 mixture at 110 °C, followed by 6 mol/l HCl,
244
and 14 mol/l HNO3. For all samples, H2O2/HNO3 treatment in closed PFA-vials on a hotplate at 150
245
°C/ 24 h was used to remove organics. In addition, a separate batch of the organic-rich soil (SRM 246
2709a) and vegetation (SRM 1515) (ca. 1 g) were also acid-digested (H2O2/HNO3) using a microwave
247
system (MLS Start) at 160 °C/ 20 min and elevated pressure. Both, the PFA-vial-hotplate and the 248
microwave method achieved complete sample dissolution. Water RMs were evaporated on a hot 249
plate (10 to 20 ml for SLRS-5 and SRM 1640a; 0.1 to 0.5 ml for the others), then treated with HF and 250
H2O2/HNO3 and evaporated again to remove Si and dissolved organic carbon, respectively. All
251
samples were finally re-dissolved in 1 mol/l HNO3 and aliquots containing between 2.5 and 15 µg Mg
252
were taken for Mg purification. 253
For Review Only
Procedures for Mg purification and isotope ratio measurements are similar to those described 254
previously (Uhlig et al. 2017). A brief description of the method applied during this study is given 255
below. Magnesium purification was performed using chromatography columns (Spectrum PP 256
104704, ID 8 mm) filled with 2.8 ml Biorad AG® 50W-X12 resin. After matrix elution with 32 ml 1 257
mol/l HNO3, Mg was quantitatively eluted with 10 ml 2 mol/l HNO3. The Mg fraction was treated
258
again with H2O2/HNO3, evaporated and re-dissolved in 0.3 mol/l HNO3. Each material was processed
259
twice through the column procedure. Each column batch was accompanied by at least one 260
commonly used reference material (IAPSO Atlantic Seawater, basalts BCR-2, BHVO-2 or granite GS-261
N) and a blank. Total procedural blanks of the column chemistry and the H2O2/HNO3 treatment
262
contained <12 ng Mg, which is <0.5 % Mg compared to the amount of Mg processed through column 263
chemistry and is therefore considered insignificant (potential bias in δ26Mg is estimated <0.03 ‰). 264
Magnesium recovery (quantitative column yield), purity of the Mg solutions (>90 % Mg was found to 265
produce no bias using our measurement instrumental setup; see Pokharel et al. 2017), and the Mg 266
content in total procedural blanks were checked by ICP-OES (Varian 720ES) and quadrupole ICP-MS 267
(Thermo Scientific iCAP-Qc), respectively. 268
Magnesium isotope ratio measurements were conducted using a Thermo Scientific Neptune MC-ICP-269
MS equipped with a Neptune Plus Jet Interface (using a Pfeiffer OnToolBooster interface pump; 270
standard sample cone and X skimmer cone). The 500 ng/ml Mg solutions were introduced into the 271
mass spectrometer via a quartz-glass spraychamber (double pass cyclon-Scott type, Thermo SIS) 272
equipped with a self-aspirating PFA nebuliser with an uptake rate of ca. 100 µl/min. The ion beam 273
intensities at m/z 24, 25 and 26 were measured simultaneously in medium mass resolution mode 274
(see footnote table 2) on Faraday detectors (L2, C, H2, all 1011 Ω amplifiers). The H2 cup was slightly 275
moved toward higher masses so that 26Mg+ was measured on the interference-free low mass side of 276
the flat-top peak (to avoid potential interference from 12C14N+). 27Al+ and 23Na+ were simultaneously 277
monitored on Faraday detectors H4 and L4, respectively. Each measurement run comprises 20 278
cycles, with an integration time of 4.2 seconds for each cycle. These conditions gave sample signal 279
For Review Only
intensities >10 V for 24Mg. Background intensities (typically <8 mV 24Mg) were measured on-peak in 280
0.3 mol/l HNO3 before and after each standard-sample bracketing block and were subtracted from
281
the sample and the standard signal intensities. Measurement results were accepted only if the 282
instrumental mass bias was stable, i.e. linear drift <0.2 ‰, which is the deviation in 26Mg/24Mg 283
between two bracketing DSM3 standards. 284
The intermediate precision of this measurement procedure (including dissolution, Mg column 285
separation, dilution, and MC-ICP-MS analyses) was evaluated by repeat analyses of reference 286
materials (silicate rocks and IAPSO Atlantic Seawater) over the course of about 3 years (e.g., Uhlig et 287
al. 2017, Pokharel et al. 2017). For example, for BHVO-2 basalt we obtained a mean δ26Mg of -0.24 288
±0.10 ‰ and a mean δ25Mg of -0.13 ±0.06 ‰ (2s, n=24 measurements on N = 6 full dissolution and 289
column chemistry replicates), which is identical within stated precisions to results produced 290
independently in other laboratories (δ26Mg= -0.24 ±0.08 ‰, δ25Mg= -0.12 ±0.05 ‰, Teng 2017 and
291
references therein). Measurements of the pure Mg solution Cambridge-1 (without processing 292
through columns) gave a mean of -2.61 ±0.07 ‰ for δ26Mg and -1.35 ±0.05 ‰ for δ25Mg (2s, n=62) 293
and IAPSO Atlantic seawater results were -0.81 ±0.12 ‰ for δ26Mg and -0.41 ±0.06 ‰ for δ25Mg (2s, 294
n=13). Hence, our long-term estimate of the typical intermediate precision (based on repeated 295
analyses on different materials over ca. 3 years) is ±0.10 ‰ (2s) for δ25Mg and ±0.06 ‰ (2s) for 296
δ26Mg, respectively. The results on reference materials agree with data obtained in other 297
laboratories, indicating no bias outside the stated precision. 298
299
2.2.4. Sample preparation and Mg isotope ratio measurements at CGS and GEOMAR 300
Sample preparation for the measurements conducted at CGS and GEOMAR was done in the CGS 301
laboratory according to the following procedure. Carbonate powders were digested in 6 mol/l HCl. 302
Powders of the soil NIST SRM 2709a and apple leaves NIST SRM 1515a were successively dissolved in 303
concentrated 1:1 HF:HNO3 and H2O2:HNO3, respectively, to breakdown the silicate fractions and
304
organic matter. Aliquots of water RMs (equivalent to ca. 20 µg of Mg) were evaporated to dryness 305
For Review Only
and treated with concentrated HNO3. Solutions with visible solid residues were once again
re-306
dissolved in concentrated 1:1 HNO3:H2O2. All sample solutions were then evaporated to dryness and
307
re-dissolved in 3 % HNO3 (v/v). Prior to loading samples onto microcolumns, at least 20 µg Mg
308
aliquots were taken, evaporated to dryness and re-dissolved in 100 µl of 2.5 mol/l HCl. 309
Purification of Mg was accomplished by a three-step chromatographic separation, using 1.25 ml 310
resin (BioRad AG® 50W-X12, 200-400 mesh) in Savillex PFA 3.2 mm x 20 cm (inner diameter x length) 311
microcolumns, for the first and third steps, and 0.12 ml resin in 2.4 mm × 15 cm microcolumns for 312
the second step. In the first step, the Mg fraction, which still contains Na and Fe, was separated from 313
other matrix elements by elution with 4.90 ml 2.5 mol/l HCl and collected subsequently. In the 314
second step, the Mg fraction (with Fe) was separated from Na by elution with 4.96 ml 0.4 mol/l HCl 315
and subsequently collected with 1.5 ml 6 mol/l HCl. In the third step, the Mg fraction was separated 316
from Fe by rinsing with 5.2 ml 2 mol/l HNO3 prior to the elution of the purified Mg solution with 5.5
317
ml 2 mol/l HNO3. The purified Mg fractions were then evaporated to dryness, re-dissolved in 200 µl
318
concentrated 1:1 HF:HNO3, evaporated to dryness, re-dissolved in 200 µl concentrated 1:1
319
H2O2:HNO3, evaporated to dryness again and finally dissolved in ca. 3 % HNO3 (v/v) for Mg isotope
320
amount ratios analyses. Total procedural blank was <2 ng Mg. Mg yields of close to 100 % and molar 321
ratios of ∑c(matrix-cations)/c(Mg) in the final Mg fractions of <5 % were verified by a Thermo 322
Scientific iCAP-Q ICP-MS, as well as a Varian 720 series ICP-OES for each sample. 323
324
2.2.4.1. Mg isotope ratio measurements at CGS
325
Magnesium isotope ratio measurements were conducted using a Thermo Scientific Neptune MC-ICP-326
MS, equipped with Ni sampler and X-Version Ni skimmer cones. The 500 ng/ml Mg solutions were 327
introduced into the plasma via a 100 µl min−1 PFA nebuliser and a cyclonic quartz-glass spray
328
chamber. All measurements were carried out with the guard electrode turned on and in medium 329
mass resolution mode (see footnote table 2). The following cup configuration was used: the ion 330
beam intensities at m/z 24, 25 and 26 were measured simultaneously using Faraday cups L1, C, and 331
For Review Only
H2, respectively. Measurements were carried out on the low mass side of the peak to avoid 12C14N+ 332
interference signals on m/z 26. Each individual measurement comprised 30 cycles with 8.4 seconds 333
acquisition time per cycle. Each single delta value (equivalent to n = 1, as reported in Table 3) was 334
calculated by at least 3 repeated measurements of the same sample solution, each bracketed by 335
DSM3. Thus, each single delta value reported in Table 3 (n = 1) represents an average of 3 336
measurements of a sample and 4 measurements of DSM3. Typical signals on m/z 24 were about 4 to 337
8 V (i.e., ion beam of 24Mg+
). Procedural blank contributions, including background, were 338
consistently below 0.1 % of sample signals. Due to these very low blank contributions to the analyte 339
signals, no on-peak blank corrections were applied. Only an electronic background was collected at 340
half mass unit before each block and subtracted from the measured signals. 341
Isotope fractionation during column chemistry was not detected with δ26Mg values of -0.01 ±0.05 ‰ 342
(2s, n=3, based on a comparison of column processed and unprocessed DSM3) which further 343
substantiates high Mg yields after column chemistry of close to 100 %. Measurements of the pure 344
Mg solution Cambridge-1 (without processing through columns) gave a mean of -2.59 ±0.16 ‰ for 345
δ26Mg and -1.34 ±0.11 ‰ for δ25Mg (2s, n=18). The intermediate precision of the sample preparation 346
procedure and MC-ICP-MS measurement was estimated based on repeat column purifications and 347
measurements of IAPSO Atlantic seawater and was -0.87 ±0.10 ‰ for δ26Mg and -0.45 ±0.06 ‰ for 348
δ25Mg (2s, n = 14) during the period between the years 2012 and 2016. Hence, based on these long-349
term observations we estimate our typical intermediate precision at ±0.13 ‰ for δ26Mg and ±0.09 350
‰ for δ25Mg (2s). The results on reference materials agree with data obtained in other laboratories, 351
indicating no bias outside the stated precision. 352
353
2.2.4.2. Mg isotope ratio measurements at GEOMAR
354
The magnesium isotope ratio measurements were carried out in August 2012 using a Thermo 355
Scientific AXIOM MC-ICP-MS. R.A. Chilton cones (RAC19 & RAC705) have been used for best 356
sensitivity. Samples, prepared as 200 ng/ml Mg solutions in 5 % HNO3 (v/v), were introduced via an
357
For Review Only
ESI MicroFlow PFA-50 nebuliser (50 µl/min) coupled to a CETAC ARIDUS desolvator (sweep Ar gas: 358
ca. 2 l/min, N2: ca. 20 ml/min). Three Faraday cups have been utilized (L4: m/z 24, AX: m/z 25, H4:
359
m/z 26) for simultaneous data acquisition. The instrumentation had been allowed for stabilization 360
running ca. 1 day preliminarily tuned before actual fine tuning started. Tuning focused on hot and 361
stable plasma conditions, not primarily on maximum intensity. Typically, 200 ng/ml Mg solutions 362
yielded ca. 3.5 V 24Mg+ intensity. Each individual measurement result consisted of 10 DSM3 standard 363
runs bracketing 9 runs of the unknown sample. A single run started with a 15 seconds on-peak-zero 364
baseline measurement, while clean 5 % HNO3 (v/v) was introduced, followed by 50 x 2 s data
365
collection (on either standard or unknown). Finally, sample washout was performed introducing 366
clean 5 % HNO3 (v/v) for 60 seconds. Within each run, the collected 50 individual ratios of 25Mg/24Mg
367
and 26Mg/24Mg, respectively, were calculated based on the on-peak baseline-corrected m/z 24, 25 368
and 26 signal intensities. Results were calculated using the mean of the individual ratios after 369
removing statistical outliers (1s). Each run of the unknown was used to calculate the δ-value relative 370
to the preceding and following runs of DSM3. The resulting 9 δ-values were combined to an average 371
for the measurement. Each measurement consumed about 200 ng of total Mg. 372
The repeatability precision is estimated based on repeated measurements of Cambridge-1 during 373
this study (without processing through columns) which gave -2.58 ±0.08 ‰ for δ26Mg and -1.33 374
±0.06 ‰ for δ25Mg (2s, n =11). Measurements of Cambridge1 processed through columns gave -375
2.63 ±0.12 ‰ for δ26Mg and -1.31 ±0.03 ‰ for δ25Mg (2s, n =3; Table 3). The results agree with data
376
obtained in other laboratories, indicating no bias outside the stated precision. Because no long-term 377
data on repeated measurements on materials with different matrices is available to estimate the 378
typical intermediate precision of the GEOMAR laboratory, as was done for the other laboratories, 379
the typical precision was estimated by the long-term repeatability of the MC-ICP-MS to be ±0.08 ‰ 380
(2s) for δ26Mg and ±0.06 ‰ (2s) for δ25Mg, based on the unprocessed Cambridge-1 results. 381
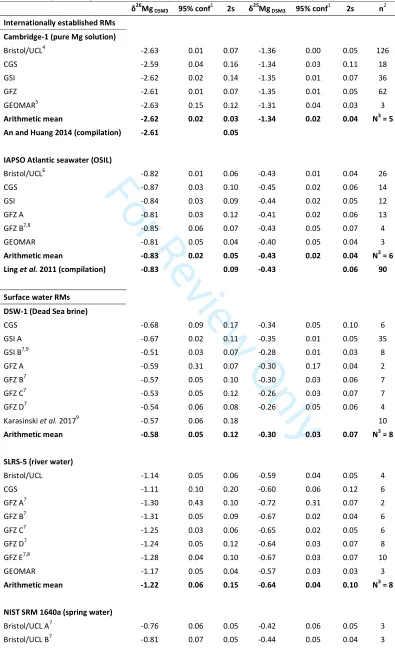
[Table 3] 382
383
For Review Only
3.
Results and Discussion
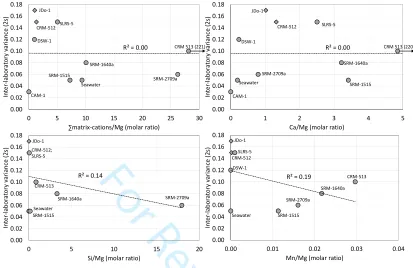
384
3.1 Individual results validation of the participating laboratories 385
All the δ26Mg’ versus δ25Mg’ results determined in different laboratories during this study plot on a 386
single line with a slope of 0.518 ±0.004 (Fig. 1; linear fit was obtained using the Isoplot software), 387
suggesting no major influence of isobaric interferences on the measured Mg isotope ratios. In 388
addition, the δ26Mg and δ25Mg values of Cambridge-1 and Seawater, on which large datasets are 389
available in the literature (e.g., compilations in Foster et al. 2010, Pogge von Strandmann et al. 2011, 390
Ling et al. 2011, An and Huang 2014, Teng 2017, and references therein and in the GeoReM 391
database, Jochum et al. 2005), were used to validate the individual measurement procedures and 392
measurement results performed by each laboratory. First, to validate each mass spectrometric 393
measurement procedure, the pure Mg solution Cambridge-1 was analysed without processing 394
through Mg column chemistry. Second, to include the various sample preparation methods for Mg 395
purification in the inter-laboratory comparison, IAPSO Atlantic seawater, which contains a complex 396
element matrix (∑c(matrix-cations)/c(Mg) = 9.2; Table 1), was processed and analysed repeatedly in 397
each laboratory. For both RMs, the δ25Mg and δ26Mg values agree well between all laboratories. The 398
absolute differences (bias) between the values measured in this study and published consensus 399
values are less than 0.04 ‰ and 0.03 ‰ for δ26Mg and δ25Mg, respectively (Table 3, Fig. 2), which 400
are well within the precisions reported by each laboratory. These observations indicate that the 401
various measurement procedures (including sample preparation and MC-ICP-MS measurements) do 402
not induce any significant bias outside the reported measurement precision. However, due to the 403
fact that all measurements in this and previous studies were conducted by MC-ICP-MS instruments, 404
an independent validation using a different method cannot be made to exclude any potential 405
systematic MC-ICP-MS bias. However, to date no other technique is able to measure δ26Mg and 406
δ25Mg at the level of precision obtainable by MC-ICP-MS. 407
The MC-ICP-MS repeatability precision for Cambridge-1 determined by each laboratory ranges from 408
0.07 to 0.16 ‰ (2s) for δ26Mg and 0.03 to 0.11 ‰ (2s) for δ25Mg (Table 3). The intermediate 409
For Review Only
precision of the entire measurement procedure based on multiple IAPSO Atlantic seawater sample 410
preparations and MC-ICP-MS analyses ranges from 0.04 to 0.12 ‰ (2s) for δ26Mg and 0.04 to 0.09 ‰ 411
(2s) for δ25Mg (Table 3). Because the 2s of IAPSO Atlantic seawater results is not systematically larger 412
than the precision (2s) of Cambrigde-1 results, we conclude that the different sample preparation 413
methods do not introduce any additional significant sources of uncertainty that are not already 414
included in the intermediate measurement precision (2s) reported for each RM result by the 415
different laboratories. 416
These findings are also consistent with the ‘typical’ intermediate precision reported by each 417
laboratory, based on δ26Mg and δ25Mg values measurements of various RMs and natural samples 418
over the long-term (between 0.06 ‰ and 0.13 ‰, 2s, in δ26Mg, and 0.04 ‰ and 0.09 ‰, 2s, in 419
δ25Mg, Table 2, Fig. 2). Thus, the individual results from the different laboratories can be used to 420
evaluate the consensus δ26Mg and δ25Mg values of the ‘new’ earth-surface RMs analysed in this
421
study. This means that the consensus mean δ25Mg and δ26Mg values of the full-procedure-replicates 422
measured by the different laboratories and their variance (reported both as 2s and 95 % confidence 423
interval in tables 3 and 4) include random errors that stem from all influencing factors (sample 424
preparation, matrix separation, instrumental conditions, etc.). Hence, following a “top-down” 425
approach of uncertainty evaluation (e.g., Potts 2012a,b), we report consensus mean values for each 426
earth-surface RM characterised in this study together with an uncertainty statement (95 % 427
confidence interval- 95 % conf.), based on the δ25Mg and δ26Mg values reported by each laboratory,
428
as discussed in the next section. 429
[Figure 1] 430
[Figure 2] 431
432
3.2 Assigning consensus δ26Mg and δ25Mg values to the reference materials 433
The results of the eight RMs, from the laboratories participating in this study, as well as the available 434
literature data, are shown in table 3 and figure 2. The range of δ26Mg values of the studied RMs 435
For Review Only
covers almost the entire range of terrestrial materials (e.g., Teng 2017). As expected, the lowest 436
δ26Mg values were found in carbonates: limestone BCS-CRM 513a (-4.46 ±0.12 ‰, 95 % conf., n=3), 437
which represents the lower part of the global δ26Mg range of limestones, and the dolomites, JDo-1 438
and CRM 512 (-2.35 ±0.05 ‰, 95 % conf., n=11 and -2.03 ±0.09 ‰, 95 % conf., n=6, respectively), 439
which are within a typical range of dolomites (Teng 2017 and references therein). The most positive 440
δ26Mg value was found in the soil SRM 2709a (-0.15 ±0.03 ‰, 95 % conf., n=6), typical for silicate 441
soils (Teng 2017 and references therein). The apple leaves SRM 1515 has δ26Mg value of -1.22 ±0.03 442
‰ (95 % conf., n=6), consistent with previous findings. δ26Mg values in plants depend on the sources 443
of Mg and on complex isotope fractionation processes during the uptake of Mg and transport within 444
the plant (e.g., Black et al. 2008, Bolou-Bi et al. 2010, 2012, Tipper et al. 2010). In general, Mg in 445
rivers and groundwaters yield a large range of δ26Mg values with a flux-weighted δ26Mg of global 446
runoff of -1.09 ‰ (Tipper et al. 2006b). SLRS-5 river water (-1.22 ±0.06 ‰, 95 % conf., n=8) has 447
lower δ26Mg value and spring water SRM 1640a (-0.73 ±0.03 ‰, 95 % conf., n=9) has higher δ26Mg 448
value, relative to this average. The higher δ26Mg value of the Dead Sea brine (DSW-1; -0.58 ±0.05 ‰, 449
95 % conf., n=8) relative to its precursor seawater may represent a contribution of 24Mg-depleted 450
dolomitizing brines (Gavrieli et al. 2009, Shalev et al. 2014). 451
To obtain mean δ26Mg and δ25Mg values for the RMs, we evaluate the inter-laboratory 452
reproducibility (indicated as 2s on the consensus value derived from the results of all laboratories 453
and literature data; Table 3). All eight RMs have an inter-laboratory reproducibility (2s) of 0.05 to 454
0.17 ‰ in δ26Mg. For most RMs (DSW-1, SRM 1640a, SRM 2709a, SRM 1515 and CRM 513), the 455
inter-laboratory reproducibility (0.05 ‰ – 0.12 ‰) is within or below the range of the ‘typical’ 456
intermediate precision of the laboratories estimated from repeat analysis of different materials over 457
the long-term (0.06 ‰ – 0.13 ‰ in δ26Mg), indicating that the measurement procedures used in all 458
laboratories do not induce any additional uncertainty contributions when samples with such 459
matrices are processed and measured. For these RMs, the individual results from all laboratories 460
also agree within the reported measurement precision of each sample (Table 3 and Fig. 2). However, 461
For Review Only
the inter-laboratory reproducibilities of three RMs, i.e., SLRS-5 river water, JDo-1 dolomite and CRM 462
512 dolomite (2s of 0.15 ‰, 0.15 ‰ and 0.17 ‰, respectively), are slightly higher than the ‘typical’ 463
intermediate precisions reported by the participating laboratories. While all the individual SLRS-5 464
results agree within 2s measurement precision of the repeat measurements of each RM, this is not 465
the case for all individual results of the two dolomite RMs, JDo-1 and CRM 512 (Fig. 2). Averaged 466
data of JDo-1 reported in the literature seem to be more uniform, but in some cases the reported 2s 467
is larger, covering the whole range obtained in current research (Wombacher et al. 2009, Pearce et 468
al. 2012, Mavromatis et al. 2013, Beinlich et al. 2014, Mavromatis et al. 2014, Lavoie et al. 2014; Fig. 469
2). Similar to the results of this study, Wombacher et al. (2009) reported a precision of 0.18 ‰ (2s) 470
on the mean of twelve measurement results of JDo-1 from four different Mg separations (test 471
portions of 2.5 – 40 mg). Note that most of these values (Pearce et al. 2012, Mavromatis et al. 2013, 472
Beinlich et al. 2014, Mavromatis et al. 2014) were obtained using a similar chemical sample 473
preparation procedure. 474
The reasons for the slightly higher inter-laboratory variance in the dolomite RMs are unknown. Inter-475
laboratory variance can arise from many factors, including material properties (e.g., homogeneity at 476
the level of the test portion, or stability over time), sample preparation procedure (e.g., incomplete 477
dissolution, column yield, analyte purity and blank) and the procedures used in the mass 478
spectrometric measurements and data reduction (e.g., mass bias stability and mass bias correction, 479
matrix effects). No correlation was found between molar matrix elements/Mg ratios and the inter-480
laboratory variance (examples in Fig. 3). Moreover, we checked for any correlations between 481
individual δ26Mg values and test portions, blank/Mg, column capacity, but did not find any 482
systematic relations. Thus, further investigation on these RMs is required to determine the sources 483
of the observed variance. 484
The consensus δ26Mg and δ25Mg mean values for the studied RMs are provided in Table 4 together 485
with an associated uncertainty for each value. This uncertainty was estimated by the 95 % 486
confidence interval on the mean of N laboratory results, including literature data, if available. 487
For Review Only
[Table 4]
488
489
4.
Summary and conclusions
490
In this study, the δ26Mg and δ25Mg values of eight earth surface reference materials (RMs), 491
representative of different low-temperature environments and material types, were determined by 492
inter-laboratory comparison. Despite the differences in sample preparation procedures, different 493
test portions, instrumentation, and isotope ratio measurement procedures, good agreement of the 494
δ26Mg and δ25Mg data from the different laboratories was found. This encouraging result suggests 495
that all methods described in this study are suitable for geochemical studies on these type of 496
materials given they are strictly monitored and calibrated (recovery, blanks, matrix-removal, etc.). 497
Moreover, the investigated RMs are suitable to be used by other laboratories for routine quality 498
control of Mg isotope ratio measurement procedures during environmental and earth surface 499
geochemical studies. The wide range of matrices, including river water, spring water, brine, 500
dolomites, limestone, soil and plant leaves, allow analysts to identify potential issues (and facilitate 501
modifications) with sample preparation methods previously developed for silicate rocks, for 502
example, which are then applied to different sample types, such as Ca-rich carbonates, organic-rich 503
soils or vegetation. 504
505
5.
Acknowledgments
506
PPvS acknowledges ERC Consolidator grant 682760 - CONTROLPASTCO2. J. Bartel and J. Buhk are 507
acknowledged for laboratory support at GFZ. F. von Blanckenburg and the Helmholtz Association are 508
thanked for infrastructure support at GFZ. The analytical work done at CGS, GEOMAR and CULS was 509
supported via the European Union’s Horizon 2020 research and innovation programme, under grant 510
agreement No 643084 (Base-LiNE Earth project), and the Czech Science Foundation (GACR) grants 511
No. 17-18120S and P210/12/P631. Technical and laboratory assistance of T. Magna, M. Francová, M. 512
For Review Only
Šimeček and J. Míková at CGS is acknowledged. The research done at the University of Adelaide was 513
supported via Base-LiNE Earth, and the ARC Linkage project LP160101353 to JF. NS acknowledges L. 514
Halicz, I. Gavrieli, B. Lazar and D. Vance for their advices and support and N. Teplyakov, Y. Zakun and 515
K. Weiss for laboratory support at GSI. The work at GSI was funded by the DFG-trilateral project 516
TRION (Ei272/30-1), the Israeli Ministry of Science, Technology and Space (Eshkol scholarship), the 517
Israeli Ministry of National Infrastructures, Energy and Water resources and Dalia and Dan Maydan 518
Fellowship. The research done at ETH Zürich was funded by an ETH postdoctoral fellowship (FEL-14 519
16-1).The authors would also like to thank the editor, T. Meisel, and two anonymous reviewers 520
whose comments helped to significantly improve this manuscript. 521
522
6.
References
523
An Y. and Huang F. (2014) 524
A review of Mg isotope analytical methods by MC-ICP-MS. Journal of Earth Science, 25, 822–840. 525
526
Beinlich A., Mavromatis V., Austrheim H. and Oelkers E.H. (2014) 527
Inter-mineral Mg isotope fractionation during hydrothermal ultramafic rock alteration – Implications 528
for the global Mg-cycle. Earth and Planetary Science Letters, 392, 166–176. 529
530
Black J.R., Epstein E., Rains W.D., Yin Q.Z. and Casey W.H. (2008) 531
Magnesium-isotope fractionation during plant growth. Environmental Science and Technology, 42, 532
7831-7836. 533
534
Bolou-Bi E.B., Vigier N., Brenot A. and Poszwa A. (2009) 535
Magnesium isotope compositions of natural reference materials. Geostandards and Geoanalytical 536
Research, 33, 95–109. 537
538
Bolou-Bi E.B., Poszwa A., Leyval C. and Vigier N. (2010) 539
Experimental determination of magnesium isotope fractionation during higher plant growth. 540
Geochimica et Cosmochimica Acta, 74, 2523-2537. 541
542
Bolou-Bi E.B., Vigier N., Poszwa A., Boudot J.P. and Dambrine E. (2012) 543
Effects of biogeochemical processes on magnesium isotope variations in a forested catchment in the 544
Vosges Mountains (France). Geochimica et Cosmochimica Acta, 87, 341-355. 545
546
Brand W.A., Coplen T.B, Vogl J., Rosner M. and Prohaska T. (2014) 547
Assessment of international reference materials for isotope-ratio analysis (IUPAC Technical Report). 548
Pure and Applied Chemistry, 86, 425–467. 549
For Review Only
550Brenot A., Cloquet C., Vigier N., Carignan J. and France-Lanord C. (2008) 551
Magnesium isotope systematics of the lithologically varied Moselle river basin, France. Geochimica 552
et Cosmochimica Acta, 72, 5070–5089. 553
554
Chapela Lara M., Buss H.L., Pogge von Strandmann P.A.E., Schuessler J.A. and Moore O.W. (2017) 555
The influence of critical zone processes on the Mg isotope budget in a tropical, highly weathered 556
andesitic catchment. Geochimica et Cosmochimica Acta, 202, 77–100. 557
558
Coplen T.B. (2011) 559
Guidelines and recommended terms for expression of stable-isotope-ratio and gas-ratio 560
measurement results. Rapid Communications in Mass Spectrometry, 25, 2538-2560. 561
562
Foster G.L., Pogge von Strandmann P.A.E. and Rae J.W.B. (2010) 563
Boron and magnesium isotopic composition of seawater. Geochemistry Geophysics Geosystems, 564
11, 1–10. 565
566
Galy A., Belshaw N.S., Halicz L. and O’Nions R.K. (2001) 567
High-precision measurement of magnesium isotopes by multiple-collector inductively coupled 568
plasma mass spectrometry. International Journal of Mass Spectrometry, 208, 89–98. 569
570
Galy A., Bar-Matthews M., Halicz L. and O’Nions R.K. (2002) 571
Mg isotopic composition of carbonate: insight from speleothem formation. Earth and Planetary 572
Science Letters, 201, 105–115. 573
574
Galy A., Yoffe O., Janney P.E., Williams R.W., Cloquet C., Alard O., Halicz L., Wadhwa M., Hutcheon 575
I.D., Ramon E. and Carignan J. (2003) 576
Magnesium isotope heterogeneity of the isotopic standard SRM980 and new reference materials for 577
magnesium-isotope-ratio measurements. Journal of Analytical Atomic Spectrometry, 18, 1352– 578
1356. 579
580
Gavrieli I., Yoffe O., Burg A. and Halicz L. (2009) 581
Mg isotope fractionation in the Ca-chloride Dead Sea brine system. Geochimica et Cosmochimica 582
Acta Supplement, 73, A419. 583
584
Geske A., Lokier S., Dietzel M., Richter D.K., Buhl D. and Immenhauser A. (2015) 585
Magnesium isotope composition of sabkha porewater and related (Sub-)Recent stoichiometric 586
dolomites, Abu Dhabi (UAE). Chemical Geology, 393–394, 112–124. 587
588
Golan R., Gavrieli I., Ganor J. and Lazar B. (2016) 589
Controls on the pH of hyper-saline lakes - A lesson from the Dead Sea. Earth and Planetary Science 590
Letters, 434, 289–297. 591
592
Higgins J.A. and Schrag D.P. (2015) 593
The Mg isotopic composition of Cenozoic seawater – evidence for a link between Mg-clays, seawater 594
Mg/Ca, and climate. Earth and Planetary Science Letters, 416, 73–81. 595
596
Jochum K.P., Nohl U., Herwig K., Lammel E., Stoll B. and Hofmann A.W. (2005) 597
For Review Only
GeoReM: A New Geochemical Database for Reference Materials and Isotopic Standards. 598
Geostandards and Geoanalytical Research, 29, 333–338. 599
600
Karasinski J., Bulska E., Wojciechowski M., Halicz L. and Krata A.A. (2017) 601
High precision direct analysis of magnesium isotope ratio by ion chromatography/multicollector-602
ICPMS using wet and dry plasma conditions. Talanta, 165, 64–68. 603
604
Kasemann S.A., Pogge von Strandmann P.A.E., Prave A.R., Fallick A.E., Elliott T. and Hoffmann K.H. 605
(2014) 606
Continental weathering following a Cryogenian glaciation: Evidence from calcium and magnesium 607
isotopes. Earth and Planetary Science Letters, 396, 66–77. 608
609
Lavoie D., Jackson S. and Girard I. (2014) 610
Magnesium isotopes in high-temperature saddle dolomite cements in the lower Paleozoic of 611
Canada. Sedimentary Geology, 305, 58–68. 612
613
Ling M.-X., Sedaghatpour F., Teng F.-Z., Hays P.D., Strauss J. and Sun W. (2011) 614
Homogeneous magnesium isotopic composition of seawater: an excellent geostandard for Mg 615
isotope analysis. Rapid communications in mass spectrometry, 25, 2828–2836. 616
617
Liu X.M., Teng F.Z., Rudnick R.L., McDonough W.F. and Cummings M.L. (2014) 618
Massive magnesium depletion and isotope fractionation in weathered basalts. Geochimica et 619
Cosmochimica Acta, 135, 336–349. 620
621
Ma L., Teng F.-Z., Jin L., Ke S., Yang W., Gu H.-O. and Brantley S.L. (2015) 622
Magnesium isotope fractionation during shale weathering in the Shale Hills Critical Zone 623
Observatory: Accumulation of light Mg isotopes in soils by clay mineral transformation. Chemical 624
Geology, 397, 37–50. 625
626
Mavromatis V., Meister P. and Oelkers E.H. (2014) 627
Using stable Mg isotopes to distinguish dolomite formation mechanisms: A case study from the Peru 628
Margin. Chemical Geology, 385, 84–91. 629
630
Opfergelt S., Georg R.B., Delvaux B., Cabidoche Y.-M., Burton K.W. and Halliday A.N. (2012) 631
Mechanisms of magnesium isotope fractionation in volcanic soil weathering sequences, Guadeloupe. 632
Earth and Planetary Science Letters, 341–344, 176–185. 633
634
Pearce C.R., Saldi G.D., Schott J. and Oelkers E.H. (2012) 635
Isotopic fractionation during congruent dissolution, precipitation and at equilibrium: Evidence from 636
Mg isotopes. Geochimica et Cosmochimica Acta, 92, 170–183. 637
638
Pokharel R., Gerrits R., Schuessler J.A., Floor G., Gorbushina A.A. and von Blanckenburg F. (2017) 639
Mg isotope fractionation during uptake by a rock-inhabiting, model microcolonial fungus Knufia 640
petricola at acidic and neutral pH. Environmental Science & Technology, 51, 9691–9699. 641
642
Pogge von Strandmann P.A.E. (2008) 643
Precise magnesium isotope measurements in core top planktic and benthic foraminifera. 644
Geochemistry, Geophysics, Geosystems, 9, 1-13. 645
For Review Only
646Pogge von Strandmann P.A.E., Burton K.W., James R.H., van Calsteren P., Gislason S.R. and 647
Sigfússon B. (2008) 648
The influence of weathering processes on riverine magnesium isotopes in a basaltic terrain. Earth 649
and Planetary Science Letters, 276, 187–197. 650
651
Pogge von Strandmann P.A.E., Elliott T., Marschall H.R., Coath C., Lai Y.J., Jeffcoate A.B. and Ionov 652
D.A. (2011) 653
Variations of Li and Mg isotope ratios in bulk chondrites and mantle xenoliths. Geochimica et 654
Cosmochimica Acta, 75, 5247–5268. 655
656
Pogge von Strandmann P.A.E., Opfergelt S., Lai Y.-J., Sigfússon B., Gislason S.R. and Burton K.W. 657
(2012) 658
Lithium, magnesium and silicon isotope behaviour accompanying weathering in a basaltic soil and 659
pore water profile in Iceland. Earth and Planetary Science Letters, 339–340, 11–23. 660
661
Pogge von Strandmann P.A.E., Forshaw J. and Schmidt D.N. (2014) 662
Modern and Cenozoic records of magnesium behaviour from foraminiferal Mg isotopes. 663
Biogeosciences Discussions, 11, 7451–7484. 664
665
Potts P.J. (2012a) 666
A Proposal for the Publication of Geochemical Data in the Scientific Literature. Geostandards and 667
Geoanalytical Research, 36, 225-230. 668
669
Potts P.J. (2012b) 670
Glossary of Analytical and Metrological Terms from the International Vocabulary of Metrology 671
(2008). Geostandards and Geoanalytical Research, 36, 231-246. 672
673
Shalev N., Lazar B., Halicz L. and Gavrieli I. (2014) 674
Magnesium isotope fractionation during epigenetic dolomitization of carbonate rocks. Goldschmidt 675
Abstracts 2014, 2257. 676
677
Shalev N., Lazar B., Halicz L. and Gavrieli I. (2017) 678
Mg isotope fractionation during precipitation of marine Mg- evaporites. Goldschmidt Abstracts 679
2017, 3606. 680
681
Summerhayes C. P. and Thorpe S.A. (1996) 682
Oceanography An Illustrated Guide: Chapter 11. CRC Press, 165–181. 683
684
Teng F.-Z., Qing-Zhu Yin, Ullmann C.V., Chakrabarti R., Pogge von Strandmann P.A.E., Yang W., Li 685
W.-Y., Ke S., Wimpenny F.S.J., Meixner A., Romer R.L., Wiechert U. and Jacobsen S.B. (2015) 686
Interlaboratory comparison of magnesium isotopic compositions of 12 felsic to ultramafic igneous 687
rock standards analyzed by MC-ICPMS. Geochemistry Geophysics Geosystems, 16, 3197–3209. 688
689
Teng F.-Z. (2017) 690
Magnesium Isotope Geochemistry. Reviews in Mineralogy and Geochemistry, 82, 219–287. 691
692
Tipper E.T., Galy A. and Bickle M.J. (2006a) 693
For Review Only
Riverine evidence for a fractionated reservoir of Ca and Mg on the continents: Implications for the 694
oceanic Ca cycle. Earth and Planetary Science Letters, 247, 267–279. 695
696
Tipper E.T., Galy A., Gaillardet J., Bickle M.J., Elderfield H. and Carder E.A. (2006b) 697
The magnesium isotope budget of the modern ocean: Constraints from riverine magnesium isotope 698
ratios. Earth and Planetary Science Letters, 250, 241–253. 699
700
Tipper E., Gaillardet J., Louvat P., Capmas F. and White A.F. (2010) 701
Mg isotope constraints on soil pore-fluid chemistry: Evidence from Santa Cruz, California. 702
Geochimica et Cosmochimica Acta, 74, 3883–3896. 703
704
Uhlig D., Schuessler J.A., Bouchez J., Dixon J.L. and von Blanckenburg F. (2017) 705
Quantifying nutrient uptake as driver of rock weathering in forest ecosystems by magnesium stable 706
isotopes. Biogeosciences, 14, 3111–3128. 707
708
Wombacher F., Eisenhauer A., Heuser A. and Weyer S. (2006) 709
Combined chemical separation of Mg, Ca and Fe from geological reference samples for stable 710
isotope determination by MC-ICP-MS and double-spike TIMS. In Geophysical Research Abstracts, 8, 711
A06219. 712
713
Wombacher F., Eisenhauer A., Heuser A. and Weyer S. (2009) 714
Separation of Mg, Ca and Fe from geological reference materials for stable isotope ratio analyses by 715
MC-ICP-MS and double-spike TIMS. Journal of Analytical Atomic Spectrometry, 24, 627. 716
717
Wombacher F., Eisenhauer A., Böhm F., Gussone N., Regenberg M., Dullo W.-C. and Rüggeberg A. 718
(2011) 719
Magnesium stable isotope fractionation in marine biogenic calcite and aragonite. Geochimica et 720
Cosmochimica Acta, 75, 5797–5818. 721
722
Young E.D. and Galy A. (2004) 723
The Isotope Geochemistry and Cosmochemistry of Magnesium. Reviews in mineralogy and 724
geochemistry Geochemistry, 55, 197–230. 725
726
For Review Only
List of tables:Table 1: Materials descriptions and chemical compositions. GSJ: Geological Survey of Japan, BAS: Bureau of Analysed
Samples Ltd., NIST: National Institute for Science and Technology, CCRMP: Canadian Certified Reference Material Programme, GSI: Geological Survey of Israel.
Table 2: Summary of analytical techniques used by each laboratory
Table 3: δ26Mg and δ25Mg values of the low-temperature RMs determined in current and previous studies.
Table 4: Inter-laboratory consensus δ26Mg and δ25Mg values from this study and literature, if available, of low-temperature, earth-surface reference materials.
List of figures:
Figure 1: δ25Mg’ versus δ26Mg’ values determined in this study. Error bars are 2s of each result. All the data is in accordance with a regression line that crosses the origin (dotted line) and has a slope of 0.52, typical to mass-dependant fractionation of terrestrial material.
Figure 2: δ26Mg values of the studied earth-surface low-temperature materials. Individual results from each laboratory (grey circles) are presented with their repeatability precision (2s, twice the standard deviation of n repeated
measurements). Multiple results from individual laboratories represent full-procedure replicates (including dissolution, Mg columns, and MC-ICP-MS measurements). Capped error bars next to each individual results indicate the typical
intermediate precision (2s) for each laboratory (based on repeat analyses of samples with different matrices over the long-term) for comparison with the measurement precision of the matrix RMs. Available literature data (specified in table 3) is also presented (white squares). Triangles, in the DSW-1 plot, refer to different samples of the Dead Sea brine. The inter-laboratory arithmetic mean of these individual results is also shown (black circle) with 2s error bars and 95 % confidence interval (presented by grey dotted lines). The vertical axis in all plots ranges 0.8 ‰.
Figure 3: Inter-laboratory variance (2s reproducibilities) of the studied materials versus selected matrix element molar
ratios (before Mg purification by column chemistry). Dolomite RMs, JDo-1 and CRM-512, are shown as diamonds. Low R2 of
the linear regression lines (dashed lines) demonstrates absence of any correlation. 2
For Review Only
Figure 1: δ25Mg’ versus δ26Mg’ values determined in this study. Error bars are 2s of each result. All the data is in accordance with a regression line that crosses the origin (dotted line) and has a slope of 0.52, typical to mass-dependant fractionation of terrestrial material.
y = 0.518x R² = 0.999
-3.0 -2.5 -2.0 -1.5 -1.0 -0.5 0.0 0.5
-5 -4 -3 -2 -1 0
δ
2
5M
g
'
[‰
]
δ26Mg' [‰]
For Review Only
-1.2 -1.0 -0.8 -0.6 -0.4 δδδδ 2 6M gD S M 3 (‰ ) Atlantic Seawater -1.6 -1.4 -1.2 -1.0 -0.8 δδδδ 2 6M gD S M 3 (‰ )SLRS-5 river water
-0.5 -0.3 -0.1 0.1 0.3 δδδδ 2 6M gD S M 3 (‰ )
SRM 2709a soil
-2.6 -2.4 -2.2 -2.0 -1.8 δδδδ 2 6M gD S M 3 (‰ ) JDo-1 dolomite -4.8 -4.6 -4.4 -4.2 -4.0 δδδδ 2 6M gD S M 3 (‰ )
CRM 513 limestone
-3.0 -2.8 -2.6 -2.4 -2.2 δδδδ 2 6M gD S M 3 (‰ ) Cambridge-1 -1.0 -0.8 -0.6 -0.4 -0.2 δδδδ 2 6M gD S M 3 (‰ ) DSW-1 -1.1 -0.9 -0.7 -0.5 -0.3 δδδδ 2 6M gD S M 3 (‰ )
SRM 1640a spring water
-1.6 -1.4 -1.2 -1.0 -0.8 δδδδ 2 6M gD S M 3 (‰ )
SRM 1515 apple leaves
-2.4 -2.2 -2.0 -1.8 -1.6 δδδδ 2 6M gD S M 3 (‰ )
CRM 512 dolomite