R E S E A R C H
Open Access
547 transcriptomes from 44 brain areas
reveal features of the aging brain in
non-human primates
Ming-Li Li
1,2†, Shi-Hao Wu
2,3†, Jin-Jin Zhang
1,2, Hang-Yu Tian
1,2, Yong Shao
1,2, Zheng-Bo Wang
4, David M. Irwin
5,
Jia-Li Li
3, Xin-Tian Hu
3,6,7*and Dong-Dong Wu
1,7,8*Abstract
Background:Brain aging is a complex process that depends on the precise regulation of multiple brain regions; however, the underlying molecular mechanisms behind this process remain to be clarified in non-human primates.
Results:Here, we explore non-human primate brain aging using 547 transcriptomes originating from 44 brain areas in rhesus macaques (Macaca mulatta). We show that expression connectivity between pairs of cerebral cortex areas as well as expression symmetry between the left and right hemispheres both decrease after aging. Although the aging mechanisms across different brain areas are largely convergent, changes in gene expression and alternative splicing vary at diverse genes, reinforcing the complex multifactorial basis of aging. Through gene co-expression network analysis, we identify nine modules that exhibit gain of connectivity in the aged brain and uncovered a hub gene, PGLS, underlying brain aging. We further confirm the functional significance of PGLS in mice at the gene transcription, molecular, and behavioral levels.
Conclusions:Taken together, our study provides comprehensive transcriptomes on multiple brain regions in non-human primates and provides novel insights into the molecular mechanism of healthy brain aging.
Keywords:Brain aging, Rhesus macaques, Transcriptome, Multiple brain regions, PGLS
Background
Aging, an intricate and irreversible process, varies sig-nificantly at the individual level, depending on a combin-ation of genetic and environmental factors an individual experiences throughout a lifetime [1–3]. Aging is associ-ated with cognitive decline and memory loss and has been implicated in many neurodegenerative disorders [4–8], thereby posing a major threat to global health. Despite its ubiquity and importance, aging-related alter-ations have mainly been observed by histology and ethol-ogy [9–11], with the underlying molecular mechanisms remaining elusive.
Aging processes are reliant on precise spatiotemporal regulation of the transcriptome, and changes in gene expression have been studied widely in brain aging [12–15]. However, an increasing body of persuasive evidence suggests that aging-related changes depend on the coordination of diversified transcriptional regulation rather than gene expression only [16–20]. One essential mechanism for increasing the spatio-temporal complexity of the transcriptome is
alterna-tive splicing, which generates multiple mRNA
transcripts from a single gene and affects up to 95% of human multi-exon genes [21]. Moreover, the brain expresses more alternative splicing transcripts than any other tissue [21–23], and dysregulation of alterna-tive splicing may affect healthy brain aging [16].
Currently, emerging evidence from human and animal models suggests that brain aging is regulated by the interaction of multiple brain regions [24], which must work together as a network to control this complex
© The Author(s). 2019Open AccessThis article is distributed under the terms of the Creative Commons Attribution 4.0 International License (http://creativecommons.org/licenses/by/4.0/), which permits unrestricted use, distribution, and reproduction in any medium, provided you give appropriate credit to the original author(s) and the source, provide a link to the Creative Commons license, and indicate if changes were made. The Creative Commons Public Domain Dedication waiver (http://creativecommons.org/publicdomain/zero/1.0/) applies to the data made available in this article, unless otherwise stated.
* Correspondence:[email protected];[email protected]
†Ming-Li Li and Shi-Hao Wu contributed equally to this work.
3Key Laboratory of Animal Models and Human Disease Mechanisms of
Chinese Academy of Sciences & Yunnan Province, Kunming Institute of Zoology, Chinese Academy of Sciences, Kunming 650223, Yunnan, China
1State Key Laboratory of Genetic Resources and Evolution, Kunming Institute
of Zoology, Chinese Academy of Sciences, Kunming 650223, Yunnan, China Full list of author information is available at the end of the article
physiological process. Nevertheless, previous research has been limited to only a few brain regions (frontal/pre-frontal cortex) [25–27]. Currently, the lack of a genome-wide transcriptional landscape of multiple brain regions limits our understanding of how spatiotemporal orches-tration of the transcriptome regulates the process of brain aging.
The advent of high-throughput RNA-sequencing
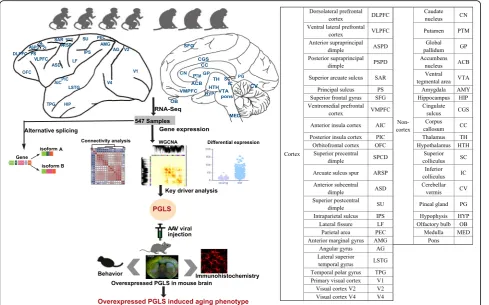
(RNA-seq) has allowed for a much more comprehensive exploration of brain aging. In this study, we sequenced the transcriptomes of 44 brain areas from 4 young and 3
aged rhesus macaques (Macaca mulatta) (Fig. 1), which
are close non-human primate (NHP) relatives of humans (diverging 25 million years ago) [28, 29], to survey tran-scriptional profile alterations during aging. Through multifaceted analyses of RNA-seq data and integration of gene expression and alternative splicing (Fig. 1), we provide several novel insights into the molecular under-pinnings of brain aging. In addition, we discovered a
novel hub gene, PGLS, underlying brain aging and
con-firmed its function at the molecular and phenotypic level in mice.
Results
Transcriptome profiling across multiple brain areas in rhesus macaques
To investigate the dynamic expression patterns associ-ated with brain aging, we used deep RNA-seq to profile transcriptomes from 590 post-mortem samples isolated from 44 brain areas across the left and right hemispheres in 4 young (5, 6, 6, and 6 years old) and 3 aged (16, 17,
and 24 years old) rhesus macaques (Fig. 1). Rhesus
ma-caques reach sexual maturity at 3–4 years and have a typical lifespan of 20 to 30 years in captivity [30]. After
rigorous quality control (see the “Methods” section;
Additional file 1: Figure S1), 547 samples remained for
downstream analyses. RNA-seq data were then normal-ized, and genes with low expression values were re-moved to reduce the influence of technical noise. Consequently, 15,531 (61.8%) out of 25,111 genes were detected as having expression signals (an expressed gene was identified as having least 10 fragments in 80% of samples). There were no significant differences in the
RNA integrity numbers (Mann-WhitneyU (MWU) test,
p= 0.723,N= 547) or post-mortem intervals (MWU test,
[image:2.595.57.547.378.683.2]p= 1,N= 547) between samples originating from young and aged groups (Additional file2: Table S1). Sex, hemi-sphere, brain region, and individual did not explain a significant amount of expression variation. In contrast, most of the variation in gene expression could be attrib-uted to age (p= 0.006; Additional file 2: Table S2), sug-gesting that age contributes more to global differences in gene expression than any of the other tested variables. After accounting for the effects of many known bio-logical and technical confounding factors, we performed principal component analysis (PCA) on gene expression in the 547 samples and found that the cortex and non-cortex clearly clustered into 2 separate groups (Add-itional file1: Figure S2a). Hierarchical clustering analysis based on inter-array correlation also showed distinct clustering of these two groups (Additional file 1: Figure S2b). Thus, for the following, we studied the cortex and non-cortex in the downstream analyses separately.
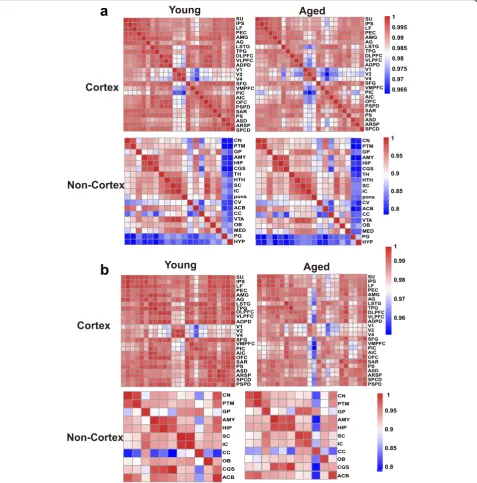
Attenuation of expression connectivity during brain aging in NHPs
To assess the changing tendency of transcriptional con-nectivity among macaque brain regions during aging, we determined the expression correlation between any two brain regions in young and aged groups, respectively. By comparing the correlation matrices at different ages, we found that inter-areal correlations within the cortex de-creased after aging (Pearson’s correlation: p= 2.00e−09, MWU test), with a less dramatic shift seen in the
non-cortex (Pearson’s correlation: p= 0.075, MWU test)
(Fig. 2a). Moreover, pairwise comparisons of gene
ex-pression across all regions of the cortex showed an in-crease in the number of differentially expressed genes
(DEGs) between paired regions during aging (p= 0.009,
MWU test; Additional file1: Figure S3a), but no
signifi-cant change was seen in the non-cortex (p= 0.2, MWU
test; Additional file 1: Figure S3b). Our results suggest that attenuation of expression connectivity occurs in the cerebral cortex during aging. To further validate this ob-servation, we repeated the correlation analysis using an-other public age-matched human transcriptome dataset (12–20 to over 60 years old; sampled brain areas can be seen in Additional file 2: Table S3) [31]. Similarly, the expression connectivity among human brain areas was
substantially decreased in the cortex (p= 1.12e−12,
MWU test) but unchanged in the non-cortex (p= 0.35,
MWU test) after brain aging (Additional file 1: Figure
S4), supporting the robustness of our results and indicat-ing conserved and consistent changes in expression con-nectivity during brain aging in primates.
Additionally, by performing unsupervised hierarchical clustering on the multiple brain areas based on the gene expression signals in the young and aged groups (Additional file1: Figure S5), we found that the relative
relationship between some brain regions was altered during brain aging. For example, the ventromedial pre-frontal cortex (VMPFC) clustered closely with the pos-terior insula cortex (PIC) in young macaques but shifted towards the anterior insula cortex (AIC) and lat-eral superior temporal gyrus (LSTG) in the aged group, suggesting a dynamic reorganization of transcriptional patterns between brain areas during aging.
The brain hemispheres are known to be anatomically
and functionally asymmetric [32, 33]. Thus, to explore
changes in expression connectivity between the left and right hemispheres during aging, we determined the cor-relation matrices of pairwise comparisons between the hemispheres at different ages. Results showed that in the cortex, the correlation coefficient in the young group was significantly higher than that in the aged group (p= 0.00011, MWU test), but unchanged in the non-cortex
(p= 0.7541), suggesting a decreased tendency of
tran-scriptome connectivity between the left and right hemi-spheres in the cortex during aging (Fig.2b).
Transcriptional changes across multiple brain areas during NHP aging
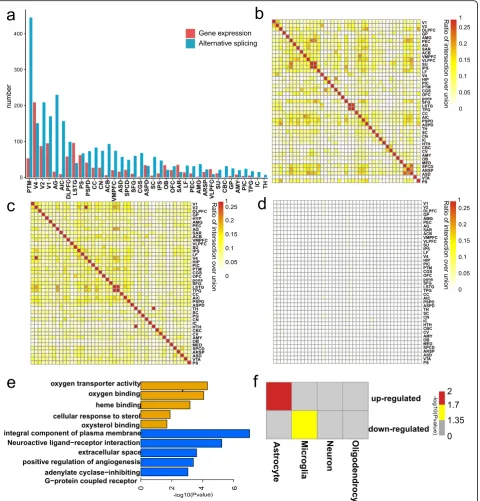
We next investigated the broad patterns of aging-related transcriptome changes in each brain area by integration of gene expression (p< 0.05, fold change [FC] > 1.5) and alternative splicing (p< 0.01). Results showed a positive correlation between the number of DEGs and genes with differential exon usage genes (DEUs) across brain re-gions (Pearson’s r2= 0.39, p= 0.018; Additional file 1: Figure S6). In addition, changes in gene expression and alternative splicing were widespread in all brain regions,
although the changes were not uniform (Fig.3a).
Focus-ing on the 37 brain regions with similar sample sizes, the visual cortex V4 area was the most prioritized region exhibiting changes in gene expression (Fig.3a). In terms of alternative splicing, the putamen (PTM) was the most
pronounced region showing aging-related changes
(Fig. 3a). Although the putamen plays an important role
in cognitive ability [34–36], few studies have focused on its role in brain aging.
A significant overlap of DEGs was found across brain
areas (Fig. 3b; Additional file 2: Table S4), and genes
with DEUs were also widely shared among different brain areas (Fig.3c; Additional file2: Table S5). These find-ings suggest that although the degree of aging-related change across brain areas was diversified (Fig. 3a), aging mechanisms among different brain regions were largely convergent. However, we found a rare overlap between
DEGs and genes with DEUs across brain regions (Fig.3d;
Additional file2: Table S6). Gene enrichment analyses also indicated that DEGs and genes with DEUs were enriched in different categories (Additional file 1: Figure S7). Our
results suggest that gene expression and alternative splicing likely regulate brain aging in distinct manners.
In consideration of the convergent mechanisms among different brain areas during aging described above, we next investigated aging-related gene expression changes in the whole cortex and whole non-cortex. In the cortex, we iden-tified 432 DEGs (157 upregulated, 275 downregulated) (p<
0.05, fold change [FC] > 1.5) accounting for 2.8% (432/15, 220) of all expressed genes. In the non-cortex, we identified 268 DEGs (86 upregulated, 182 downregulated) equating to 1.7% (268/15,531) of expressed genes. The decreased num-ber of DEGs in the non-cortex (p= 6.186e−10, chi-squared test) is consistent with recent functional magnetic reson-ance imaging (fMRI) research, which showed that aging
[image:4.595.60.538.89.573.2]induced more dramatic changes in the cortex than in the non-cortex [37]. However, a highly significant overlap in
DEGs was found between the cortex and non-cortex (p=
1.5e−224, Fisher’s exact test; Additional file 1: Figure S8), corroborating the conclusion that aging-related gene
expression changes are largely convergent among the differ-ent regions.
The NDRG family member 4 (NDRG4) gene,
highlighted in our analysis, is reportedly implicated in Alzheimer’s disease (AD) [38]. Our results showed that
Fig. 3Aging-related transcriptional profile changes.aThe number of genes with evidence of related gene expression (red) and aging-related alternative splicing (blue) changes.bThe overlapping rate of DEGs between any two brain regions (the ratio of intersection over union was used to exhibit the overlapping rate).cThe overlapping rate of genes with DEUs between any two brain regions.dThe overlapping rate of DEUs and genes with DEGs between any two brain regions.eEnriched categories for upregulated (top) and downregulated (bottom) DEGs in aged macaques.fMatrix summary of enrichment in oligodendrocyte, neuron, microglia, endothelial, or astrocyte genes in upregulated and downregulated DEGs of aged macaques
[image:5.595.60.541.88.590.2]the expression level of NDRG4 significantly decreased during aging (1.5-fold change, unpaired t test, p= 9.29e
−07), which agrees with previous studies showing that
NDRG4 mRNA expression is lower in the brains of
pa-tients with AD [39]. We speculate thatNDRG4plays an
important role in regulating brain aging. Another inter-esting gene identified in our analysis was cytochrome c
oxidase III, mitochondrial (MT-CO3), which was
upreg-ulated in the aged brains (2.3-fold change, unpaired t
test, p= 9.53e-39). The main function of this gene is to regulate cytochrome-c oxidase activity and respiratory
electron transfer activity [40]. MT-CO3 has also been
implicated in AD, Huntington’s disease (HD), and
Par-kinson’s disease (PD) [41, 42]; however, no previous
study has reported an association betweenMT-CO3and
brain aging. Our study suggests that MT-CO3 is likely
involved in brain aging.
To further characterize the observed DEG patterns, we examined the enrichment of cell type-associated genes and gene ontologies for the significantly up- and down-regulated genes in the aged group. Genes with
upregu-lated expression were predominantly enriched in
astrocytes (Fig. 3f; Additional file 1: Figure S9). Gene Ontology (GO) enrichment analysis indicated that they were associated with oxygen transporter activity (Fig.3e; Additional file 2: Table S7). In contrast, downregulated genes were enriched in microglia (Fig.3f; Additional file1: Figure S9) and were involved in neuroactive ligand-receptor interaction and angiogenesis pathways (Fig. 3e; Additional file 2: Table S8). The transcriptional patterns of identified DEGs are consistent with previous studies [4,43,44].
Gene co-expression analysis reveals network reorganization in aged brains
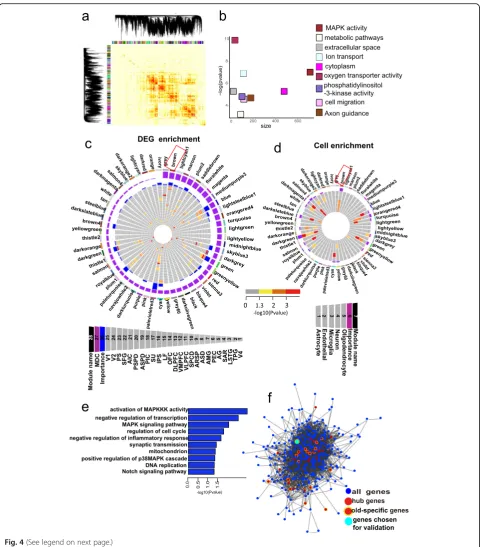
To gain further insight into the molecular mechanisms involved in brain aging, we applied weighted gene co-expression network analysis (WGCNA) to profile the aged-brain transcriptome into a higher order [45–47]. A total of 56 modules ranging in size from 24 to 1844 gene
members were identified (Fig. 4a). Remarkably, we
ob-served significant evidence that 46 of the 56 modules were preserved in an independently published transcrip-tome dataset, which contained frontal cortex expression data from 478 people collected to study aging [25] (Add-itional file 1: Figure S10), thus suggesting robustness of the co-expression networks constructed here.
We next used modular differential connectivity
(MDC), i.e., the ratio of the average connectivity for any pair of module-sharing genes in the aged group com-pared to that for the same genes in the young group, to quantify the network reorganization across young and aged groups [48]. Among the 56 modules, 9 (16.1%) showed gain of connectivity, none showed loss of
connectivity, and 47 (83.9%) showed no change in con-nectivity in the aged group compared to the young
group (Additional file 2: Table S9). The modules
show-ing a gain of connectivity in the aged brain contained di-verse functional categories (Fig. 4b; Additional file 2:
Table S9), including “MAPK activity” (brown, p= 8.82E
−4), “metabolic pathways” (floral white, p= 0.04), “oxy-gen transporter activity” (maroon, p= 4.92E−5), “phos-phatidylinositol-3-kinase activity”(medium purple 3,p=
0.001), “Axon guidance” (saddle brown, p= 0.009), and
“extracellular space” (gray, p= 0.005). Many of these functional categories have previously been implicated in brain aging [49–53], reinforcing the conclusion that complex multifactorial mechanisms underlie brain aging. We ranked the modules based on the degree of DEG enrichment across multiple cortex regions. Of the 56 modules, 34 were enriched in DEGs in at least 1 brain
region (Fig. 4c). The brown module was of particular
interest as it was highly enriched in DEGs across brain regions (Fig. 4c) and showed gain of connectivity in the aged network (Additional file 2: Table S9). Furthermore, genes in the brown module were enriched in microglia cells and astrocytes (Fig.4d). To further explore the pro-file of the brown module, we performed GO enrichment analysis and found that the most prominent functions were related to activity of mitogen-activated protein
ki-nases (MAPKs) (Fig. 4e). MAPKs are serine-threonine
kinases that mediate intracellular signaling and play an important role in regulating aging [54–56], with devi-ation from strict control of the MAPK signaling path-ways implicated in many human neurodegenerative diseases, including AD and PD [57,58].
Further, we reconstructed the network structure of genes within the brown module solely on the basis of their connectivity and identified the so-called hub genes and aged-specific hub genes. Hub genes are genes with the highest degree of connectivity within a module and are expected to control the expression of many other module members [45]. Aged-specific hub genes were found in the aged group, but not in the young group, and thus may be especially important in generating gene co-expression networks unique to senility. We identified 48 hub genes in the brown module, 20 of which were aged-specific hub genes (Fig.4f; Additional file2: Table S10).
Function of hub genePGLSin brain aging
We validated our bioinformatic predictions by focusing
on PGLS, a highly connected aged-specific hub gene
within the brown module and found to be upregulated in the aged macaque brain (p= 0.04), as described in our
DEG analysis above. Upregulation of PGLS in the aged
macaque brain was also confirmed by real-time
Fig. 4(See legend on next page.)
[image:7.595.58.539.85.633.2]Additional file 1: Figure S11). PGLS encodes 6-phosphogluconolactonase, which catalyzes the hydrolysis of 6-phosphogluconolactone in the second step of the pentose phosphate pathway [59]. Although little is
known about the function of PGLS in brain aging, the
pentose phosphate pathway is reported to be broadly in-volved in the aging process [60–62].
PGLS is a conserved gene among mammals and
expressed endogenously in both macaques and mice (Additional file 1: Figure S12) [63, 64]. To address the functional role of higher PGLS levels in brain aging, an engineered adeno-associated virus (AAV) combined with a green fluorescent protein (GFP) tag was used to
over-expressPGLS in the central and peripheral nervous
sys-tems of 6-month-old C57BL/6 J male mice by caudal intravenous injection [65, 66], abbreviated here as AAV-PGLS mice. As a control group, the same AAV vector containing the GFP tag was injected into the remaining mice (Ctrl mice). As expected, both
immunohistochemi-cal and Western blot analyses showed that PGLS was
significantly overexpressed in the whole brain (including the cortex and non-cortex) of AAV-PGLS mice until the
age of 12 months (Fig. 5a–d; Additional file 1: Figure
S13). At the cell level, in addition to microglial cells, both neurons and astrocyte cells were transduced (Add-itional file1: Figure S14).
To examine whether overexpression ofPGLS induced
aging-related behaviors, we tested AAV-PGLS (n= 8)
and Ctrl (n = 8) mice with the Morris water maze (MWM) task. Before AAV injection, there were no sig-nificant differences between the two groups of mice in
the MWM task (6 months old) (Additional file1: Figure
S15). However, 6 months after virus injection, the AAV-PGLS mice (12 months old) displayed an impairment in learning the new platform location during the acquisi-tion phase of the MWM relative to Ctrl mice (12 months
old) (Fig.5e). Memory dysfunction in mice
overexpress-ingPGLSwas also observed during the probe trial.
Com-pared to Ctrl mice, the AAV-PGLS mice spent less time in the target quadrant (p= 0.0078; Fig. 5f) and crossed the platform location less frequently (p= 0.0256; Fig.5g).
The swimming distance to reach the platform location was also longer for AAV-PGLS mice (p= 0.0008; Fig.5h). Thus, the MWM results indicate that overexpression of
PGLSinduced memory impairment.
Additionally, open field tests verified that the distance traveled by AAV-PGLS mice was shorter than that by Ctrl mice (p= 0.037; Fig.5i), suggesting that
overexpres-sion of PGLS also caused impairment in locomotor
ac-tivity [67]. However, compared to the Ctrl, AAV-PGLS mice displayed normal motor coordination and balance with the rotarod test (Additional file1: Figure S16).
As aging usually accompanies a physiological decrease in food intake [68–71], we also tested food intake in the PGLS and Ctrl mice. Results showed that AAV-PGLS mice exhibited decreased food intake and fecal output compared to the Ctrl mice (Fig.5j, k), indicating
that overexpression ofPGLSresulted in decreased
appe-tite, a key indicator of aging [68].
Alterations in astrocyte morphology are an important
hallmark of brain aging [72, 73]. Thus, we investigated
changes in the microscopic morphology of astrocytes
after PGLS overexpression through in vitro and in vivo
tests. When upregulated PGLS astrocyte cell systems
were maintained in culture, they showed a senescence-related feature [74], i.e., an increase in nuclear size (p=
2.2e−16) comparable to that observed in Ctrl cells
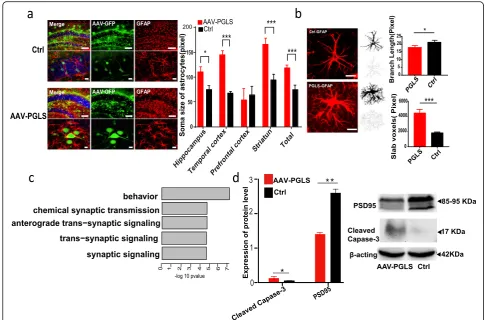
undergoing replicative senescence (Additional file1: Fig-ure S17). We also conducted immunohistochemical mapping of 12-month-old mouse brains to observe the microscopic morphology of astrocytes and found that the soma size of the glial fibrillary acidic protein (GFAP)-positive astrocytes was substantially larger in
AAV-PGLS mice than in Ctrl mice (Fig.6a). In addition,
the astrocytes in AAV-PGLS mice exhibited a stubbier
morphology compared to those in Ctrl mice (Fig. 6b).
Together, the characteristics of AAV-PGLS astrocytes are consistent with their previously reported senescence
phenotype [73, 75], thereby highlighting the
physio-logical relevance ofPGLSin brain aging.
To further investigate the mechanisms linking PGLS
to brain aging, we performed RNA-seq on the brains of
(See figure on previous page.)
Fig. 4Weighted gene co-expression network analysis (WGCNA).aIn total, 56 modules were identified by WGCNA.bSignificant (FETpvalue after correcting for number of modules and functional categories/pathways tested) enrichment of functional categories in modules with gains of connectivity.Y-axis represents–log (pvalue) of enrichment;x-axis denotes number of genes per module.cCircos plots displaying degree of enrichment for DEGs in aged-brain modules. Outermost rectangle is an arbitrary color for module name, followed by MDC score and then by importance (a measure considering degree of enrichment for DEGs across brain regions). Innermost concentric circles represent degree to which DEGs are contained within a given module for each brain region.dCircos plots displaying degree of enrichment for cell types in aged-brain modules. Outermost rectangle is an arbitrary color for module name, followed by importance (a measure considering degree of enrichment for cell types). Innermost concentric circles represent enrichment for genes with fivefold higher expression in oligodendrocyte, neuron, microglia, endothelial, or astrocyte cell types (Zhang et al. [94]) in aged-brain modules.eFunctional enrichment of genes in brown module.fNetwork plot of hub genes identified within brown module. Blue nodes indicate all genes. Red nodes indicate hub genes. Yellow halos indicate aged-specific hub genes. Cyan node indicates genePGLSfor functional validation. Edges reflect significant interactions between genes based on
12-month-old AAV-PGLS and age-matched Ctrl mice. Differential expression analysis identified 73 DEGs in-duced by PGLS overexpression (p< 0.05). Gene enrich-ment analysis indicated that the DEGs were mainly involved in synapse-related pathways (Fig. 6c). Thus, we measured the level of PSD95, a key synaptic protein, in
the brains of Ctrl mice and those overexpressing PGLS.
As expected, Western blot analyses of anti-PSD95 showed a significant decrease in protein levels in the
AAV-PGLS mice compared to the Ctrl mice (p= 0.0094,
Fig. 6d), indicating that PGLS overexpression induced loss of synapses.
Fig. 5Overexpression ofPGLSgene in mice causes aging phenotypes.aImmunostaining of coronal sections of brains from AAV-PGLS and control (Ctrl) mice for GFP (green) and PGLS (red). Scale bars: large = 1 mm, middle = 100μm, and small = 10μm.bFluorescence intensity of PGLS protein detected by anti-PGLS antibody obtained from GFP-positive cells was quantified and averaged (unpairedttest with Welch’s correction: hippocampusp= 0.0002, temporal lobep= 0.022, parietal lobep= 0.0259, striatump= 0.001, occipitalp= 0.0366, prefrontal cortexp= 0.0011, and totalp< 0.0001).cRepresentative immunoblots of PGLS in brains from AAV-PGLS and Ctrl mice at 12 months of age.dProtein expression level of PGLS in brains from AAV-PGLS and Ctrl mice (unpairedttest with Welch’s correction,p= 0.0123).eLatencies (second) during training in Morris water maze of PGLS with Ctrl (n= 8 mice, two-way ANOVA with Bonferroni’s multiple comparison test.).fTime (second) spent in goal quadrant during Morris water maze probe trial (n= 8, unpairedttest with Welch’s correction,t= 3.364,p= 0.0078).gNumber of platform crossings during Morris water maze probe trial (n= 8, unpairedttest,t= 2.497,p= 0.0256).hSwimming distance (cm) to platform during Morris water maze probe trial (n= 8, unpairedttest,t= 4.244,p= 0.0008).iExamples of results obtained from open field test trace image (left). Total distance traveled (n= 8, unpairedttest,t= 2.296,p= 0.0376) in open field test during a 20-min period (right).jCumulative food intake over a 24-h period (n= 8, repeated-measure ANOVA,F= 3.169, ***p< 0.0001,ηp2= 0.303).kTotal excretions (g) in 24 h (n= 8, unpairedttest,t= 2.747,p= 0.0157)
[image:9.595.59.540.87.525.2]Brain aging is also associated with a decrease in the number of cells, with apoptosis reported to be a major factor contributing to the loss of cells with age [76,77]. Thus, we compared the activity of caspase-3, a key ex-ecutor of apoptosis [77], in AAV-PGLS and Ctrl mice. Western blot analysis showed that cleaved caspase-3 ac-tivity was significantly increased after PGLS overexpres-sion (p= 0.0383, Fig. 6d), indicating that overexpression
of PGLS induced elevated rates of apoptosis, thus
con-forming to the characteristics of brain aging.
Discussion
We applied large-scale RNA-seq on multiple areas of the macaque brain to uncover novel molecular mechanisms and biomarkers related to aging in NHPs. Our results should deepen our understanding of the process of brain aging.
Based on comparison of gene expression profiles be-tween young and old macaques, we found a decreased
tendency of expression correlation among multiple brain areas after aging. Furthermore, combined with previous conclusions that expression correlations between major brain areas increase during human early brain develop-ment [28], we hypothesized that connectivity within the
brain exhibits a “mountain-like” pattern across a
life-span, i.e., connectivity first increases during early brain development and then decreases with aging. In addition, the changes of expression profile after aging would re-veal to some extent declines of brain functions, e.g., cog-nitive function. For example, it is well known that multiple brain areas must work together to accomplish complex cognitive functions [76]. Our results indicated that the connectivity between brain regions decreased after aging, which was consistent with loss of cognitive function in the process of brain aging.
We also found that changes in gene expression and al-ternative splicing were widespread across all brain areas, although variability existed in the number of genes that
Fig. 6Molecular functional study ofPGLS.aSoma size of GFAP-positive astrocytes was substantially larger in AAV-PGLS mice than in control (Ctrl) mice in most brain regions (unpaired test or unpairedttest with Welch’s correction: hippocampusp= 0.0158, temporal cortexp< 0.0001, prefrontal cortexp= 0.7358, stratump= 0.0008, and totalp= 0.001; scale bars: large = 100μm and small = 10μm).bExample photomicrograph of fluorescent IHC and cropped cell with skeletonized image. AAV-PGLS group (n= 10 cells) had significantly shorter branch length and more slab voxels than AAV-control group (n= 10 cells) (branch length: unpairedttest with Welch’s correctiont= 2.709,p= 0.019; slab voxels: unpairedttest with Welch’s correctiont= 5.17,p= 0.0004).cFunctional enrichment of differentially expressed genes after overexpression ofPGLS.d
[image:10.595.54.540.87.407.2]changed with age in the different brain regions, thus suggesting that the degree of aging in different brain areas may differ. However, despite this, the aging mech-anism among different brain regions was largely conver-gent. Additionally, we found that different forms of transcription regulation (e.g., gene expression and alter-native splicing) acted on brain aging in distinct manners, thereby reinforcing the complex multifactorial basis underlying the aging process.
Among the 44 brain regions analyzed, the putamen was highlighted as showing dramatic transcriptional changes during aging. However, few studies have focused on this region previously. The putamen is located at the base of the forebrain and together with the caudate nucleus forms the dorsal striatum [78]. Furthermore, it is reported to play an important role in cognitive functions, including learning, decision making, and motor behaviors [79–81], and is implicated in various neurological diseases, such as PD, AD, and HD [35,78]. Our results suggest that the pu-tamen should receive greater attention in future research, diagnosis, and treatment of brain aging. In addition to the putamen, other brain regions account for special functions and tasks, like learning, memory, and language. The large-scale transcriptome data obtained from the multiple brain regions in this study should provide insight into the func-tional changes that occur after aging for different regions based on changes in expression profiles.
Prior studies on the transcriptional mechanisms of brain aging have focused primarily on identifying individ-ual candidate genes or profiling whole transcriptomes within single brain regions in isolation. In the present study, we applied a network-based approach to reveal inter-regional co-regulation gene signatures associated with brain aging, and identified multiple modules showing increased connectively in the aged brain. These modules were enriched in a number of different pathways, highlighting the intricate mechanisms underlying brain aging. By analyzing the key driver genes within these mod-ules, we provided compelling evidence to supportPGLSas
a key hub gene in brain aging. Upregulation of PGLSin
mice resulted in impaired memory and locomotor activity, as well as decreased food intake. In addition, the morph-ology of astrocytes exhibited a senescent phenotype after
PGLSoverexpression. We found that the consequence of
PGLSoverexpression in brain aging is likely through
syn-apse loss. We propose thatPGLSshould be regarded as a
novel biomarker of brain aging in future research. We
confirmed the function ofPGLSin mice; however, future
experiments onPGLSin primates are necessary to further confirm the functions of this gene.
Conclusions
This study provides novel insight into the molecular mech-anism of healthy brain aging based on a comprehensive
transcriptome map across multiple brain regions and con-firmed a novel gene (PGLS) related to brain aging in mice, which will be an important resource to the neuroscientific community.
Methods
Sample preparation
The brains of four young (5, 6, 6, and 6 years old) and three aged (16, 17, and 24 years old) rhesus ma-caques with no previously reported neuropsychiatric disorders were obtained from the Kunming Primate Research Center, Chinese Academy of Sciences(AAA-LAC accredited).
According to a widely used macaque brain atlas (http://www.brainmaps.org), tissues spanning 44 ana-tomically distinct regions were selected and collected by a skilled technician with over a decade of experience, and he is also an operator of brain dissection in another studies [82,83]. We applied a list of previously published gene markers specific to human brain regions to validate the accuracy of the brain dissection [84] (Additional file1: Figure S18). Brain dissection of the seven macaques was performed from fresh specimens by the same person to ensure consistency in sampling between specimens. Sur-gical instruments were sterilized in advance, and surSur-gical scissors and tweezers were only used one time for each sample to avoid cross-contamination. Only the central portion of each brain region was sampled. Each sample consisted of 100 mg of dissected tissue. All collected samples were washed with RNAlater solution (AM7021, Ambion, USA) and placed in freezing tubes for storage at liquid nitrogen temperature.
Total RNA was extracted using an RNeasy Plus Universal Kit (Qiagen). Quality and quantity measure-ments of the extracted RNA were performed using NanoDrop (Thermo Fisher Scientific) and a Qubit Fluorometer (Thermo Fisher Scientific), respectively, and RNA Integrity Numbers (RIN) were determined using a Bioanalyzer RNA 6000 Nano Kit (Agilent, USA). All procedures were approved by the Institu-tional Animal Care and Use Committee (IACUC) at the Kunming Institute of Zoology (approval number: SMKX2017021).
RNA-sequencing
A paired-end sequencing library was constructed from poly (A)+RNA, as described in the Illumina manual, and sequenced on the Illumina Hiseq 2000 sequencing plat-form. For each sample, 5 G of data were generated by RNA-seq. Sequencing data were deposited in the Gen-ome Sequence Archive database (http://gsa.big.ac.cn/) under accession ID CRA000336 for 590 transcriptomes in the macaque brain.
Read alignment and quality control
We acquired 590 transcriptomes across 44 brain regions from 4 young and 3 aged macaques. First, quality control (QC) of RNA was performed based on the RIN (see Additional file2: Table S1), with 1 sample excluded after
failing our cutoff of RIN≤5. We next use Btrim64 to
trim reads to obtain high-quality reads [85]. The paired-end reads were mapped to the macaque
refer-ence genome using Tophat2 [86]. The rmdup
com-mand in Samtools was used to remove PCR
duplication of bam files [87], with the SortSam
com-mand in PicardTools (http://broadinstitute.github.io/ picard/) then used to sort bam files.
After read alignment, QC analysis was performed
using PicardTools v1.100 (commands ReorderSam,
Col-lectAlignmnetSummaryMetrics, CollectRnaSeqMetrics,
CollectGcBiasMetrics). Sequencing metrics were used to remove samples with poor sequence quality based on the following sequencing metrics: %Total Reads, %High-quality Aligned Reads, %mRNA Bases, %Intergenic
Bases, Median 5′to 3′Bias, GC Dropout, and AT
drop-out (Additional file 2: Table S1). To detect outliers, a quality z-score was calculated for each metric, and sam-ples with low quality (Z > 2 for %Intergenic Bases, GC
Dropout, or AT Dropout and Z <−2 for %Total Reads,
%High-quality Aligned Reads, %mRNA Bases, or Median 5′ to 3′ Bias) in this matrix were identified as outlier values, and any sample with greater than one outlier value was removed due to sequencing quality concerns. QC analysis was performed for the 590 initial samples, with 43 samples (7%) thus removed. The remaining 547 samples were used for downstream analysis (Additional file 1: Table S1).
Quantification and adjustment of gene expression
Gene expression levels were quantified for samples passing QC using HTSeq (v.0.6.1) [88]. Genes were retained if expressed in 80% of samples, with HTSeq quantification of 10 counts (thus removing genes sup-ported by only a few reads) within all cortex and non-cortex samples separately. We used cqn software to adjust GC content according to the GC content
re-sults from the CollectGcBiasMetrics command in
PicardTools as well as sequencing depth according to read length [89].
After that, we adjusted the data for covariates, including sex, batch, and sequencing quality metrics (Additional file2: Table S1). Given the large number of sequencing quality features, we performed principal component analysis (PCA) on these data and found that the first two PCs on the unstandardized features explained nearly 99% of the variance. Consequently, we opted to use two se-quencing surrogate variables (seqSV1 and seqSV2) as
covariates. We applied a linear model to remove the confounding factors:
adjusted value¼original value−batch beta:batch−sex beta:sex−seqSV1 beta:seqSV1−seqSV1 beta:seqSV2:
Gene clustering analysis
Based on the expression values, PCA from the prcomp R package (https://www.r-project.org/) was used to visualize the relatedness of all 547 RNA-seq samples. We also used agglomerative hierarchical clustering in the flashClust R package [90] to perform clustering analysis.
Transcriptional connectivity analysis in young and aged macaques
Pairwise Pearson and Spearman correlation coefficients of gene expression values between any two brain regions and between the left and right hemispheres were calcu-lated in the young and aged macaques using R (https:// www.r-project.org/). The Mann-WhitneyU(MWU) test was used to compute the statistical significance of the
correlations between young and aged groups. TheMWU
test was executed using the R functionwilcox.test(), the
command correct = TRUE was used to adjust p values,
and a continuity correction was applied to the normal approximation for thepvalue.
DEG analysis between young and aged macaques
Pairwise differential expression between the young and aged macaques was investigated with the DESeq2 R package [91]. A nominal significance threshold of p< 0.05 and fold change (FC) > 1.5 was used to identify
DEGs. The p value was adjusted for multiple testing
using Benjamini-Hochberg to estimate the false
discov-ery rate (FDR). Two online resources were utilized, i.e.,
DAVID (https://david.ncifcrf.gov/) and g:Profiler
(https://biit.cs.ut.ee/gprofiler/), to assess the enrichment of functional categories (GO and KEGG) of the DEGs [92, 93]. The p value was adjusted for multiple testing
using Benjamini-Hochberg to estimate the false
Alternative splicing analysis in multiple brain regions during aging
The DEXSeq R-package [95] was used to test for
differ-ential exon usage (DEU) with default parameters. Thep
value significance level was set to 0.01 for detecting sig-nificant DEUs and was adjusted for multiple testing
usingBenjamini-Hochbergto estimate the FDR.
Construction of gene co-expression modules for aged brains
We used the aged macaque gene expression data to con-struct multi-tissue co-expression networks that simul-taneously captured intra- and inter-tissue gene-gene
interactions [45, 48]. Before identifying co-expressed
gene modules, we used the linear regression model to correct the effect of brain region covariates on expres-sion values. To quantify the differences in transcription network organization between the young and aged sam-ples, we employed modular differential connectivity
(MDC) metrics [48, 96]. In brief, MDC represents the
ratios of the connectivity of all gene pairs in a module from the aged samples to that of the same gene pairs from the young samples, with MDC > 0 indicating a gain of connectivity or enhanced co-regulation between genes in aged samples, and MDC < 0 indicating a loss of con-nectivity or reduced co-regulation between genes in the aged group. As a result, among the 56 aged modules, 9 showed gain of connectivity, none showed loss of con-nectivity, and 47 showed no change in connectivity com-pared to the young group.
To identify key regulator (driver) genes in the brown module, we applied key driver analysis to the module-based unweighted co-expression networks derived from ARACNE [97]. ARACNE first identified significant inter-actions between genes in the brown module based on their mutual information and then removed indirect in-teractions through data processing inequality (DPI). For each ARACNE-derived unweighted network, we further identified key regulators by examining the number ofN -hop neighborhood nodes (NHNN) for each gene.
Cell culture
Astrocytes were obtained from fetal C57BL/6 mice (em-bryonic day 18). We first used 75% alcohol to disinfect the mice for 5 min, with the mice then euthanized using cervical dislocation. Each brain was removed and placed in pre-cooled phosphate buffer solution (PBS), and the cerebral cortex was separated under an anatomic micro-scope and placed in DMEM/F12 medium. The cerebral cortex was then cut into pieces, after which 3 ml of 0.125% trypsin containing EDTA was added and digested at 37 °C for 8 min. Digestion was terminated with serum DMEM/F12. We then used 100-mesh cell filters to filter the tissue into a new centrifuge tube.
Samples were centrifuged at 1000 rpm for 5 min, after which the supernatant was removed. Cells were sus-pended with serum DMEM/F12 (2% FBS + 1% PS + 1%
star cell growth factor) and inoculated in 75 cm2 cell
vials pretreated with PDL at a dose of 1 × 10⁶/ml. The cell suspension was placed in an incubator at 37 °C with 5% CO2. Culture medium was changed every 2–3 days. We identified astrocytes by microscope by their star shape, cobblestone mosaic arrangement, contact inhib-ition, and good light transmittance.
The day before infection, cells were plated in a 96-well plate at a cell density of 4 × 10⁴/well. Virus was added at a density of 1 × 10⁸TU/ml and gently shaken in the “+” direction to evenly distribute the virus on the cell sur-faces. The plate was then returned to the incubator for further incubation. After 24 h of virus infection, the cell culture medium was changed. We measured the infec-tion efficiency of the virus by green fluorescence after 3 days.
Mice
Sixteen male mice (c57-B6) were used in this study. The mice were group-housed (5–6 mice per cage) in an air conditioning-regulated environment (22–24 °C). Mice were kept in a 12-h light/dark cycle with ad libitum access to food and water. We started the experiment when the mice were 6 months old. All animal care and experimental protocols were approved by the Institutional Animal Care and Use Committee (IACUC) at the Kunming Institute of Zoology (approval number: SMKX2018021), Chinese Academy of Sciences.
AAV injection
We injected AAV-CAG-PGLS-GFP vectors (serotype
PHP.eb and titer = 4.17 × 10¹²vg/ml) with hybrid
CMV-chicken β-actin (CAG) promotor into AAV-PGLS mice
(number = 8, age 6 months), and AAV-CAG-GFP vectors (serotype PHP.eb and titer = 8.2 × 10¹² vg/ml) with
hy-brid CMV-chicken β-actin (CAG) promotor into Ctrl
mice (number = 8, age 6 months), with each mouse
injected with 4 × 10¹¹ vg viral vectors. The number of
GFP-positive cells showed no significant differences
be-tween AAV-PGLS and Ctrl mice (p= 0.1783), indicating
similar virus expression efficiency in the two groups.
Differential expression analysis of brains in AAV-PGLS and Ctrl mice
Brains from 2 AAV-PGLS mice (13 samples) and 2 Ctrl mice (11 samples) were used to extract RNA and RNA-seq as per the above method. The RNA-sequencing data were deposited in the Genome Sequence Archive database (http://gsa.big.ac.cn/) under accession ID CRA001751. The DESeq2 R package was used to identify DEGs [91], with a nominal significance threshold of p< 0.05. The
p value was adjusted for multiple testing using Benjamini-Hochberg to estimate the FDR. We used g: Profiler (https://biit.cs.ut.ee/gprofiler/) to assess the enrichment of functional categories of DEGs.
Western blot analysis
Brain tissue protein extracts were prepared with RIPA lysis buffer containing both protease and phosphatase inhibitors. Equal amounts of brain tissue lysates (80μg) were loaded onto 12% sodium dodecyl sulfate (SDS)-polyacrylamide gel electrophoresis (PAGE) gels and transferred onto polyviny-lidene difluoride (PVDF) membranes. After the membranes were blocked, they were incubated with monoclonal anti-bodies against PGLS (1:2000, Abcam), PSD95 (1:500, Abcam), and Caspase-3 (1:2000, Cell Signaling Technology) followed by incubation with HRP-Rb-anti-goat (1:2000, Beyotime) andβ-actin (1:2000, Beyotime) followed by incu-bation with HRP-goat-anti-mouse (1:2000, Beyotime). Tar-get proteins were detected by the ECL system (Millipore, Braunschweig, Germany) and visualized with the Chemi-Doc XRS system (Bio-Rad, Hercules, CA, USA).
Immunohistochemistry
After perfusion with PBS, the brains were removed and post-fixed in 4% paraformaldehyde at 4 °C overnight. Brain sections (40μm) were cut with a vibrating blade microtome (Leica VT1000 S, Germany). Sections were washed for 1 h in PBS containing 5% bovine serum albumin (BSA) and 0.3% Triton X-100 and incubated with primary antibodies of anti-GFP (Invitrogen, 1:800), anti-Aβ40-42 (1:400; Milli-pore), anti-PGLS (1:200 NAVOUS), anti-GFAP (1:800 Cell Signaling), and anti-NeuN (1:800; Abcam) in PBS with 1% BSA and 0.3% Triton X-100 overnight at 4 °C, followed by incubation with corresponding secondary Cy3- and Cy2-conjugated antibodies (1:800; Jackson Lab) for 2 h at room temperature. Confocal z-stack images were acquired on a Nikon A1 confocal laser microscope system (Japan). Image J was used to count cell numbers, analyze fluorescence in-tensity of immunoreactive cells, and quantify GFAP morph-ology according to previous protocols [98]. Cell counts in the hippocampus, prefrontal lobe, temporal lobe, striatum, occipital lobe, and parietal lobe were performed in three randomly selected sections from each animal.
Open field test
Experiments were performed between 16:00 pm and 18: 00 pm. A Plexiglas box (27 × 27 × 20.3 cm, ENV 510) equipped with infrared beams and activity monitor (Med Associates, USA) was used in this test. To minimize background stress, mice were transported to the testing room 1 h prior to testing. After that, mice were placed at a fixed position in the chamber at the start of the assay and allowed to freely explore the chamber. The
locomotor activity was monitored and recorded in the last 20-min period (previous 10 min for habituation).
Morris water maze test
As previously described [99], mice were tested in a Morris water maze (120 cm diameter, 60 cm high), which was filled with water (22 °C) containing non-toxic titanium pigment to obscure the submerged platform (10 cm in diameter). Before training, all mice were adapted to the pool without a platform for 2 days (1 min/day). After that, mice were trained to find the hid-den platform using distal extra maze cues. Mice were given four trials per day (60 s/trial with an inter-trial interval of 40 s). Each mouse was placed in the water with its head facing the pool wall, and the start point varied semi-randomly between trials. If the mouse did not find the submerged platform at the end of the trail, it was led to the platform by the experimenter, where it then remained for 15 s. Training was performed for five consecutive days, and latency to the platform was evalu-ated using the EthoVision 8.0 program (Noldus). The probe test (platform removed) was conducted for 1 min on day 6. The time spent in the four quadrants, number of platform crossings, and distance to platform were recorded.
Rotarod test
Test mice were habituated to the testing room for 1 h. During the acceleration phase, mice were placed on the rotating rod (Panlab Harvard, Spain) with a 4-rpm con-stant speed for 10 s, with the apparatus then accelerated from 4 to 40 rpm in 5 min and the latency to fall recorded. Each mouse was tested three times with 40-min intervals.
Metabolic test
Quantities of food intake were assessed by a metabolic cage (Panlab Harvard, Spain). Mice were individually placed in single cages and allowed free access to water and food during a 24-h period. Food intake was recorded and calculated by monitoring software (Panlab Harvard) each hour automatically. Feces in each metabolic cage were collected for weighing after the 24-h period, and body weight was measured manually.
Statistical analyses
Data analysis was conducted using SPSS v19.0 (SPSS, Chi-cago, IL, USA) and GraphPad Prism v7.00 (GraphPad
Software, La Jolla, CA, USA) in Windows. TheFtest was
used to compare variances (p> 0.05), and normality was analyzed by the Shapiro-Wilk normality test (p> 0.05). All data acquisition and analysis were performed in a double-blind manner. Comparisons between two groups were
conducted by unpaired t tests with Welch’s correction
unpaired-sample t tests (normally distributed and equal variances), or Mann-Whitney tests (non-normally distrib-uted). Repeated-measure analysis of variance (ANOVA) was used for inter-group analysis. All data were expressed as means ± SEM, *p< 0.05, **p< 0.01, and ***p< 0.001.
Supplementary information
Supplementary informationaccompanies this paper athttps://doi.org/10. 1186/s13059-019-1866-1.
Additional file 1.Supplementary Figures S1–S18.
Additional file 2.Supplementary Tables S1–S10.
Additional file 3.Review history.
Acknowledgements
We thank Guolan Ma from the Public Technology Service Center, Kunming Institute of Zoology, Chinese Academy of Sciences, for technical support. Peer review information: Yixin Yao was the primary editor on this article and managed its editorial process and peer review in collaboration with the rest of the editorial team.
Review history
The review history is available as Additional file3.
Authors’contributions
DDW and XT designed and led the project. MLL and YS performed the data analysis. SHW, JJZ, HYT, and ZL performed the functional assays ofPGLS. ZBW dissected the brain tissues. MLL, SHW, DDW, LJL, and DMI prepared the manuscript. All authors read and approved the manuscript.
Funding
This work was supported by the Strategic Priority Research Program of the Chinese Academy of Sciences (grant no. XDB13020600, XDB32060200), National Natural Science Foundation of China (31671325, 31822048), CAS Light of West China Program, and Animal Branch of the Germplasm Bank of Wild Species, Chinese Academy of Sciences (Large Research Infrastructure Funding).
Availability of data and materials
The raw RNA-seq data from the 590 samples of macaque brain were deposited into the Genome Sequence Archive database under accession ID CRA000336 (http://bigd.big.ac.cn/search?dbId=gsa&q=CRA000336) [100] and the NCBI Se-quence Read Archive under bioproject ID PRJNA578504 [101] (https://www.ncbi. nlm.nih.gov/bioproject/PRJNA578504). The raw RNA-seq data ofPGLS overexpres-sion in mouse brains were deposited into Genome Sequence Archive database under accession ID CRA001751 (http://bigd.big.ac.cn/search?dbId=gsa&q=CRA001 751) [102] and the NCBI Sequence Read Archive under bioproject ID
PRJNA578197 [103] (https://www.ncbi.nlm.nih.gov/bioproject/PRJNA578197).
Ethics approval and consent to participate
Sampling procedures of 7 macaques were approved by the Institutional Animal Care and Use Committee (IACUC) at the Kunming Institute of Zoology (approval number: SMKX2017021). PGLS validation on 16 mice was approved by the Institutional Animal Care and Use Committee (IACUC) at the Kunming Institute of Zoology (approval number: SMKX2018021).
Consent for publication Not applicable
Competing interests
The authors declare that they have no competing interests.
Author details
1
State Key Laboratory of Genetic Resources and Evolution, Kunming Institute of Zoology, Chinese Academy of Sciences, Kunming 650223, Yunnan, China.
2Kunming College of Life Science, University of the Chinese Academy of
Sciences, Kunming 650223, Yunnan, China.3Key Laboratory of Animal Models
and Human Disease Mechanisms of Chinese Academy of Sciences & Yunnan Province, Kunming Institute of Zoology, Chinese Academy of Sciences, Kunming 650223, Yunnan, China.4Yunnan Key Laboratory of Primate
Biomedicine Research, Institute of Primate Translational Medicine, Kunming University of Science and Technology, Kunming 650500, Yunnan, China.
5Department of Laboratory Medicine and Pathobiology, University of
Toronto, Toronto, ON, Canada.6Center for Excellence in Brain Science and
Intelligence Technology, Chinese Academy of Sciences, Shanghai 200031, China.7National Research Facility for Phenotypic and Genetic Analysis of
Model Animals, Kunming Institute of Zoology, Chinese Academy of Sciences, Kunming 650223, Yunnan, China.8Center for Excellence in Animal Evolution
and Genetics, Chinese Academy of Sciences, Kunming 650223, Yunnan, China.
Received: 17 July 2019 Accepted: 26 October 2019
References
1. Koivisto K, Reinikainen KJ, Hanninen T, Vanhanen M, Helkala EL, Mykkanen L, Laakso M, Pyorala K, Riekkinen PJ. Prevalence of age-associated memory impairment in a randomly selected population from eastern Finland. Neurology. 1995;45:741.
2. Montesanto A, Dato S, Bellizzi D, Rose G, Passarino G. Epidemiological, genetic and epigenetic aspects of the research on healthy ageing and longevity. Immun Ageing. 2012;9:6.
3. Raz N, Lindenberger U, Rodrigue KM, Kennedy KM, Head D, Williamson A, Dahle C, Gerstorf D, Acker JD. Regional brain changes in aging healthy adults: general trends, individual differences and modifiers. Cereb Cortex. 2005;15:1676–89.
4. Haddadi M, Jahromi SR, Sagar BKC, Patil RK, Shivanandappa T, Ramesh SR. Brain aging, memory impairment and oxidative stress: a study in Drosophila melanogaster. Behav Brain Res. 2014;259:60–9.
5. Mariani E, Polidori MC, Cherubini A, Mecocci P. Oxidative stress in brain aging, neurodegenerative and vascular diseases: an overview. J Chromatogr B. 2005;827:65–75.
6. Raz N. Aging of the brain and its impact on cognitive performance: integration of structural and functional findings. In: The handbook of aging and cognition. 2nd ed. Mahwah: Lawrence Erlbaum Associates Publishers; 2000. p. 1–90.
7. Kern A, Behl C. The unsolved relationship of brain aging and late-onset Alzheimer disease. Biochim Biophys Acta Gen Subj. 2009;1790:1124–32. 8. Bender A, Krishnan KJ, Morris CM, Taylor GA, Reeve AK, Perry RH, Jaros E,
Hersheson JS, Betts J, Klopstock T, et al. High levels of mitochondrial DNA deletions in substantia nigra neurons in aging and Parkinson disease. Nat Genet. 2006;38:515.
9. Greicius MD, Srivastava G, Reiss AL, Menon V. Default-mode network activity distinguishes Alzheimer’s disease from healthy aging: evidence from functional MRI. Proc Natl Acad Sci U S A. 2004;101:4637.
10. Bowman GL, Silbert LC, Howieson D, Dodge HH, Traber MG, Frei B, Kaye JA, Shannon J, Quinn JF. Nutrient biomarker patterns, cognitive function, and MRI measures of brain aging. Neurology. 2011.https://doi.org/10.1212/WNL. 0b013e3182436598.
11. Seshadri S, DeStefano AL, Au R, Massaro JM, Beiser AS, Kelly-Hayes M, Kase CS, D'Agostino RB, DeCarli C, Atwood LD, Wolf PA. Genetic correlates of brain aging on MRI and cognitive test measures: a genome-wide association and linkage analysis in the Framingham study. BMC Med Genet. 2007;8:S15.
12. Berchtold NC, Cribbs DH, Coleman PD, Rogers J, Head E, Kim R, Beach T, Miller C, Troncoso J, Trojanowski JQ, et al. Gene expression changes in the course of normal brain aging are sexually dimorphic. Proc Natl Acad Sci U S A. 2008;105:15605–10.
13. Fraser HB, Khaitovich P, Plotkin JB, Pääbo S, Eisen MB. Gene expression in the aging brain. PLoS Biol. 2005;3:e313.
14. de Magalhaes JP, Curado J, Church GM. Meta-analysis of age-related gene expression profiles identifies common signatures of aging. Bioinformatics. 2009;25:875–81.
15. Fraser HB, Khaitovich P, Plotkin JB, Pääbo S, Eisen MB. Aging and gene expression in the primate brain. PLoS Biol. 2005;3:e274.
16. Tollervey JR, Wang Z, Hortobágyi T, Witten JT, Zarnack K, Kayikci M, Clark TA, Schweitzer AC, Rot G, Curk T, et al. Analysis of alternative splicing associated
with aging and neurodegeneration in the human brain. Genome Res. 2011; 21:1572–82.
17. Raj T, Li YI, Wong G, Humphrey J, Wang M, Ramdhani S, Wang YC, Ng B, Gupta I, Haroutunian V, et al. Integrative transcriptome analyses of the aging brain implicate altered splicing in Alzheimer’s disease susceptibility. Nat Genet. 2018;50:1584–92
18. Mazin P, Xiong J, Liu X, Yan Z, Zhang X, Li M, He L, Somel M, Yuan Y, Phoebe Chen YP, et al. Widespread splicing changes in human brain development and aging. Mol Syst Biol. 2013;9:633.
19. Wei S, Hua H-R, Chen Q-Q, Zhang Y, Chen F, Li S-Q, Li F, Li J-L. Dynamic changes in DNA demethylation in the tree shrew (Tupaia belangeri chinensis) brain during postnatal development and aging. Zool Res. 2017; 38:96–102.
20. Ye L-Q, Zhao H, Zhou H-J, Ren X-D, Liu L-L, Otecko NO, Wang Z-b, Yang M-M, Zeng L, Hu X-T, et al. The RNA editome of Macaca mulatta and functional characterization of RNA editing in mitochondria. Sci Bull. 2017;62:820–30. 21. Pan Q, Shai O, Lee LJ, Frey BJ, Blencowe BJ. Deep surveying of alternative
splicing complexity in the human transcriptome by high-throughput sequencing. Nat Genet. 2008;40:1413.
22. Johnson JM, Castle J, Garrett-Engele P, Kan Z, Loerch PM, Armour CD, Santos R, Schadt EE, Stoughton R, Shoemaker DD. Genome-wide survey of human alternative pre-mRNA splicing with exon junction microarrays. Science. 2003;302:2141.
23. Yeo G, Holste D, Kreiman G, Burge CB. Variation in alternative splicing across human tissues. Genome Biol. 2004;5:R74.
24. Berchtold NC, Coleman PD, Cribbs DH, Rogers J, Gillen DL, Cotman CW. Synaptic genes are extensively downregulated across multiple brain regions in normal human aging and Alzheimer’s disease. Neurobiol Aging. 2013;34: 1653–61.
25. Mostafavi S, Gaiteri C, Sullivan SE, White CC, Tasaki S, Xu J, Taga M, Klein HU, Patrick E, Komashko V, et al. A molecular network of the aging human brain provides insights into the pathology and cognitive decline of Alzheimer’s disease. Nat Neurosci. 2018;21:811–9.
26. Naumova OY, Palejev D, Vlasova NV, Lee M, Rychkov SY, Babich ON, MV F, Grigorenko EL. Age-related changes of gene expression in the neocortex: preliminary data on RNA-Seq of the transcriptome in three functionally distinct cortical areas. Dev Psychopathol. 2012;24:1427–42.
27. Somel M, Guo S, Fu N, Yan Z, Hu HY, Xu Y, Yuan Y, Ning Z, Hu Y, Menzel C, et al. MicroRNA, mRNA, and protein expression link development and aging in human and macaque brain. Genome Res. 2010;20:1207–18.
28. Gibbs RA, Rogers J, Katze MG, Bumgarner R, Weinstock GM, Mardis ER, Remington KA, Strausberg RL, Venter JC, Wilson RK, et al. Evolutionary and biomedical insights from the rhesus macaque genome. Science. 2007;316:222. 29. Mei-Ling Zhang, M-LLAOARWMD-DWYS: Conserved sequences identify the
closest living relatives of primates. Zool Res 2019, 40:532–540.
30. Gabow S. The macaques. Studies in ecology, behavior and evolution. Edited by Donald G. Lindburg. Van Nostrand Reinhold, New York. 1980. xiv + 384 pp., figures, tables, references, indices. $29.25 (cloth). Am J Phys Anthropol. 1982;57:132–3.
31. Kang HJ, Kawasawa YI, Cheng F, Zhu Y, Xu X, Li M, Sousa AMM, Pletikos M, Meyer KA, Sedmak G, et al. Spatio-temporal transcriptome of the human brain. Nature. 2011;478:483–9.
32. Toga AW, Thompson PM. Mapping brain asymmetry. Nat Rev Neurosci. 2003;4:37.
33. Geschwind N, Galaburda AM. Cerebral lateralization: biological mechanisms, associations, and pathology: i. a hypothesis and a program for research. Arch Neurol. 1985;42:428–59.
34. Grahn JA, Parkinson JA, Owen AM. The cognitive functions of the caudate nucleus. Prog Neurobiol. 2008;86:141–55.
35. de Jong LW, van der Hiele K, Veer IM, Houwing JJ, Westendorp RG, Bollen EL, de Bruin PW, Middelkoop HA, van Buchem MA, van der Grond J. Strongly reduced volumes of putamen and thalamus in Alzheimer’s disease: an MRI study. Brain. 2008;131:3277–85.
36. Naydenov AV, Vassoler F, Luksik AS, Kaczmarska J, Konradi C. Mitochondrial abnormalities in the putamen in Parkinson’s disease dyskinesia. Acta Neuropathol. 2010;120:623–31.
37. Giorgio A, Santelli L, Tomassini V, Bosnell R, Smith S, De Stefano N, Johansen-Berg H. Age-related changes in grey and white matter structure throughout adulthood. Neuroimage. 2010;51:943–51.
38. Zhou R-H, Kokame K, Tsukamoto Y, Yutani C, Kato H, Miyata T. Characterization of the human NDRG gene family: a newly identified
member, NDRG4, is specifically expressed in brain and heart. Genomics. 2001;73:86–97.
39. Yamamoto H, Kokame K, Okuda T, Nakajo Y, Yanamoto H, Miyata T. NDRG4 protein-deficient mice exhibit spatial learning deficits and vulnerabilities to cerebral ischemia. J Biol Chem. 2011;286:26158–65.
40. Wu C, Yan L, Depre C, Dhar SK, Shen Y-T, Sadoshima J, Vatner SF, Vatner DE. Cytochrome c oxidase III as a mechanism for apoptosis in heart failure following myocardial infarction. Am J Physiol Cell Physiol. 2009;297:C928–34.
41. Lunnon K, Keohane A, Pidsley R, Newhouse S, Riddoch-Contreras J, Thubron EB, Devall M, Soininen H, Kłoszewska I, Mecocci P, et al. Mitochondrial genes are altered in blood early in Alzheimer’s disease. Neurobiol Aging. 2017;53: 36–47.
42. Yang J-L, Weissman L, Bohr VA, Mattson MP. Mitochondrial DNA damage and repair in neurodegenerative disorders. DNA Repair. 2008;7:1110–20. 43. Higami Y, Shimokawa I. Apoptosis in the aging process. Cell Tissue Res.
2000;301:125–32.
44. Soreq L, Consortium UKBE, North American Brain Expression C, Rose J, Soreq E, Hardy J, Trabzuni D, Cookson MR, Smith C, Ryten M, et al. Major shifts in glial regional identity are a transcriptional hallmark of human brain aging. Cell Rep. 2017;18:557–70.
45. Langfelder P, Horvath S. WGCNA: an R package for weighted correlation network analysis. BMC Bioinformatics. 2008;9:559.
46. Parikshak NN, Luo R, Zhang A, Won H, Lowe JK, Chandran V, Horvath S, Geschwind DH. Integrative functional genomic analyses implicate specific molecular pathways and circuits in autism. Cell. 2013;155:1008–21. 47. Bagot RC, Cates HM, Purushothaman I, Lorsch ZS, Walker DM, Wang J,
Huang X, Schluter OM, Maze I, Pena CJ, et al. Circuit-wide transcriptional profiling reveals brain region-specific gene networks regulating depression susceptibility. Neuron. 2016;90:969–83.
48. Zhang B, Gaiteri C, Bodea LG, Wang Z, McElwee J, Podtelezhnikov AA, Zhang C, Xie T, Tran L, Dobrin R, et al. Integrated systems approach identifies genetic nodes and networks in late-onset Alzheimer’s disease. Cell. 2013;153:707–20. 49. Rice KM, Kinnard RS, Harris R, Wright GL, Blough ER. Effects of aging on
pressure-induced MAPK activation in the rat aorta. Pflugers Arch. 2005;450:192–9. 50. Ivanisevic J, Stauch KL, Petrascheck M, Benton HP, Epstein AA, Fang M,
Gorantla S, Tran M, Hoang L, Kurczy ME, et al. Metabolic drift in the aging brain. Aging. 2016;8:1000–20.
51. Heras-Sandoval D, Avila-Muñoz E, Arias C. The phosphatidylinositol 3-kinase/ mTor pathway as a therapeutic target for brain aging and
neurodegeneration. Pharmaceuticals. 2011;4:1070–87.
52. Lipinski MM, Zheng B, Lu T, Yan Z, Py BF, Ng A, Xavier RJ, Li C, Yankner BA, Scherzer CR, Yuan J. Genome-wide analysis reveals mechanisms modulating autophagy in normal brain aging and in Alzheimer’s disease. Proc Natl Acad Sci. 2010;107:14164.
53. Smith JA, Leonardi T, Huang B, Iraci N, Vega B, Pluchino S. Extracellular vesicles and their synthetic analogues in aging and age-associated brain diseases. Biogerontology. 2015;16:147–85.
54. Johnson GL, Lapadat R. Mitogen-activated protein kinase pathways mediated by ERK, JNK, and p38 protein kinases. Science. 2002;298:1911. 55. Wada T, Penninger JM. Mitogen-activated protein kinases in apoptosis
regulation. Oncogene. 2004;23:2838.
56. Xu Y, Li N, Xiang R, Sun P. Emerging roles of the p38 MAPK and PI3K/AKT/ mTOR pathways in oncogene-induced senescence. Trends Biochem Sci. 2014;39:268–76.
57. Sweatt JD. Mitogen-activated protein kinases in synaptic plasticity and memory. Curr Opin Neurobiol. 2004;14:311–7.
58. Munoz L, Ammit AJ. Targeting p38 MAPK pathway for the treatment of Alzheimer’s disease. Neuropharmacology. 2010;58:561–8.
59. Miclet E, Stoven V, Michels PA, Opperdoes FR, Lallemand JY, Duffieux F. NMR spectroscopic analysis of the first two steps of the pentose-phosphate pathway elucidates the role of 6-phosphogluconolactonase. J Biol Chem. 2001;276:34840–6.
60. Baquer NZ, Hothersal JS, McLean P. Function and regulation of the pentose phosphate pathway in brain. Curr Top Cell Regul. 1988;29:265–89. 61. Vicente-Gutierrez C, Bonora N, Bobo-Jimenez V, Jimenez-Blasco D,
Lopez-Fabuel I, Fernandez E, Josephine C, Bonvento G, Enriquez JA, Almeida A, Bolaños JP. Astrocytic mitochondrial ROS modulate brain metabolism and mouse behaviour. Nat Metab. 2019;1:201–11.