Volume 63 Number 6254 DOI: 10.22444/IBVS.6254
Konkoly Observatory Budapest
14 September 2018 HU ISSN 0374 – 0676
THE VARIABLE CARBON STAR CGCS 6107
NESCI, R.1
; CALABRESI, M.2
; ROSSI, C.3
; OCHNER, P.4
1
INAF/IAPS, via Fosso del Cavaliere 100, 00133 Roma, Italy, e-mail: [email protected]
2
Frasso Sabino Observatory, MPC 157, Italy
3
INAF/OAR, Monteporzio, Italy
4
INAF/OAPD Asiago, and Universit´a di Padova, Italy
Abstract
The spectroscopic and photometric variability of CGCS 6107 has been studied with four telescopes from 2015 to 2018. The star varied between R=11.4 and 14.2 mag with a time scale of ∼500 days.
An appreciable color variation was observed, the star being bluer when brighter. Hαemission was present around maxima. The spectrum is that of an N type giant veiled by a variable dusty envelope.
1
Introduction
Carbon stars on the Asymptotic Giant Branch (AGB) are supposed to be in the last phase of stellar evolution after the Third Dredge-Up and before the ejection of the planetary nebula. Given their evolutionary status they are expected to be variable.
Out of the 6891 stars listed in the Catalog of Galactic Carbon Stars (CGCS, Alksnis et al. 2001), 851 are reported as variables in the General Catalog of Variable stars (GCVS, Samus et al. 2017, CDS B/gcvs): 385 of them have also a period or variability time-scale reported, but only 150 are classified as Miras. The VSX catalog (Watson et al. 2016), updated more frequently, reports much more (1985) variables among the CGCS stars, 957 of them with a quoted period, but only 270 are classified as Miras or likely Miras: it appears therefore that only a minority of the AGB carbon stars are Mira variables.
Automatic surveys with robotic telescopes, dedicated to the detection of transient sources (Supernovae, Gamma Ray Bursts, Near Earth Asteroids, etc.) in large sky areas, contain large amounts of data which can significantly improve our knowledge in this topic: given that this is not the main goal of the science teams operating these telescopes, these large databases are still partially unexplored from this aspect.
2
CGCS 6107
The star (05:49:32.31 +46:35:57.9, J2000) is a very bright infrared source detected by IRAS, at low galactic latitude in the Auriga constellation (b = 9.68◦). Its IRAS-LRS
spectrum is classified F (Kwok et al. 1997) suggestive of a late spectral type M or C with small amount of circumstellar dust.
It was spectroscopically observed in the optical by Cohen et al. (1996) and classified as C-,4, with a significant Hα emission. It is listed in the CGCS but without any indication of variability. It is not covered by the Sloan DR141.
The star is present in the main infrared catalogs: 2MASS (Cutri et al., 2003), WISE, (Cutri et al. 2013), and AKARI (Ishihara et al. 2010). The 2MASS J−H;H−K colors of the star are J −H = 2.10, H−K = 1.67 mag, so it is located well inside the region of the moderately obscured carbon stars, even when small color changes are taken into account, but is not included in the catalog of Infrared Carbon Stars by Chen and Yang (2012).
Only in 2015 the star was pointed out as variable by the Japanese amateur astronomer Shigehisa Fujikawa (2015): spectra taken 3 days after discovery by Munari (2015) with the 122 cm telescope of the Asiago (Pennar) Observatory showed a carbon star spectrum and confirmed the presence of Hα emission.
At the time of writing, the star is listed as variable in the VSX catalog but the vari-ability amplitude is simply given by an upper limit.
3
Photometric observations and calibrations
Soon after Fujikawa’s announcement, we started a photometric monitoring of CGCS 6107 with 3 telescopes: the 152 cm of Loiano (Bologna Observatory), the 37 cm of Frasso Sabino (IAU 157) and the 30 cm of Foligno Observatory (IAU K56). The Loiano and Frasso Sabino telescopes were equipped with CCD cameras and Bessell BVRI filters; the Foligno telescope was equipped with a commercial digital camera (DSLR, Nikon D90 up to 2018 and red extended Canon 550D camera afterwards). Loiano and Frasso Sabino provided good quality photometry in a few nights, Foligno allowed a denser monitoring with lower accuracy.
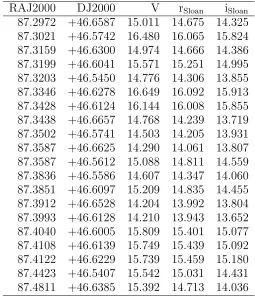
Twenty stars included in the field of view of all the involved telescopes were selected from the UCAC4 catalog to define a comparison sequence, and are listed in Table 1. Aperture photometry was performed using IRAF/apphot2with radius equal to the average
FWHM of each image.
The UCAC4 catalog gives magnitudes in the rSloan and iSloanbands, which are somewhat
different from the Bessell’s ones, and our star is quite red (R − I ∼ 2), therefore a systematic color term is expected: however there were no stars of comparable colors in the field of view so that we could not compute reliable corrections. We feel this is not critical for the aim of this paper, devoted just to the study of the light curve and of possible color changes of the star, and not to a comparison with theoretical stellar atmosphere models. A linear fit between instrumental and catalog magnitudes provided the calibration curve to evaluate the magnitude of the variable. The slope of the line was always very close to 1.0, as expected for an ideal linear detector. The rms deviation of the comparison stars magnitudes with respect to the fitting line was adopted as true photometric uncertainty of the variable star magnitude. Given the non-standard color separation provided by the
1
http://www.sdss.org/dr14/
2
Table 1: Comparison sequence for CGCS 6107. RAJ2000 DJ2000 V rSloan iSloan
87.2972 +46.6587 15.011 14.675 14.325 87.3021 +46.5742 16.480 16.065 15.824 87.3159 +46.6300 14.974 14.666 14.386 87.3199 +46.6041 15.571 15.251 14.995 87.3203 +46.5450 14.776 14.306 13.855 87.3346 +46.6278 16.649 16.092 15.913 87.3428 +46.6124 16.144 16.008 15.855 87.3438 +46.6657 14.768 14.239 13.719 87.3502 +46.5741 14.503 14.205 13.931 87.3587 +46.6625 14.290 14.061 13.807 87.3587 +46.5612 15.088 14.811 14.559 87.3836 +46.5586 14.607 14.347 14.060 87.3851 +46.6097 15.209 14.835 14.455 87.3912 +46.6528 14.204 13.992 13.804 87.3993 +46.6128 14.210 13.943 13.652 87.4040 +46.6005 15.809 15.401 15.077 87.4108 +46.6139 15.749 15.439 15.092 87.4122 +46.6229 15.739 15.459 15.180 87.4423 +46.5407 15.542 15.031 14.431 87.4811 +46.6385 15.392 14.713 14.036
DSLR cameras of Foligno, we performed a few nearly simultaneous observations with the Frasso Sabino telescope to establish proper systematic corrections for theV andR bands. The V and rSloan magnitudes of our star were always inside, or shortly outside, the
range of the comparison stars, while the iSloan magnitudes were always well outside the
range, so these values are extrapolated and less reliable.
4
Light curve
Our photometric data in the V and rSloan bands are reported in Table 2: column 1 is
JD−2,400,000, columns 2, 3, 4 and 5 are magnitudes with their errors, column 6 is the instrument used, coded as follows (FR= Frasso Sabino; EK= Cima Ekar; LO= Loiano; NI= Foligno with Nikon D90; CA= Foligno with Canon 550D). Magnitudes fainter than V ∼16 could not be measured with the 30cm telescope.
A light curve of our star starting from 2014-01-19 can be recovered from the ASAS-SN database (Shappee et al. (2014); Kochanek et al. (2017)3, which became public only in
2018. These data are taken with an unfiltered FLI CCD camera and tied to Johnson’sV -band using the APASS 9 catalog. Below V ∼16, these V magnitudes have uncertainties of several tenths, due to the short exposure times used by the survey.
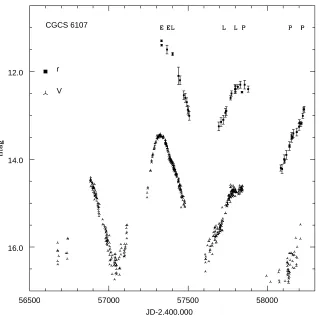
Fig. 1 reports the ASAS-SN light curve (stars) and our rSloan light curve (squares) on
a common magnitude scale, showing a very good agreement of the overall shape in the common time interval. The source is characterised by very large variations (>2.5 mag), with a time scale (peak to peak distance) of about 500 days: the variation amplitude is not
3
Table 2: Observed magnitudes of CGCS 6107 (all telescopes).
JD V err V r err r tel
57332 13.54 0.02 11.30 0.02 FR 57367 13.98 0.06 11.70 0.10 NI 57402 14.12 0.06 11.60 0.04 LO 57439 14.56 0.05 12.40 0.20 NI 57449 14.69 0.08 12.50 0.10 NI 57473 15.04 0.06 12.67 0.10 NI 57482 15.12 0.08 12.98 0.10 NI 57492 15.18 0.08 12.80 0.10 NI 57498 15.40 0.10 13.20 0.10 NI 57503 15.40 0.05 13.10 0.10 NI 57507 15.51 0.12 13.20 0.10 NI 57694 15.44 0.04 13.24 0.10 NI 57708 15.35 0.08 13.15 0.10 NI 57735 15.04 0.07 12.85 0.10 NI 57741 15.00 0.07 12.80 0.10 NI 57768 14.89 0.06 12.70 0.05 NI 57774 14.79 0.04 12.67 0.06 NI 57796 14.73 0.04 12.62 0.10 NI 57799 14.73 0.03 12.81 0.09 NI 57799 14.78 0.04 12.40 0.06 LO 57814 14.75 0.04 12.68 0.05 NI 57829 14.70 0.04 12.59 0.08 NI 57840 14.75 0.02 12.47 0.02 FO 57857 14.63 0.06 12.51 0.10 NI 57879 14.70 0.10 12.71 0.07 NI
58085 —– —– 14.21 0.07 NI
58093 —– —– 14.22 0.10 NI
58106 —– —– 14.03 0.10 NI
58109 17.05 0.15 14.03 0.04 FR
58120 —– —– 13.90 0.10 NI
58139 —– —– 13.70 0.10 NI
58141 16.57 0.03 13.70 0.03 FR
58153 —– —– 13.48 0.08 NI
58159 16.32 0.02 13.50 0.03 FR
58164 —– —– 13.41 0.09 CA
58186 —– —– 13.38 0.09 CA
58200 —– —– 13.26 0.08 CA
58202 —– —– 13.17 0.07 CA
constant, suggesting a classification of Semi Regular rather than of Mira type variability. As mentioned in the Introduction, only a small fraction of the AGB carbon stars shows a regular Mira type light curve, so our finding is not unusual. Similar large amplitude variations, superimposed on longer term trends in the light curve, have been reported also for other carbon stars with strong infrared excess recently studied by our group (see e.g. Gaudenzi et al. 2017; Nesci et al. 2018).
56500 57000 57500 58000 16.0
14.0 12.0
JD-2,400,000 CGCS 6107
[image:5.595.136.455.198.513.2]V r
Figure 1. The light curve of CGCS 6107 from our observations in the r band, (squares with error bars) and the ASAS-SN light curve in the V band (stars). Vertical scale in magnitudes. The letters in the
upper side mark the dates of the spectroscopic observations listed in Table 5: E=Ekar, L=Loiano, P=Pennar.
An FFT analysis with Period04 (Lenz and Breger 2005) of the ASAS-SN light curve shows a main peak at 543 days, blended with its (fainter) alias at 1083 days; a further peak at 201 days has a low power and is of limited importance in the light curve fit. The period of 543 days is fully compatible with our dataset.
Despite that the star is a semiregular rather than a Mira, we show in Fig. 2 the optical light curve folded with the formal 543 days period. The substantial scatter around phase 0 is mainly due to the variable amplitude of the light curve, as apparent from Fig. 1.
Color indices (V −r) and (r−i) of the star were measured at different flux levels and are collected in Table 3: the star appears markedly redder when fainter.
0 0.2 0.4 0.6 0.8 1 17
16 15 14 13
phase
[image:6.595.144.454.127.447.2]P=543 days
Figure 2. Phased optical light curve of CGCS 6107 from ASAS-SN data folded with the 543 day period.
Table 3: Color indices of CGCS 6107.
Telescope date rSloan V −rSloan r−iSloan
Frasso Sabino 2015-11-06 11.30 2.24 1.89
Loiano 2016-01-15 11.61 2.50 1.95
Loiano 2016-11-29 12.89 2.60 2.01
Loiano 2017-02-14 12.40 2.38
—-Frasso Sabino 2017-03-27 12.47 2.28 2.10 Frasso Sabino 2017-12-22 14.04 3.14 2.44 Frasso Sabino 2018-01-23 13.70 2.86 2.37 Frasso Sabino 2018-02-10 13.50 2.82 2.31 Frasso Sabino 2018-04-06 13.18 2.71 2.24
[image:6.595.145.455.578.743.2]Table 4: Observed magnitudes of CGCS 6107 (all telescopes).
Emulsion band date mag
103a-E r 1952-12-21 12.6 QuickV V 1983-01-14 16.4
IIIaF r 1989-10-05 16.4
IIIaF r 1989-10-29 16.2
IV-N i 1996-11-03 12.2
IV-N i 1999-10-13 12.3
from the Space Telescope Science Institute, using our comparison sequence. The calibra-tion curve was markedly non linear, so we could not measure the B magnitude with our UCAC4 sequence because well outside the range. The results for theV, rSloan, iSloan filters
are collected in Table 4 and confirm the variability of the star in the past.
In the infrared the star was observed for 3 years (from 1990-02-09 to 1993-04-15) with weekly sampling by the DIRBE instrument (Smith et al. 2004; Price et al. 2010) on board the COBE satellite, in the 3.6 µm and 4.9 µm bands. The star was not classified as variable in the DIRBE catalog (Price et al. 2010) according to the strict criteria adopted, but an eye inspection of the data suggested a possible variability. B.J. Smith kindly confirmed to us that no contamination by nearby sources was present for this star, so we made an independent analysis of the published data and we built the light curves at 3.5 and 4.9 µm applying a running mean of 5 consecutive measures: the result is shown in Fig. 3.
A peak-to-peak amplitude of about 1.3 mag is evident, with a time scale of about 500 days, similar to the optical one. The amplitude is similar to that measured for the ‘bona fide’ variables of similar periods in the Price et al. (2010) catalog.
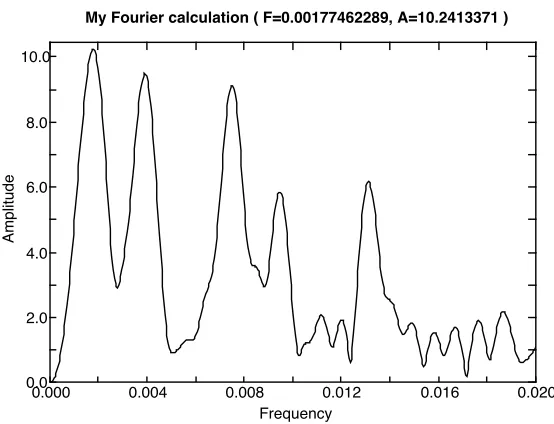
A deeper analysis of the IR light curves in each band and of the averaged (3.5 and 4.9 µm) fluxes with the FFT technique shows several peaks in the power spectrum with comparable intensities and significantly different phases: for the averaged curve the peaks are around 558, 254, 133, 105, and 76 days (see Fig.4). The presence of so many peaks with similar power suggests a rather noisy pattern in the light curve: actually a single period is quite inadequate to reproduce its overall shape. The actual variability range and time scale are therefore ill-defined from these data. We recall that CGCS 6107 is near the detection limit of the DIRBE instrument, and some details of the light curve might be of instrumental origin. In the spectral energy distribution, the average DIRBE fluxes fit well between the 2MASS (1.25, 1.65, and 2.2 µm) and the AKARI (9 and 18µm) values.
5
Spectroscopic observations
8000 8500 9000 0
20 40 60
[image:8.595.169.430.106.372.2]JD-2440000.
Figure 3. The light curve of CGCS 6107 at 3.5 and 4.9µm from the DIRBE data after a 5-point running mean. Error bars are the rms deviation form the mean of the averaged points. We remark that
these errors are quite large and of very different size in different years. The 4.9µm data seem of better quality.
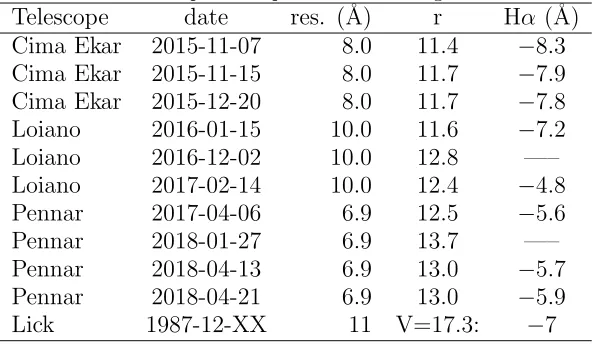
[image:8.595.160.437.494.706.2]variability of the continuum and typical errors are about 0.3 ˚A. In the last row we report the data relative to the observation by Cohen et al. (1996) taken with the 100 cm Lick reflector. This spectrum was taken in December 1987 and showed Hα in emission: from the published plot we derived an approximate equivalent width of 7 ˚A, comparable to our measures.
The dates of our spectroscopic observations are also marked in the bottom of Fig. 1 to better put them in the context of the stellar light-curve.
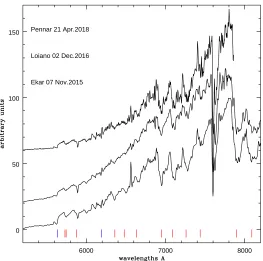
Characteristic spectra at different epochs are reported in Fig. 5. All the spectra are typical of an N type giant, moderately obscured by dust in the circumstellar envelope, with the blue region strongly underexposed.
6000 7000 8000
0 50 100 150
[image:9.595.165.428.251.512.2]Ekar 07 Nov.2015 Loiano 02 Dec.2016 Pennar 21 Apr.2018
Figure 5. Optical spectra of CGCS 6107 at different dates and luminosities. The y axis represents relative intensities corrected for the atmospheric extinction. The spectra are normalised at 7800 ˚A. The
main molecular bandheads are color-coded: blue = C2; red = CN. The telluric bands of O2 and H2O
molecules, overlapped to the CN red system, have not been removed. The spectra are vertically shifted to each other for ease of comparison. From bottom to top: 2015-11-07 (r∼11.4), 2016-12-02 (r∼12.8),
2018-04-21 (r∼13.0).
Red-ward of 5000 ˚A the molecular absorption bands of C2 (Swan) and the red system
of CN can be easily identified4. The 6260 ˚A of the C
13N14 is clearly visible in the bright
states; the two absorptions of atomic lines of K at 7665, 7699 ˚A are always visible. The 5889-5895 ˚A NaD absorption is possibly produced in the circumstellar envelope. The Balmer Hα emission line is also recorded with different intensities in different epochs.
Spectral changes are correlated with the optical flux: the continuum and the strength of Hα and of the absorption bands are always affected by the veiling effect, mainly during
4
most notablyλλ5636, 6122 and 6192 ˚A of C2; 5730, 5746, 5878, 6013, 6206, 6360, 6478, 6631, 6925, 7088, 7259, 7437,
Table 5: Spectroscopic observations logbook.
Telescope date res. (˚A) r Hα (˚A)
Cima Ekar 2015-11-07 8.0 11.4 −8.3
Cima Ekar 2015-11-15 8.0 11.7 −7.9
Cima Ekar 2015-12-20 8.0 11.7 −7.8
Loiano 2016-01-15 10.0 11.6 −7.2
Loiano 2016-12-02 10.0 12.8 —–
Loiano 2017-02-14 10.0 12.4 −4.8
Pennar 2017-04-06 6.9 12.5 −5.6
Pennar 2018-01-27 6.9 13.7 —–
Pennar 2018-04-13 6.9 13.0 −5.7
Pennar 2018-04-21 6.9 13.0 −5.9
Lick 1987-12-XX 11 V=17.3: −7
faint photometric phases. Hα emission was present at the end of 2015, the beginning of our monitoring, when the star was in bright state; it was not present one year later, during a faint state; again the emission was present near the next maximum, disappeared again when faint and rose again during the more recent brightening. In the fainter states (December 2016 and January 2018) the depth of the molecular absorption bands was also reduced, while the equivalent width of the NaD lines in absorption did not vary significantly.
6
Conclusions
We have found that the variability of the carbon star CGCS 6107 is compatible with a quasi regular periodicity on a time scale of about 543 days; the star may be classified as a SR variable because its average magnitude in each cycle is not constant. Historic observations from DSS plates also show large variability.
A definite change of the color indices (V −r) and (r−i) was detected, with the source being bluer when brighter. The Hαline was in emission during maxima while disappeared in the fainter parts of the light curve: this is not unusual among AGB carbon stars. Overall the photometric and spectroscopic properties are similar to those of other variable carbon stars also studied by our group, like BIS 036 (HP Cam) or BIS 184 (Gaudenzi et al. 2017). The absolute K magnitude of CGCS 6107 may be estimated from the relation (White-lock et al. 2012):
M(K) =−3.69×(logP −2.38)−7.18(±0.37)
which yieldsM(K) =−8.35: this gives an estimated distance of 4.9 kpc, with a probable range 5.8-4.2 kpc. The total galactic absorption in theK band in the direction of the star is 0.13, much less than the uncertainty on the actual average K magnitude of the star, given its variability.
Acknowledgements: We thank the Padova and Bologna Observatories for the time alloca-tions. This work has made use of the VIZIER, SIMBAD, IRSA, VSX, ASAS-SN, STScI and Gaia DR2 databases.
References:
Alksnis, A., Balklavs, A., Dzervitis, U., et al., 2001,Baltic Astronomy,10, 1 Bessell, M.S., Brett, J.M. 1988, PASP, 100, 1134 DOI
Chen, P.S. and Yang, X.H., 2012, AJ, 143, 36 DOI
Cohen, M, Wainscoat, R.J., Walker, H.J., Volk, K., 1996, AJ, 111, 1333 DOI Cutri, R.M., Skrutskie, M.F., vanDyk, S., et al., 2003, CDS on-line catalog, II/246 Cutri R.M., et al. 2013, W ISE All-Sky Data Release, IPAC/Caltech; VizieR On-line
Data Catalog: II/328
Fujikawa, S., 2015, IAU CBAT, TCP J05493243+4636023 Gaia collaboration, 2018, A&A, 616, A1 DOI
Gaudenzi, S., Nesci, R., Rossi, C., et al., 2017,Rev. Mex. A&A, 53, 507
Ishihara, D., Onaka, T., Kataza, H., et al. 2010, A&A, 514, A1 DOI; AKARI/IRC Mid-Infrared All-Sky Survey; Vizier On-line Data Catalog II/297
Kochanek, C.S., Shappee, J.L., Stanek, K.Z., et al., 2017, PASP, 129, 4502 DOI Kwok, S., Volk, K., Bidelman, W.P., 1997, ApJS, 112, 557 DOI
Lenz P. and Breger M., 2005,CoAst, 146, 53
Munari, U., 2015,IAU CBAT, TCP J05493243+4636023
Nesci, R., Rossi, C., Tuvikene, T., et al. 2018,Rev. Mex. A&A,54, 341 Price, S.D., Smith, B.J., Kuchar, T.A., et al. 2010, ApJS, 190, 203 DOI
Samus, N.N., Kazarovets, E.V., Durlevich, O.V., et al., 2017, GCVS v5.1, CDS Vizier catalog, B/gcvs
Shappee, B.J., Prieto, J.L., Grupe, D., et al., 2014, ApJ,788, 48 DOI Smith, B.J., Price, S.D., Baker, R.I., 2004, ApJS, 154, 673 DOI
Watson, C., Henden, A. A., Price, A. 2016, AAVSO International Variable Star Index VSX, yCat, 102027
Whitelock, P.A., 2012, Ap&SS, 341, 123 DOI