Project Experts’ Evaluation Study Based on Analytic Hierarchy Process
H.H. Goh, H.T. Yeo, B.C.Kok, , S.W.Lee *
, K.C.Goh**
*Department of Electrical Power Engineering, Faculty of Electrical and Electronic Engineering, Universiti Tun Hussein Onn Malaysia,86400 Parit Raja, Batu Pahat, Johor, Malaysia.
**Department of Construction and Real Estate Management , Faculty of Technology Management, Business and Entrepreneur, Universiti Tun Hussein Onn Malaysia,86400 Parit Raja, Batu Pahat, Johor, Malaysia.
Abstract—To assure justice and fair of scientific and technological project evaluation, avoiding
the corrupt transaction in the process of project evaluation, it is necessary to evaluate the experts’
performance with a scientific method. The main criteria such as publications, patents and awards,
international effects, domestic effects, social effects and etc that affect the project evaluation
were analyzed. In order to avoid the effect of individual expert subjective judgment and
favouritism on the project evaluation, analytic hierarchy process (AHP) is introduced. AHP is
widely used in comparing the options in order to achieve the goal. For the application of AHP in
project evaluation, the 1 Malaysia values such as the culture of excellence, endurance, humility,
acceptance, loyalty, meritocracy and integrity are chosen to be the criteria. This paper presents
the theory of the alternative method to evaluate the scientific and technological project. The
study provides a scientific and reliable method of the project experts’ evaluation.
Keywords: Analytic Hierarchy Process (AHP), 1 Malaysia, Scientific and technological project
selection, TOPSIS
1. Introduction
Current research on technology strategy focuses on the content and type of technology
planning, and the relationship between technology strategy and other strategies; fewer studies
include the implementation of technology strategy at execution level, and the integration
between macro- and micro- level factors and existing technological capabilities. A good
technology strategy can guide enterprises’ to choose the right development projects with external
requirements and internal constraints.
The concept of 1Malaysia aspires to strengthen relationships among races and ensures
Malaysians to understand and practise things that place national interest as priority. Our prime
values such as integrity, ability, dedication and etc. The values can be implemented in scientific
and technological projects’ evaluation.
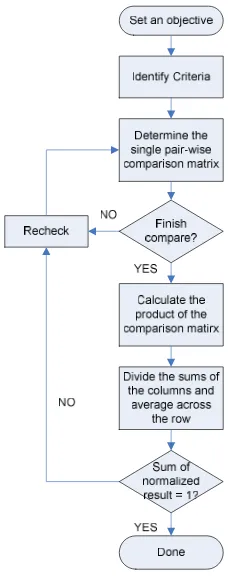
2. AHP Method
AHP, also known as the Analytical Hierarchy Process is multiple criteria decision making
method which was put forward by Prof T. L. Saaty of Pittsburgh University in 1970s [1]. The
general idea in the AHP method is to make the pair wise comparisons, both of the alternatives
with respect to the criteria (scoring), and criteria to estimate the criteria weights (weighting) [2].
AHP technique acts as a decision maker systematically evaluating several data or elements by
comparing one and another at the same time. It judges the elements relative meaning and
importance based on the numerical values process by this technique. The numerical value
represented the weight or priority of each elements of the hierarchy.
According to Cheng and Li [3], there were two basic applications where one is assign
weights to a set of predetermined elements and make a decision out of several scenarios or
alternatives, while the second one is to prioritize the elements in order to identify the key
elements. In the end of the calculation, the approximate weight vector of the elements can be
Figure 1: Flowchart of the AHP solution procedure
3. TOPSIS Method
TOPSIS is known as the “Technique for Order Preference by Similarity to Ideal Solution”.
This method is a unique technique to identify the ranking of all alternatives considered. In the
TOPSIS method, the decision making matrix and weight vector are determined as crisp values
and a positive ideal solution (PIS) and a negative ideal solution (NIS) are obtained from the
decision matrix [4]. In another word, PIS is a set of best value of criteria while NIS is a set of
worst values achievable of criteria. This method is applied to make wide-ranging evaluation of
samples where it measured the distances between index value vector of each sample and ideal
solution along with the negative ideal solution of the comprehensive evaluation [5].
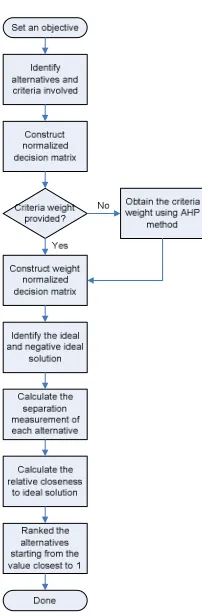
The TOPSIS method can be expressed in series of steps as listed below.
1) Identifying the alternatives over criteria involved to form a decision matrix.
,for i = 1, …, m; j = 1, …, n (1)
3) Constructing a set of weight normalized decision matrix with criteria weight, wj provided.
4) Identifying the ideal alternatives and negative ideal alternatives.
Ideal solution.
PIS= {v1*, …, vn*}, where *
J
V = {max(vij)if j∈J;min(vij)if j∈J' } (2)
Negative ideal solution.
NIS= {v1', …, vn'}, where V'= {min( )
ij
v if j∈J;max(vij)if j∈J' } (3)
5) Calculate the separation measurement of each alternative in si for ideal solution and sni
for negative ideal solution.
6) Calculate the relative closeness to ideal solution using the eq. (4)
i i
i
s sn
sn RATIO
+
= (4)
7) Ranked the alternatives starting from the value that closest to 1.
The iteration solution procedure is summarized in a flowchart in Figure 2.
∑
=
) ( 2ij
ij ij
Figure 2: Flowchart of TOPSIS solution procedure
Hwang and Yon [6] are the first who introduce the TOPSIS method. Hwang and Yon
describe multiple decisions making as follows: multiple decision making is applied to preferable
decision (such as assessment making priority and choice) between available classified
alternatives over the multiple attributes or criteria. It assumes that each criterion require to be
maximized or minimized. Therefore, the ideal positive and negative values of each criterion are
identified, and each alternative judge against this information.
It is note that, in this typical multiple criteria decision making (MCDM) approaches, weights
of attributes reflect the relative importance indecision making process. Each evaluation of
criteria entails diverse opinions and meanings. Hence assumption that each evaluation criterion is
equally importance is prohibited. [7].
TOPSIS method consists of two artificial alternatives hypothesis which are ‘Ideal
attributes considered while the ‘Negative Ideal Alternative’ represented the worst attributes
value. With these two hypotheses, sets of calculations using eigenvector, square rooting and
summations to obtain a relative closeness value of the criteria tested. These values of relative
closeness, TOPSIS ranked the whole system by selecting the highest value of the relative
closeness as the best attributes in the system.
4. Numerical Example
From the scientific and technological project selection, international effects and social effects
are the two criteria involved in the selection. Out of the values listed in 1 Malaysia concept listed,
six values are selected, which are the culture of excellence, endurance, humility, acceptance,
meritocracy and integrity as the sample in this paper. These six areas were determined based on
their estimated weightage, the usage of the values in particular scientific and technological area,
and the important of the values to the whole selection process. As discuss in previous, all values
that are chosen shall be those values that have higher international effects and social effects, and
projects which were less important to the international effects and the social effects that can be
rejected. Besides that, theoretically, after applying the TOPSIS method onto the selection scheme,
the projects that shall be selected would be the projects that having higher international effects
and higher social effects during the operations.
Figure 3 below shows an example of data obtained from a scientific and technological project.
It consists of value, international effects and social effects which attribute to the project selection.
The value was defined as the alternatives while the international effects and the social effects
taken as the attribute or criteria in TOPSIS method for calculations. Below shows a set of
selection data for load shedding purposes.
Alternative International effects Social effects
the culture of excellence a1=0.6 a2=1.088
endurance b1=27.4 b2=28.83
humility c1=1.3 c2=2.328
acceptance d1=21.5 d2=22.63
integrity f1=20.6 f2=50.4
Figure 3: Selection Data for Project Evaluation Purpose
Step1:
Identify the data for alternatives over criteria to form a set of decision matrix. Note that,
criteria that need to be minimized in the selection shall be placed at the last position for easier
calculations in TOPSIS application. Since the objective of selection scheme is to minimize the
favouritism when a selection is vulnerable to the human factors, hence in arranging the criteria
before forming the decision matrix, the international effect is placed as the last criteria. This is
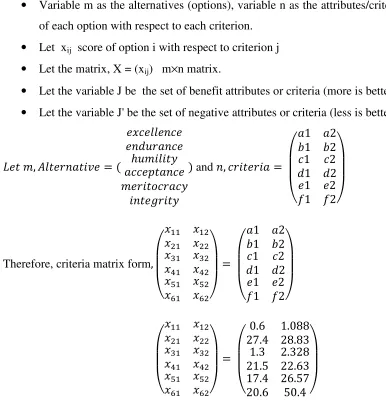
clearly shown in Figure 4 below. Before that, a few variable assumptions shall be assumed in this
context.
• Variable m as the alternatives (options), variable n as the attributes/criteria and the score
of each option with respect to each criterion.
• Let xij score of option i with respect to criterion j
• Let the matrix, X = (xij) m×n matrix.
• Let the variable J be the set of benefit attributes or criteria (more is better)
• Let the variable J' be the set of negative attributes or criteria (less is better)
, = (
ℎ
) and , =
1 2 1 2 1 2 1 2 1 2 1 2!
" " #
Therefore, criteria matrix form,
$$ $%
%$ %%
&$ &%
'$ '%
($ (%
)$ )%!
" " #
=
1 2 1 2 1 2 1 2 1 2 1 2!
" " #
$$ $%
%$ %%
&$ &%
'$ '%
($ (%
)$ )%!
" " #
=
0.6 1.088 27.4 28.83 1.3 2.328 21.5 22.63 17.4 26.57 20.6 50.4 !
Figure 4: Determine the alternatives over the criteria to form a decision matrix
Step2:
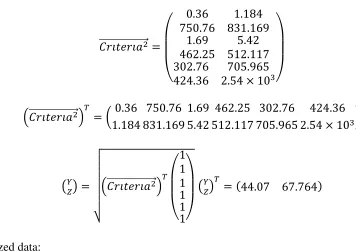
In step 2, it is to obtain the normalized decision matrix by using the decision matrix form in
step 1. In order to normalize the set of data, each data of the system shall be divided with the
square root of the summation of each data with square by column.
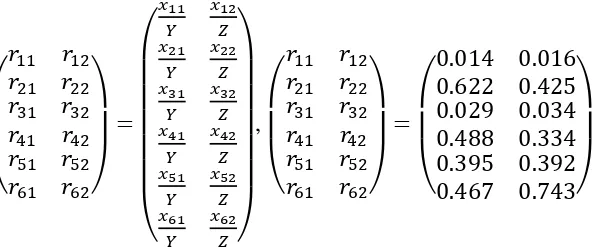
As shown in Figure 5, the criteria is being squared and followed by the square root of
summation by column. This is actually a step to obtain the normalized ratio of the each column,
Y and Z before the score of the criteria are being divided with it. These normalized values are
important to obtain because tit represents the overall ratio of the data involve.
Arithmetic of the square of original values
2 3 3%
444444444444444444445 =
0.36 1.184
750.76 831.169
1.69 5.42
462.25 512.117
302.76 705.965
424.36 2.54 × 10&!
" " #
82 3 34444444444444444444459% : = ;0.36
1.184831.169750.76 1.695.42512.117462.25 705.965302.76 2.54 × 10424.36 &<
=>?@ =
A BB BB BB BB BC
82 3 34444444444444444444459% :
1 1 1 1 1 1!
" #
=>?@: = (44.07 67.764)
$$ $%
%$ %%
&$ &%
'$ '%
($ (%
)$ )%!
" " #
=
DEE >
DEF ? DFE
> DFF
? DGE
> DGF? DHE
> DHF
? DIE
> DIF
? DJE
> DJF? !
" " " " " #
,
$$ $%
%$ %%
&$ &%
'$ '%
($ (%
)$ )%!
" " #
=
0.014 0.016 0.622 0.425 0.029 0.034 0.488 0.334 0.395 0.392 0.467 0.743!
[image:9.612.160.456.73.199.2]" " #
Figure 5: Normalized decision matrix (TOPSIS)
Step3:
In this step, the weight decision matrix is build by multiplying these normalized values
(obtained in step 2) with their corresponding weight, wj. However, in this study, the
corresponding weight is not provided, hence the Analytical Hierarchy Process (AHP) technique
is applied in order to obtain the weight for each criterion. Figure 6 shows the series of
calculations using the AHP technique. Based on the figure below, assume the variable ‘A’ as the
single pair wise comparison matrix for the EOL and MW while variable ‘B” as their normalized
values. Since this step is applied to obtain the corresponding weight for EOL and MW, hence the
summation of the overall scores of these criteria is needed.
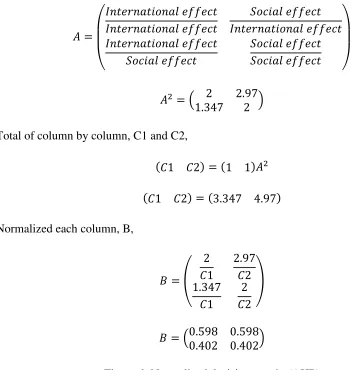
Firstly, determine the single pair-wise comparison matrix and then calculate the product of
the comparison matrix. Next divide the sums of the column and average across the row. The
value achieved is then named as W1 and w2 as shown in Figure 6 and Figure 7.
Sum of criteria
K = 1 + 1 + 1 + 1 + 1 + 1
K = 88.8
M = 2 + 2 + 2 + 2 + 2 + 2
M = 131.846
=
K K K M
K
M M M !
" #
% = 8 2 2.97
1.347 2 9
Total of column by column, C1 and C2,
(21 22) = (1 1)%
(21 22) = (3.347 4.97)
Normalized each column, B,
N = O 2
21 2.9722 1.347
21 222
P
[image:10.612.94.449.70.440.2]N = 80.598 0.5980.402 0.4029
Figure 6: Normalized decision matrix (AHP)
In Figure 7, the average value across the row represents the weighting for the criteria tested.
The variable W1 represent weight for the International effect while the variable W2 represent the
Social effect criteria. From the calculation, the results pointed up that the International effect is
more important where it has the higher weight. However, this weight will be then carried to
TOPSIS method for further calculations to obtain the ranking for all the alternatives tested.
Averageof row by row, W 1 and W2
W1
1
2(0.598+0.598)
:=
W2
1
2(0.402+0.402)
:=
W1=0.598
W2=0.402
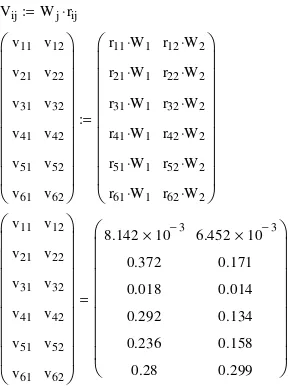
The variable W1 and W2 is then used to multiply with the normalized decision matrix
(TOPSIS) in Figure 5 to obtain the weight decision matrix.
Vij:=Wj⋅rij
v11 v21 v31 v41 v51 v61 v12 v22 v32 v42 v52 v62
r11⋅W1
r21⋅W1
r31⋅W1
r41⋅W1
r51⋅W1
r61⋅W1 r12⋅W2
r22⋅W2
r32⋅W2
r42⋅W2
r52⋅W2
r62⋅W2
:= v11 v21 v31 v41 v51 v61 v12 v22 v32 v42 v52 v62
8.142×10⁻³ 0.372
0.018
0.292
0.236
0.28
[image:11.612.234.379.129.322.2]6.452×10⁻³ 0.171 0.014 0.134 0.158 0.299 =
Figure 8: Weight Decision Matrix
Step4:
In this case, the W11, W21, W31, W41, W51, and W61 is belong to the benefit criteria while for
the W12, W22, W32, W42, W52, and W62 is belong to the non-beneficial criteria. Therefore, by
using the Eq. (2) and Eq. (3), the ideal alternatives and negative ideal alternatives solution can be
determine as:
PIS = {0.372 6.452 10, ⋅ −3}
NIS = {8.142×10−3,0.299}
Figure 9: Positive Ideal Solution and Negative Ideal Solution
Step5:
Calculate the distance between the alternatives with the positive and negative ideal solutions
using Eq. (5) and Eq. (6).
SI (vij−PIS) 2
∑
:=
(5)
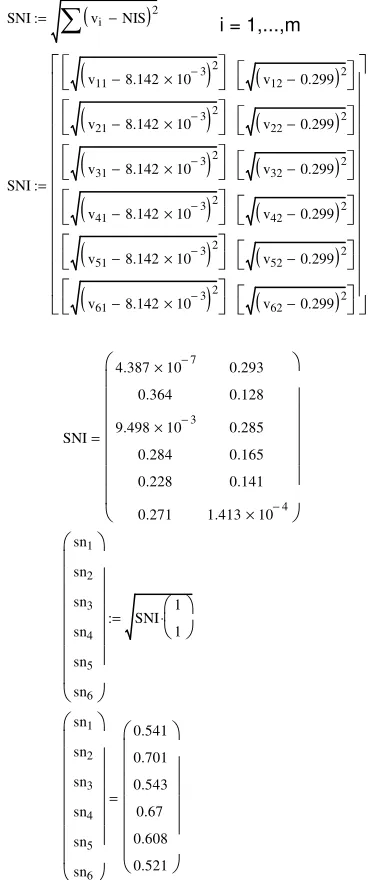
For Negative Ideal Solution
SNI (vi −NIS) 2
∑
:= i
(6)
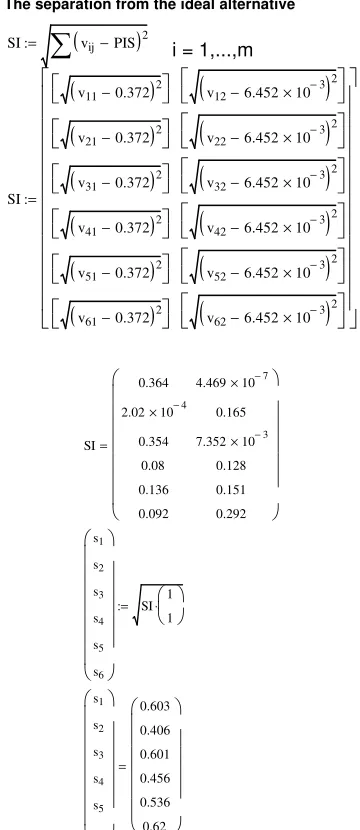
[image:12.612.212.392.250.665.2]The distance measurements can is illustrated in Figure 10 for the Positive Ideal Solution and
Figure 11 for the Negative Ideal Solution.
The separation from the ideal alternative
SI (vij−PIS) 2
∑
:= i = 1,...,m
SI
v11−0.372
( )2
v21−0.372
( )2
v31−0.372
( )2
v41−0.372
( )2
v51−0.372
( )2
v61−0.372
( )2
v12 6.452 10 3 −
× −
(
)
2
v22 6.452 10 3 −
× −
(
)
2
v32 6.452 10 3 −
× −
(
)
2
v42 6.452 10 3 −
× −
(
)
2
v52 6.452 10 3 −
× −
(
)
2
v62 6.452 10 3 −
× −
(
)
2 := SI 0.364
2.02×10⁻⁴ 0.354
0.08
0.136
0.092
4.469×10⁻⁷ 0.165
7.352×10⁻³ 0.128 0.151 0.292 = s1 s2 s3 s4 s5 s6 SI 1 1 ⋅ := s1 s2 s3 s4 s5 s6 0.603 0.406 0.601 0.456 0.536 0.62 =
The separation from the negative ideal alternative
SNI (vi −NIS) 2
∑
:= i = 1,...,m
SNI
v11 8.142 10 3
−
× −
(
)
2
v21 8.142 10 3
−
× −
(
)
2
v31 8.142 10 3
−
× −
(
)
2
v41 8.142 10 3
−
× −
(
)
2
v51 8.142 10 3
−
× −
(
)
2
v61 8.142 10 3
−
× −
(
)
2
v12−0.299
( )2
v22−0.299
( )2
v32−0.299
( )2
v42−0.299
( )2
v52−0.299
( )2
v62−0.299
( )2
:= SNI
4.387×10⁻⁷ 0.364
9.498×10⁻³ 0.284 0.228 0.271 0.293 0.128 0.285 0.165 0.141
1.413×10⁻⁴
[image:13.612.210.395.92.532.2] = sn1 sn2 sn3 sn4 sn5 sn6 SNI 1 1 ⋅ := sn1 sn2 sn3 sn4 sn5 sn6 0.541 0.701 0.543 0.67 0.608 0.521 =
Figure 11: The Distance measurement for separation Negative Ideal Solution (SNI)
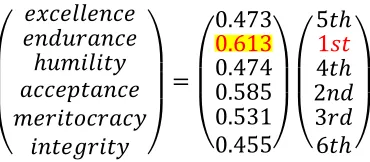
Step6:
Using Eq. (4), the relative closeness coefficient, RC can be obtained. The numerical value of
each alternative will be in between 0 to 1. Based on TOPSIS method, the higher the numerical
achieve, the higher the possibility or the best alternatives among all. Therefore, endurance shall
ℎ ! " " # = Q$
Q$+ Q$
Q%
Q$+ Q$
Q&
Q$+ Q$
Q'
Q$+ Q$
Q(
Q$+ Q$ Q)
Q$+ Q$!
[image:14.612.227.385.70.339.2]" " " " " " " " " # ℎ ! " " # = 0.473 0.613 0.474 0.585 0.531 0.455! " #
Figure 12: The Relative closeness Coefficient
Step7:
The corresponding ranking of six possible values is tabulated in Figure 13. The ranking of
the alternatives s based on the value that closest to 1. The first position represented the first
values to be taken based on the justification.
R = > > > ℎ > > ℎ ! " " # = 0.473 0.613 0.474 0.585 0.531 0.455! " # 5ℎ 1Q 4ℎ 2 3 6ℎ! " #
[image:14.612.214.399.551.632.2]5. Analysis
In this paper, a new method in finding weight has been applied. The Analytic Hierarchy
Process (AHP) is used to obtain the criteria weight while the Technique for Order Preference by
Similarity to Ideal Solution (TOPSIS) method is used to rank the selected values into series of
sequences. In AHP method, the weight represents the priority of each criterion. From the
calculations, the higher the value of weight calculated (WAHP), the higher the priority of one
criteria. The numerical weight or priority derived from AHP allowing diverse and often
incommensurable elements to be compared to one another in a rational and consistent way.
These values were then taken as their weight for TOPSIS usage.
6. Conclusions
The procedure of extended TOPSIS is explained in seven steps. Within the steps, it includes
the normalized rules of combination as the pre-operation of external collection, defining the PIS
and NIS, calculating the separation measurements of each alternative from total PIS and NIS,
computing the closeness coefficient of each alternative and the ranking of the preference order
for group.
This paper presents an idea to combine the TOPSIS multi-criteria decision making with the 1
Malaysia values in scientific and technological project evaluation. This method is an agent in
searching the best set of values to be selected in order to select the best project without bias or
subjective judgments.
7. Acknowledgement
The authors gratefully acknowledged staff in the Laboratory of Electric Machines and Drives
as well as the Laboratory of Electric Power, UTHM for their valuable contribution towards the
success of this work. The authors would like to thank the Ministry of Higher Education,
Malaysia (MOHE) and Research and Innovation Centre, UTHM for financially supporting this
8. References
[1] T.B. Yu, J.Z. Zhou, K.Zhao, W. Wang and W.S. Wang (2008). “Study on Project
Experts’ Evaluation Based on Analytic Hierarchy Process and Fuzzy Comprehensive
Evaluation", International Conference on Intelligent Computation Technology and
Automation, IEEE Explore p. 941-945.
[2] E. Loken, A. Botterud and Arne T. Holen (2006). “Decision Analysis and Uncertainties
in Planning Local Energy Systems” International Conference on Probabilistic Method
Applied to Power Systems KTH, Stockholm, Sweden, IEEE Explore
[3] Cheng E., Li H. and Ho D., 2002, “Analytic Hierarchy Process (AHP)”, Measuring
Business Excellence Bradford, Vol. 6, pp 33-38
[4] Z. Dashti, M. M. Pedram and J. Shanbehzadeh, 2010. “A Multi-Criteria Decision Making
Based Method for Ranking Sequential Patterns”, International Multi Conference of
Engineers and Computer Scientist 2010.
[5] Dan Xue, Q. L Zhao and X.Y. Guo, (2008). “TOPSIS Method for Evaluation Customer
Service Satisfaction to Fast Food Industry”, IEEE Explore, p. 920-925
[6] T.C. Wang and H.D. Lee (2008). “Developing a Fuzzy TOPSIS Approach Based on
Subjective Weight and Objective Weights”: Expert System with Applications, Science
Direct, pg. 8980-8985
[7] J. Dodangeh, Rosnah bt M. Yussuff (2010). “Using TOPSIS Method with Goal
Programming for Best Selection of Strategic Plan in BSC Model”, Journal of American