Experimental Study on Effect of the Air Flow Rate on Ventilation
Effectiveness in Lecture Room
Mohd Shahrizal Salleh a, Azian Hariri a,b and Abdul Mutalib Leman a,b
a
Faculty of Mechanical g and Manufacturing Engineering, Universiti Tun Hussein Onn Malaysia(UTHM) 86400, Parit Raja, Batu Pahat Johor, Malaysia.
Email: [email protected]
b
Center of Energy and Industrial Environment Studies (CEIES), Universiti Tun Hussein Onn Malaysia(UTHM) 86400, Parit Raja, Batu Pahat Johor, Malaysia.
Email: [email protected]
ABSTRACT
This study is conducted to investigate the effect of the air flow rate of cassette ceiling air conditioning on the ventilation effectiveness in lecture room. This study was done by analyzing the measurement data based on experiments conducted in the lecture room using measuring equipments such as Velocicalc, Accubalance Capture Hood and Q-Trak. Parameters consider in this study is CO2, CO, relative humidity (RH), air flow rate, air velocity and temperature. Nine points had been selected to calculate the average parameters value and the experiment was carried out repetitively with different air flow rates (low, medium and high). Despite of 80 students occupied the room with two out of ceiling cassette air-conditioning in these experiments were not unable to fully operate with its maximum performance, the result obtained shows that the lecture room’s concerning parameters for indoor air quality was still under the allowable limit suggested by ASHRAE for all investigated flow rate. The increase in flow rate should increase the ventilation effectiveness, since the indoor CO2 concentration was oppositely decreased as the flow rate increased. However, through simple mass balance calculation, the ventilation effectiveness for pollutant removal was calculated only on pollutant dispersion. This is caused by the simple mass equation derived from 1D steady state and cannot predict 3D effect such as the recirculation and stagnation zone. It is suggested to investigate this study through CFD analysis to understand the 3D effect for more accurate ventilation effectiveness analysis.
Keywords
Air flow rate, IAQ,, Ventilation effectiveness, Air Conditioning.
1. INTRODUCTION
Air is a critical element to many living things. For example people may survive for two weeks without food and for two days without water. But without air, a person may only survive for two minutes. Nowadays in developed countries, an average working person spends over 90% of his or her lifetime indoors [1].
Indoor air quality (IAQ) refers to the quality of the air inside buildings as represented by concentrations of pollutants
and thermal (temperature and relative humidity) conditions that affect the health, comfort, and performance of occupants. Ann Pike (2004) states air quality has been an acknowledged concern for the last 30 years and the awareness seems too had begun after the energy crisis of 1970's [2]. Since that time, building had been constructed buildings more tightly to conserve heat and air conditioning while fresh air penetration is minimized to control costs. Hence the issue about ventilation efficiency captured more and more people’s attention.
It is useful to evaluate ventilation efficiency in order to assess IAQ and energy cost. A number of techniques are
available to perform such evaluations. Among them, the measurement and analysis of CO2 concentrations to evaluate specific
aspects of IAQ and ventilation is most emphasized. CO2 is a common air constituent but it may cause some heath problems
when its concentration level is very high. Normally CO2 is not considered as a causal factor in human health responses.
However, in previous literature Erdmann CA & Apte MG (2004) it has been reported that there is a statistically significant association of mucous membrane (dry eyes, sore throat, nose congestion, sneezing) and lower respiratory related symptoms
(tight chest, short breath, cough and wheeze) with increasing CO2 levels above outdoor levels [3].
American Lung Association indicates that the poor indoor air quality can cause or contribute to the development of chronic respiratory diseases such as asthma, and hypersensitivity and pneumonitis. Meanwhile the US Environmental Protection Agency Study indicates the levels of pollutants in indoor air can be up to 70 times higher than outdoor air [4].
2. LITERATURE REVIEW
From the previous research, Cheong et al, .2003; Apte,M.G. et al., 1996 states many building have poor indoor air
quality especially on CO2 concentration and the result presented by Korean Standard (1991) and ASHRAE Standard (2001 &
2004) shows that the role of ventilation is very important for more comfortable indoor environment because CO2 cannot be
removed by present air cleaning systems [5-7].
Based on Daisey, J M, Angell, W J, and Apte, M G., indoor air quality ventilation and health symptoms in schools was inadequate in many classrooms and create possible health problem [13, 18]. According to Lee,S.C & Chang,M (2003)
indicate five classrooms at five different schools in Hong Kong has the value point data sample CO2 concentration exceeded
the Hong Kong indoor air quality limits due to the high outdoor concentration and inadequate ventilation when investigated the indoor and outdoor air quality [17]. Apte, M.G., Fisk, W.J., Daisey, J.M., (2000) investigated the associations between indoor
CO2 concentration and Sick Building Symptoms (SBS). From the analysis show that the regression results between maximum
for one hour average indoor CO2 minus outdoor CO2 concentration and SBS was similar [13, 16].
Nabinger SJ, Persily AK, Dols WS. (1994) indicates the ventilation effectiveness is getting better or worse with variations of the intensity and the location of momentum source affect the residence time of air in the room. Many works
contributed to use indoor CO2 concentration to evaluate IAQ and ventilation. The operation and effectiveness of the ventilation
system is evaluated to investigate the relationship between indoor CO2 levels and air change rates. However, the assessment
was done for a whole building without considering individual rooms [20]. Lawrence TM & Braun JE (2007) used parameter
estimation methods to estimate CO2 source generations and system flow parameters, such as supply flow rate and overall room
ventilation effectiveness. They examined different parameter estimation methods from simulated data and the best performed method was applied to field results [21].
From previous research until now, very limited study had been done focusing on the effect of flow rate to the ventilation effectiveness [8-10]. Therefore this study will be focus and investigated the effect of the flow rate of cassette type air-conditioning on ventilation systems in lecture room.
3. METHODOLOGY
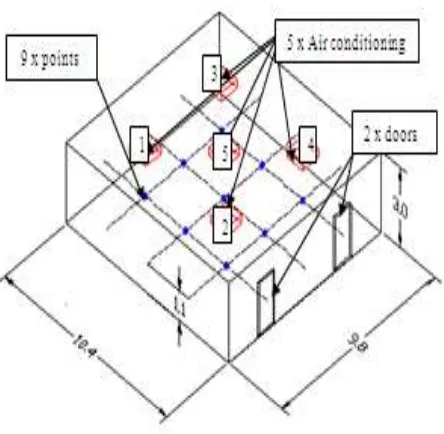
This experiment conducted in Seminar Room A-1 and Figure 1 shows the methodology chart of the research. Based on class area, 9 point is chosen as measurement point. The points are selected to represents the average value of the overall
lecture room. Figure 2 shows that the dimension of this classroom is 10.4 m (L) x 9.8 m (D) x 3 m (H).
Accubalance Capture Hood is used to measure the air flow rate at supply and exhaust diffuser. The experimental study is carried out by conducting measurement of 2-hour lecture that refers to one session lectures. Measurement at each point will takes about 20 minutes by using Accubalance Capture Hood, Velocicalc and Q-Trak Meter. This experiment take about 1 to 3 hours to complete during class is being held. Apart from that, data for this experiment was taken with difference value of flow rate during experiment (low, medium and high).
Q-Trak meter and Velocicalc is used to measure the CO2, CO, air velocity, relative humidity and temperature
This measurement is carried out for 5 minutes for each point and data will take after CO2 value become stable. Ventilation effectiveness can be calculated by simple balance mass equation,
where;
Where C∞ is contaminant outdoor supply air (ppm), Ce is contaminant exhaust air (ppm), is mean concentration indoor
(ppm), is rate of discharge from pollutant source (m3/hr), is rate of supply of outdoor air (m3/hr). Ev is ventilation
effectiveness. For efficient system, Ev can be higher than 1. In case of short circuit system, Ev can be lower than 1. The default value for Ev is 1 corresponding to a perfect mixing.
[image:3.596.49.238.219.544.2]
Figure 1: Methodology flow chart Figure 2: Layout of the lecture room in meter
4. RESULT AND DISCUSSION
Based on the results we can conclude that the data obtained is still within the standard. However, there are few inconsistent data collected because of the malfunctioning of air conditioning unit in the lecture room that unable to fully
operate with its maximum performance. Figure 3 and Figure 4 shows that the average concentration of CO2 and velocity
against measuring point with different flow rate. Figure 5 shows the investigated parameters comparison between different
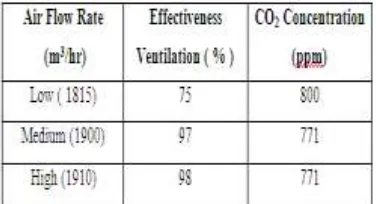
flow rates. The increased of air flow rate will reduce the amount of CO2 in the class. Figure 6shows the summary from data
calculation for ventilation effectiveness and CO2 concentration. Despite of 80 students occupied the room with two out of
ceiling cassette air-conditioning in these experiments were not functioning to its maximum performance, the result obtained shows that the lecture room’s concerning parameters for indoor air quality was still under the allowable limit suggested by ASHRAE for all investigated flow rate. Figure 7 and Figure 8 shows the increase in flow rate should increased the ventilation
[image:3.596.303.525.330.547.2]
Figure 3: Average CO2 against measuring point Figure 4: Average air velocity against measuring point
with different air flow rate. with different air flow rate.
[image:4.596.305.538.104.246.2] [image:4.596.83.259.325.457.2]
Figure 5: Comparison of the result between low, medium and Figure 6: Summarize from data calculations. high fan from air supply.
Figure 7: Correlation ventilation effectiveness at the different Figure 8: Correlation CO2 at the different air flow rate.
[image:4.596.317.505.356.458.2] [image:4.596.330.534.523.680.2] [image:4.596.73.277.527.682.2]5. CONCLUSION
The effect of the discharge airflow rate of the ceiling type air-conditioner on effectiveness ventilation was studied.
The identified CO, temperature, air velocity, relative humidity and CO2 concentration is still under the allowable limit of
ASHRAE Standards. The increase in flow rate should increase the ventilation effectiveness, since the indoor CO2
concentration was oppositely decreased as the flow rate increased. However, through simple mass balance calculation, the ventilation effectiveness for pollutant removal was calculated based only on pollutant dispersion. This is caused by the simple mass equation derived from 1D steady state and cannot predict 3D effect such as the recirculation and stagnation zone. It is suggested to investigate this study through CFD analysis to understand the 3D effect for more accurate ventilation effectiveness analysis.
6. REFERENCES
[1] Zhang, Yuanhui. (2004). Indoor Air Quality Engineering. United State of America: CRC Press LLC.
[2] Ann Pike-Paris, BS, MS. (2004). Indoor Air Quality: Part 1 - What It Is: IAQ - A Definition and Brief History,
East Aurora, NY.
[3] Erdmann CA, Apte MG. (2004). Mucous membrane and lower respiratory building related symptoms in relation to
indoor carbon dioxide concentrations in the 100-building BASE dataset; 14: 127–34. [4] American Lung Association (2004).1301, Pennsylvania Ave, NW, Washington, DC.
[5] M.G. Apte, W.J. Fisk, J.M. Daisey, (2000). Indoor Carbon Dioxide Concentrations and SBS in Office Workers,
Proceedings of Healthy Buildings, Conference.
[6] Lee, S. C., Chang, M. (1999). Indoor Air Quality Investigations at five classrooms. Indoor Air, 9, 134-138.
[7] ASHRAE, Standard 62, (2001).Ventilation for Acceptable Indoor Air Quality, Atlanta, GA in American Society of
Heating, Refrigerating, and Air Conditioning Engineers, Inc.
[8] U.S. Environmental Protection Agency (EPA) (1995).Indoor Air Quality Tools for Schools.IAQ Coordinator’s Guide,
EPA 402-K-95-001, EPA. Washington, DC.
[9] D. Grimsrud, B. Bridges, R. Schulte (2006).Continuous measurements of air quality parameters in schools, Building
Research and Information 34 (5) 447–458.
[10] M. Mendell, G.A. Heath, Do (2005). Indoor pollutants and thermal conditions in schools influence student
performance. A critical review of the literature, Indoor Air -International Journal of Indoor Air Quality and Climate 15 (1)27–52.
[11] Meckler, Milton (1996). Improving Indoor Air Quality Through Design, Operation, and Maintenance. The Fairmont
Press 1, vii.
[12] United State Environmental Protection Agency (EPA). http://www.epa.gov
[13] Apte, M.G., Fisk, W.J., Daisey, J.M. (2000). Associations between indoor CO2 concentrations and sick building
syndrome symptoms in U.S. office buildings: an analysis of the 1994–1996 BASE study data. Indoor Air 10, 246–257.
[14] ASHRAE Standard 62-2001. (2001). Ventilation for Acceptable Indoor Air Quality. ASHRAE, Atlanta, GA, USA.
[15] ASHRAE Standard 55-2004. (2004). ASHRAE Thermal Environmental Conditions for Human Occupancy. American
Society of Heating, Refrigerating, and Air Conditioning Engineers.
[16] Cheong, K.W.D., Djunaedy, E., Chua, Y.L., Tham, K.W., Sekhar, S.C., Wong, N.H., Ullah, M.B., (2003). Thermal
comfort study of an air-conditioned lecture theatre in the tropics. Build. Environ. 38, 63–73. Heating, Refrigerating and Air Conditioning Engineers, Atlanta, GA, USA, 2004.
[17] Lee, S.C., Chang, M., (2003). Indoor air quality investigations at five classrooms. Indoor Air 9, 134–138.
[18] Daisey, J M, Angell, W J, and Apte, M G. (2003). Indoor air quality, ventilation and health. Symptoms in schools: an
analysis of existing information Indoor air. Vol. 13 pp. 53-64.
[19] Noh, K.C., Oh, M.D., (2006). Variation of ventilation performance with the intensity and the location of indoor
momentum source. In: Proceedings of the Healthy Buildings, Lisboa, pp. 163–167.
[20] Nabinger SJ, Persily AK, Dols WS.(1994). A study of ventilation and carbon dioxide in an office building. ASHRAE
Transaction; 100(2):1264–73.
[21] Lawrence TM, Braun JE. (2007). A methodology for estimating occupant CO 2 source generation rates from
measurements in small commercial buildings. Building and Environment;42:623–39.
[22] TSI Incorporated (2003). Indoor Air Quality Handbook, a Practical Guide to Indoor Air Quality Investigations, 500
Cardigan Road, Shoreview, MN 55126 USA.
[23] Noh, K.C, Jang, J.S, Oh, M.D. (2007). Thermal comfort and indoor air quality in lecture room with 4-way cassette
air-conditioner and mixing ventilation systems. Built Environ. 42 (2), 689-698.