L
ABSTRAC
The motivatio (FTTH) netwo Baghdad City been putting u tion and numb done through as well as cos evaluate the fe
Keywords: G
1. Introduc
With the deve plications, the mand. PON t width, good m efficiency, ha work [1]. Fro tion Union-T (ITU-T) has GPON system operating at 2 upstream rates
FTTH (Fibe loy access ne users simultan chitecture, FT Line Termina to end user de center office t and then cont tomers. For ne optic network nimization, w possible. This optic cable ro components o In [3] a mo tions expense
Link an
Implem
E
CT
on behind this ork which is o y. Based on the
under consider ber of OLT por
evaluation the st ratio betwee eeder network
Gigabit Passive
ction
elopment of m ere is a massiv technology, is management fu as already been
m 2003, the I Telecommunica
published G.9 m. GPON is a P
2.488 Gbps d s [2].
er to the Hom etwork, which
neously at hig TTH networks l (OLT) usual evices (ONT) to the remote n tinuing by diff etwork access, k connectivity while keeping s is because ov oute is usually of the network. deling of the c es incurred fo
nd Cost
mentat
Dheyaa Jas Electrical Engine
s work is the n one of the Ira e detailed stud ration through rts (PON) had e total cost of P
en EPON and cost, distribut
e Optical Netw
many advanced ve increase in
featured with unction and hi n widely used International T ation Standard 984.x standard Passive Optical
downstream an
me) is a viable allows servin gh speed. In th
carry signal fr ly placed in th by running a node in the mi fferent fibers t , it is always d be the major a quality of ser verall cost of se
very high in r
capital investm or some opera
Optim
ion thro
sim Kadhim, eering Departme Email: dh Receineed for perfo aq Telecommu dy of this proje a mathematica d been studied a PON system an GPON is eva tion network co
work (GPON); F
multimedia ap n bandwidth d
h flexible band gh transmissio d in access ne Telecommunica
dization Secto d to define th l Network (PO
nd 1.244 Gbp
solution to dep ng multiple en
he common a from the Optic he center offic fiber from th iddle of the wa
o different cu desired that fib area of cost m rvice as high a etting up a fib relation to oth
ments and oper ator cases, an
mization
ough G
, Nahla Abdu ent, University o [email protected]
ived May 2013
ormance analy unication Post ect, the design, al model simu and evaluated nd who it affec aluated. Then G
ost, and total n
Fiber to the Ho
p- e- d- on et- a- or he N) ps p-nd ar-al ce, his ay us-er mi-as er er a- nd identifi ics cov hensive include and lab program network versity In th mentati perform evaluati as a fun through it affec as well luated. lyze en network The 2 will i pology perform numeri be mad
2. Opt
Iraq Teof FTT
GPON T
ulrahman H of Baghdad, Bag comysis of Al-Geh and Company , implementati ulated and perf as a function o cted with the n GPON system network cost.
ome (FTTH) N
ies the key par vering these m e cost modelin es outside plan bor with enhan mming in gen
k problem of c is found in [5] his work, we w
ion of Al-Geh mance analysis ing link utiliza nction of cycl h evaluation th ted with the n l as cost ratio Then GPON nd evaluate th k cost, and tota
rest of this pa illustrate the p
network will mance analysis cal results are de in Section 6
tical Netwo
elecommunicatTH Netw
Technolo
Hussain ghdad, Iraqhad/Baghdad “ y (ITPC) FTT ion, and analys formance evalu of cycle time. number of ONU m has been opt
Network; OLT
rameters that im major technolog
ng of FTTH n, head end, an nced reach an erating a mod connecting bu ].
will introduce had/Baghdad F s of this netwo ation and numb
le time. Cost o he total cost of number of ONU
between EPO system has b he feeder netw
al network cos aper is structur project inform l be explained s is illustrated shown in Sect .
ork Modelin
tion and Post
work
ogy
“Fiber To The TH projects in
sis of this netw uated. The link
Cost optimiza Us (i.e. splittin timized to ana
T and ONU
mpact FTTH e gies. In [4] a
was presented nd premises eq nd split ratio. del to solve th uildings across
study, design FTTH network ork was done ber of OLT por optimization w f PON system
Us (i.e splittin ON and GPON een optimized work cost, dis
st.
red as follows; mation, the netw
d in Section 3 in Section 4, w tion 5. Conclu
ng
Company (IT e Home” 2010 in work has k utiliza-ation was ng ratio), lyze and econom- compre- d, which quipment A linear he access the uni- n, imple-k, then athrough rts (PON) was done
and who ng ratio), N is eva- d to ana- tribution
; Section work to-3 and its
while its sion will
cuses on the users’ requirements and the technology trends, is constructing the national FTTH network to provide Voice over IP (VoIP) and High Speed Internet (HSI) ser-vices to the residential customers. FTTH network in Al- Gehad consists from two OLTs placed in Al-Gehad ex-change will be serving 6000 subscribers in total area of about 32 km. It has been planned to use 6000 ONTs, one ONT per subscriber. Each OLT will connect to the con-verged Layer 3 switches and then the routers to ITPC Passive Distribution Network (PDN) network. The length of feeder cables is 243 km, and the length of distribution cables is 405 km, so the total fiber cables length will be 647 km.
After studying the project maps and summarized the varying building features and application scenarios of the detail site survey, and based on the requirement of IPTC, the design will be as follow [6]:
For general network topology, a ring topology is used
to deploy the FTTH passive network, offer the pro-tection to Optical Distribution Network (ODN).
There is 20% of spare capacity in the feeder cables,
from the Central Office up to the Fiber Distribution Terminal (FDT), to meet the future requirements.
Feeder section from CO to FDT, 144F optical cable
will be proposed by ring topology and 2:4 first level splitters will be proposed in FDT cabinet.
Distribution section from FDT to Fiber Access
Ter-minal (FAT), 72F, 48F, 24F, and 12F optical cable will be proposed by star topology, 1:16 second level split-ter will be proposed in FAT, which is closure to wall mounted FAT product to meet different requirement and scenarios.
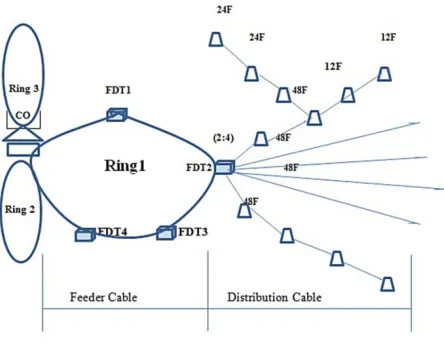
Two topologies are used as shown in Figure 1, ring
[image:2.595.61.283.551.725.2]topology for feeder cables that are connect the Fiber Dis-tribution Terminals (FDTs) to the Central Office (CO) by first level splitting of 2:4, and star topology to connect several numbers of Fiber Allocation Terminal (FAT) to each FDT by second level splitting of 1:16.
Figure 1. Network Topology.
OLT will be deployed in each central office and the quantity will be calculated to satisfy the coverage capac-ity. Each OLT will connect to the converged Layer 3 switches and then the routers to ITPC PDN network. BRAS will be installed in the core central offices. BRAS are full-loaded configuration with the processing capabil-ity of not less than 115,000 lines. In the normal status, each BRAS just take the service traffic which belongs to the corresponding areas. When one is broken, the other BRAS will take the whole service. AAA is the same with BRAS. EMS remote redundancy is ensuring the reliabil-ity.
For FTTH solution the access layer will provide OLT equipment in exchange; all subscribers will be connected through Optical Distribution Network (ODN). The pro-posed connection will be from the OLT to access point Fiber Access Terminal distribution box (FAT).
As it is obvious from Figure 2 the FTTH system
com-prises the Optical Line Terminal (OLT) on the CO, the Optical Network Terminal (ONT) on the user side, and the Optical Distribution Network (ODN). The FTTH con-struction features the PON technology, which provides point to point and point to multi-point applications. ODN provides the physical channels from OLT and ONT to communicate with each other.
3. Performance Analysis of FTTH Network
Use of passive optical networks is very advantageous in designing FTTH architectures [7]. If a two main stan-dards (EPON and GPON), named xPON, are considered, a series of important optimization problems for the de-sign, plan, and deployment of FTTH networks and pas-sive optical networks should be considered since they truly effect on the network efficiency and performance.
The target is to compare the network cost of an EPON and GPON system based on the utilization of the optical link’s transport capacity. The utilization affects directly the segmentation need in an optical network and this ef-fect on the total network cost [8].
3.1. Link Utilization
Equation (11) calculates link utilization (υEd) of an EPON
[image:2.595.309.538.638.727.2]downstream channel.
Ed
[ * * ]
* E
c E ONU cm Eo E
c E
f t B N f
f f
t B υ
− +
= (1)
Where fE is the EPON frame payload, fEo the
EPON frame overhead, it is taken to be 42 bytes, BE
the bit rate of an EPON link, it is equal to 1.25 Gbps,
ONU
N the ONUs number in the network segment which
is taken 10,000, fcm the length of control message, it is equal to 88 bytes, and the cycle time. Utilization (υEU)
of an EPON is given by Equation (2);
Eu
[ * ( * )]
* E
c E ONU cm po E Eo E
c E
f t B N f t B
f f
t B υ
− +
= + (2)
Where tpo is the physical layer overhead (i.e. guard
band), it is taken 1.44 µsec. Utilization (υGd) of an GPON
downstream is given by Equation (3);
*
Gd
[ * ? ]
*
ONU td Ep
d G Go ao
GEMo Ep c
d G
N f
t B f f
f f t
t B
υ
−
+
= (3)
Where fGEMo is the GEM framing overhead for
Ether-net payload which is equal 30 bytes, fEp is Ethernet
payload, td is GPON duration of downstream frame, its
equal 125 µsec, BG the GPON bit rate (1.25 Gbps),
Go
f (27 bytes) is the GPON downstream frame
over-head, and fao (27 bytes)is the upstream allocation
over-head. Utilization (υGu) of an GPON upstream is given by
(4);
*
Gu
[ * ]
*
d
ONU t Ep
d G plou dbru
GEMo Ep c
d G N f
t B f f
f f t
t B υ
− +
+
= (4)
Where fplou is the length of physical layer overhead
(include PLOAMu field) it taken 15 bytes, and fdbr is
the average number of DBRu fields in an upstream GPON frame.Since an ONU can send several GEM frames dur-ing its time slot and only the first of them carries the PLOu field and all frames carry the DBRu field, fdbr is approximated by:
*G
GEM
c B
plou ONU dbru
dbru f t
f N f
f + −
= (5)
Where fGEM = fGEMo+ fEP
3.2. Network Segmentation
At building a passive optical network, segmentation is the way to guarantee fair transport capacity per subscrib-er as shown in Figure 3.
[image:3.595.317.534.84.196.2]A number of needed network segments are determined
Figure 3. Segmented PON layout [10].
according to the total transport capacity and number of subscribers. For both EPON and GPON systems, assume that the total transport capacity of segment Segk is Ck,
line coding efficiency is σ and utilization of the transport channel capacity is υ, so Bk the total bit rate available for
user in segment Segk is:
Bk = συ Ck (6)
The total available bit rate for the segment Segk is the
sum of the traffic of all ONUs connected to it as below:
k 0 k,I
B =
Mki= b (7)Where Mk represents the number of ONUs connected
to the ith port of the OLT. Thus, the number of required segments (OLT ports) will be [10]:
Ωβ σ C
K Nro
υ
= (8)
Where Ω is a broadband access (take rate) as (0 ˂Ω˂
1), β is the percentage of active subscribers that operate during a busy hour, N is ONUs number, ro is the
aver-age bandwidth required to support all requested services on one or all OLT ports, σ is line coding efficiency, υ is the utilization of the transport channel capacity, and C is transport capacity.
The number of PONs determines the number of OLTs required serving a whole region. This enables network planners to know the cost required for installing, confi-guring and upgrading GPON resources. Each PON can serve up to ΩN/K subscribers, which can be expressed as follows [10]:
Number of subscribers = N
K
Ω = σ C βro
υ (9)
This formula indicates that the number of subscribers supported on a single OLT port (PON) depends mainly on ro and β.
Each OLT of Al-Gehad FTTH network has 18 ports, 14 are used and the other four ports are left for the possi-bility of traffic growth.
3.3. Relative Network Cost
[image:3.595.67.288.308.352.2]factor when calculating the cost of EPON and GPON net-works. The number of segments indicates the difference between an EPON and GPON networks in the amount of installing fiber and the number of the needed transceivers in the network. The relative network cost of an EPON and GPON is given by [8]:
φ σ σ
G
E
G GC
E EC υ υ
= (10)
Where φ = KE/KG, and Setting the parameters (β, Ω, N,
and ro) equal in both approaches, (i.e. EPON and GPON).
4. GPON Capacity and Cost Optimization
Optimization approach aims to optimally allocate the ca-pacity on GPON access network links on Al-Gehad FTTH network, which can support current and future traffic de-mands, while guaranteeing a minimum throughput required for all class j traffic, min
j
ρ . This approach is expressed in
an optimization problem as follows:
Cost minimization of the capacity of the links in the
GPON access network. Where αj cost per bit with
each link l in the GPON access network, and Cl is the
link capacity.
min
j l∈αj Cl Capacity constraints of these links, where the total
traffic load generated by all flows sharing a link should be less than its capacity,
l
H l =
j∈ j≤Cl .
Subject to
l j l
j H∈ <C
, ∀ ∈l L Throughputper-formance constraint in a GPON access network, where the throughput of each class j traffic should be greater than the minimum required throughput of this class. Where
l
H denotes the set of flows that share link l.
min , 2, ., Z
1 1
j 1
j j =
ρ ≤ρ ,∀ …
The throughput constraint can be expressed with re-spect to the average delay of generated traffic flows as
follows: follows ρj = [ ] [ ]
j
j E S
E T , where Sj represent the vo-
lume of traffic flows. Thus, the throughput performance can be written as follows:
E[Tj] ≤ min
[ ]
, 1, 2, .,
j
j
N E S
j
ρ ∀ = … (11)
Where m
j in ρ ≥ρj .
After some algebraic manipulations, the optimal ca-pacities of both GPON feeder link and distribution links can be given by [9]:
Cfeeder = N + ρmin[1+ d f N α
α ] (12)
Cdistribution = + ρmin[1+ 1 f d N
α
α ] (13)
Where N is the number of ONUs, Cfeeder is the feeder
link capacity and Cdistribution is the distribution links
ca-pacity. If we consider that the cost of transmitting traffic on feeder link is the same as that on a GPON distribution links, then αf =αd, and for simplicity take αf =αd =1.
Then, as N → ∞, the optimal capacity of the GPON
feeder link and distribution links respectively will be: Cfeeder = N + ρmin (14)
Cdistribution = + ρmin (15)
So, the optimal total cost will be
Cfeeder + N Cdistribution = 2N + (N+1) ρmin (16)
5. Nnumerical Results
The results and discussions included link utilization of
xPON, number of PONs and network cost analysis.
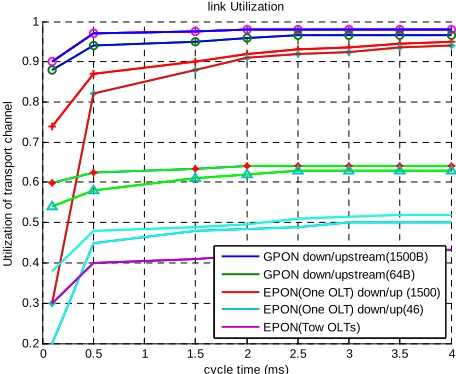
Fig-ure 4 illustrates the utilization as a function of the cycle
[image:4.595.310.538.531.718.2]time in two cases when the payload size is 46 bytes and 1500 bytes for single and multi-OLT EPON and single OLT GPON systems. This Figure shows that utilization is proportional with cycle time (i.e. short cycle time means less link utilization), with short access. Downstream di-rection achieves better utilization than the upstream does, but when cycle time increases the difference will be very little. Lower utilization obtained with multi-OLT EPON network, this is because the increasing number of ONUs since the total bandwidth must be divided among larger number of ONUs [10]. For this reason, the second level splitting ratio in Al-Gehad FTTH network is 1:16 only.
Figure 4. EPON and GPON Link Utilization vs. Cycle Time.
0 0.5 1 1.5 2 2.5 3 3.5 4
0.2 0.3 0.4 0.5 0.6 0.7 0.8 0.9 1
cycle time (ms)
U
ti
liz
at
io
n
of
t
rans
por
t c
h
annel
link Utilization
GPON down/upstream(1500B)
Figure 5 shows that the number of PONs grows
li-nearly with take rate. For the same type of traffic, GPON needs fewer segments than EPON. Multi-OLT EPON network requires larger number of segments (PONs) than single OLT xPON to assure services required to the larg-er numblarg-er of subscriblarg-ers.
Figure 6 illustrates the relationship between cycle time
and cost ratio (φ) for 46 and 1500 bytes payload. For
small payload size and short cycle time, cast ratio is higher, this refers to that GPON fits better for low volume and small delay traffic for example voice over IP (VoIP) and PSTN. For this type of traffic and in upstream direction,
φ is about 1.7. Figure 7 shows the relationship between
the capacity of the GPON link, CFeeder/N, and the number
of ONUs (N) for different amount of minimum through-put, ρmin. Subscribers are allocated less bandwidth as
num-ber of ONU increases. This is due that the capacity of
GPON link is dimensioned such that Cfeeder equals the
worst-case load (Mℱ). The optimum value of Cfeeder con-
verges around the total capacity required for accommo- dating general traffic load in addition to ρmin.
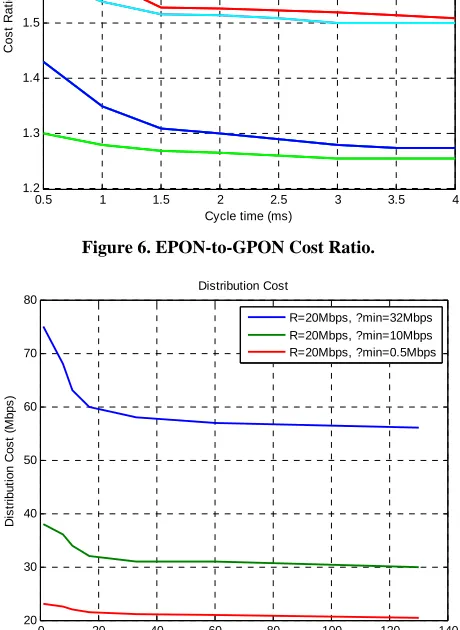
Figure 8
shows the optimal distribution link capacity required to guarantee different requirements of throughput, ρmin. Each
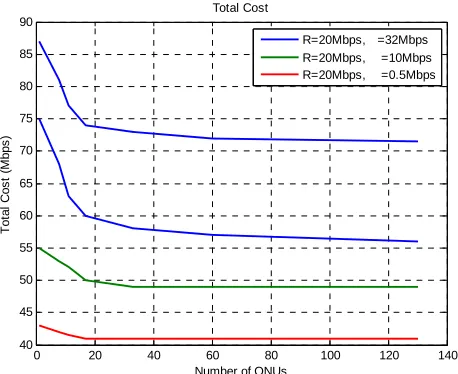
ONU can support different applications, therefore distri-bution links should have sufficient bandwidth such that the remaining capacity on distribution links, can guaran-tee the minimum throughput. Figure 9 illustrates the
op-timal total cost of GPON access network for different throughput requirements. The total costs converge in a slower manner for high minimum requirements, than when
ρmin is taken to be smaller value.
6. Conclusions
[image:5.595.311.538.523.708.2]A study of ITPC access network project 2010 in Baghdad by taking Al-Gehad FTTH network as a study case has been done. A study of link utilization of channel capacity
Figure 5. Number of PONs vs. Take rate.
Figure 6. EPON-to-GPON Cost Ratio.
Figure 7. GPON Feeder Link Capacity vs. Number of ONUs.
Figure 8. GPON Distribution Link Capacity vs. Number of ONUs.
0 0.1 0.2 0.3 0.4 0.5 0.6 0.7 0.8 0.9 1
0 5 10 15 20 25 30 35 40
Take rate
N
u
m
b
e
r of
s
e
g
m
ent
s
GPON Up(46B) GPON Up(1500B) EPON(One OLT)Up(46) EPON (One OLT)Up(1500) EPON (Two OLTs)Up(1500)
0.5 1 1.5 2 2.5 3 3.5 4
1.2 1.3 1.4 1.5 1.6 1.7
Cycle time (ms)
Co
s
t
R
a
ti
o
Up (payload 1500B) Down (payload 1500B) Up (payload 46B) Down (payload 46B)
0 20 40 60 80 100 120 140
20 30 40 50 60 70 80
Number of ONUs
D
is
tri
bu
ti
on
C
o
s
t (
M
b
p
s
)
Distribution Cost
R=20Mbps, ?min=32Mbps R=20Mbps, ?min=10Mbps R=20Mbps, ?min=0.5Mbps
0 20 40 60 80 100 120 140
20 30 40 50 60 70 80
Number of ONUs
D
ist
ri
b
u
ti
o
n
C
o
st
(
M
b
p
s)
Distribution Cost
[image:5.595.61.286.535.717.2]Figure 9. Total Cost of GPON Resources Vs. Number of ONUs.
in both EPON and GPON has been done and uses that information to compare the cost of these two systems. From the numerical results we can say that the GPON system uses the link capacity more efficiently than EPON system does. The cost to build an EPON or GPON system is almost the same, the relative cost is affected widely by the cost of transceivers. For example, for VoIP service, the GPON transceiver is about 70% more expen-sive than EPON transceivers.
In this work we can find that GPON network planners should take into their considerations the number of de- manding and basic services that will be supported on each PON (OLT port) to achieve traffic balancing among all PONs. Link utilization can be used to calculate the number of subscribers that can be supported on a single PON and then can determine the size of population and services that can be supported on OLT ports.
An optimization problem has been formulated to find the optimal capacity and cost of GPON access network links guarantee that a minimum throughput can be en-sured for supported traffic classes.
REFERENCES
[1] I. Cale, A. Salihovic, M. Ivekovic and T-HTd. D. Split, “Gigabit Passive Optical Network—GPON,” 29th Inter- national Conference ITI 2007.
[2] S. Lallukka and P. Raatikainen, “Link Utilization and Comparison of EPON and GPON Access Network Cost,”
Proceeding of IEEE Globecome, 2005.
[3] S. Kulkarni, M. El-Sayed, P. Gagen and B. Polonsky, “FTTH Network Economics: Key Parameters Impacting Technllogy Decisions,” Network Planning-Bell Labs, Alcatel-Lucent Technologies, 2010.
[4] M. Vaughn, D. Kozischek, D. Meis, A. Boskovic and R. Wagner, “Value of Reach and Split Ratio Increase in FTTH Access Network,” Journal of Lightwaves Tech- nology, Vol. 22, No. 11, 2004.
[5] C. Bolu, A. Talulade and A. Adeshina, “University Opti- cal Fiber Network Access Optimization: A Case Study,”
International Journal of Mechanical & Mechatronics En-gineering, Vol. 12, No. 6, 2012.
[6] ITPC Documents, Reports, and Maps.
[7] D. Nowak, “Dynamic Bandwidth Allocation Algorithms for Differentiated Services enabled Ethernet Passive Opt-ical Networks with Centralized Admission Control,” Ph.D. Thesis, 2005.
[8] H. Alshaer and J. J. Elmirghani, “Enabling Novel Pre- mium Service Classes in DiffServover MPLS-Enabled Network,” International Journal of Network Management, Vol. 18, 2008, pp. 447-464.
http://dx.doi.org/10.1002/nem.693
[9] M. D. Vaughn, D. Kozischek, D. Meis, A. Boskovic and R. E. Wanger, “Value of Reach-and-Split Ratio Increase in FTTH Access Networks,” Journal of Lightwave Tech-nology, Vol. 22, No. 11, 2004, pp. 2617-2622.
http://dx.doi.org/10.1109/JLT.2004.836741
[10] S.ami Lallukka and P. Raatikainen, “Link Utilization and Comparison of EPON and GPON Access Network Cost,” Proceedings of IEEE Conference on Global Telecommu-nications, 2005.
[11] H. Alshaer, R. Shubair and M. Alyafei, “A Framework for Resource Dimensioning in GPON Access Network,”
International Journal of Network Management, Vol. 22, No. 3, 2011, pp. 199-215.
0 20 40 60 80 100 120 140
40 45 50 55 60 65 70 75 80 85 90
Number of ONUs
T
o
ta
l C
o
s
t (
M
b
p
s
)
Total Cost
![Figure 3. Segmented PON layout [10].](https://thumb-us.123doks.com/thumbv2/123dok_us/7866043.737791/3.595.317.534.84.196/figure-segmented-pon-layout.webp)